
Disney Data Dump September 21st 2022
New blog series, who dis? We know that you come to TouringPlans because of all of our data. And other than sporadic crowd calendar updates or annual reviews of how our predictions did, we haven’t been sharing much “real-time” data in the blog to help you plan your upcoming trip. So each Wednesday I’ll be giving you a quick review of timely Disney Data so that you can see things that happened in the Disney World parks in the past week. And I’ll take a quick look forward at things you need to know for the upcoming week if you have a trip planned.
Observed Crowd Levels 9/12 – 9/19

We’re moving out of the least-crowded time of the year at Walt Disney World (the week or two post-Labor Day) and into more of the regular fall pattern. We started to see this with a crowd level 6 on Monday, September 19th. Expect to see some more of these “medium” crowd levels as we get into late September.

The one park I need to call out specifically here is Magic Kingdom. Look at that wild and wacky crowd level bouncing around all over the place! Want to guess what was happening in the Magic Kingdom on those asterisk days that all ended up crowd level 1?? If you guessed “Halloween Party” you get a Disney Data Gold Star. In case you haven’t been convinced by my TP Teaches video about why you should go to Magic Kingdom on party days, maybe this data will prove my point for me.
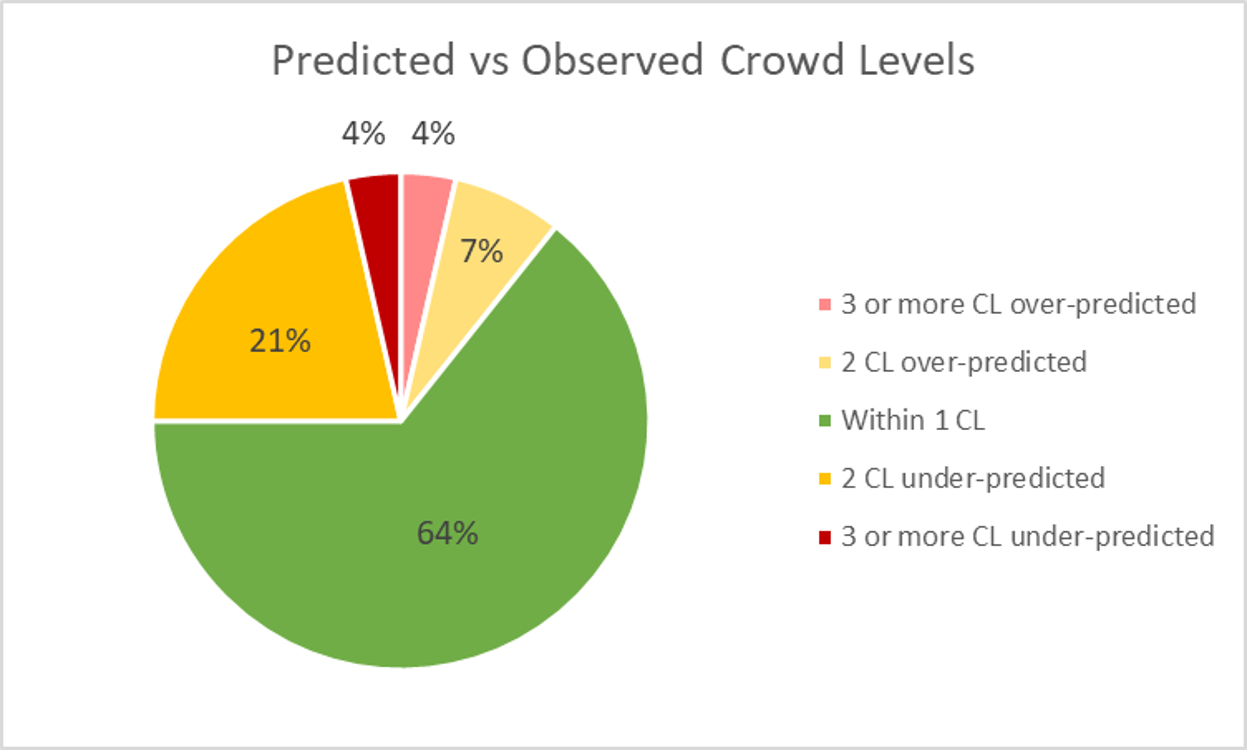
Each week, I’ll be giving you a very transparent look into how our crowd level predictions performed. Each day at each park is one data point, so we’ll have 28 different crowd level predictions to evaluate each week. Any time a prediction is within one or two crowd levels, things won’t really “feel” much different than what we predicted. Being off by 3 or more crowd levels is where we’d like to be more accurate because you might feel that difference in wait times throughout the day.
In the past week, our predictions were either spot-on or within 1 crowd level 64% of the time. Yay! And 92% of the time we were within 2 crowd levels. I’d give us an A- for those results. On two park days, we were off by 3 or more crowd levels. On September 18th, we predicted that EPCOT would see a crowd level 6, and instead it was a 3. More pleasant than expected, but still a miss. And on September 19th, we predicted that Magic Kingdom would be a crowd level 4, and instead it was a 7. This is a bigger increase in between two party days than we expected. But last Monday (also sandwiched between two party days) was a 6. The next two Mondays (September 26th and October 3rd) should see very similar upticks in crowd levels.
Attraction Downtime 9/12 – 9/19
If we average out all of the capacity lost due to unexpected downtime over the past week, it comes out to 4.3% of attractions unexpectedly being down. A lot of that is due to a bunch of ugly weather in Orlando in the past week. The park with the biggest issues was Animal Kingdom (5.6% of capacity lost), which isn’t surprising when downtime is due to weather since it has a large portion of its attractions outdoors that go down when inclement weather is in the area.

The single worst day for attraction downtime in the past week was September 16th. On that day, 8% of all capacity at WDW was lost due to unexpected downtime. Ouch. That can have a big impact on what you’re able to do in a park day. The single worst park-day of the past week was at Animal Kingdom on September 14th. That day, 11% of the park’s capacity was lost due to unexpected downtime. I apologize on behalf of Disney if you were in the park that day. Thankfully, it didn’t have much impact on wait times (still just a crowd level 2), but it was likely frustrating anyway.
What about at the attraction level? The worst offender was Expedition Everest, which was unexpected down for over 18% of the week, including being down 45% of the day on September 17th. Not far behind was the always-down Test Track, which was offline for 17% of the week. On its worst day – September 14th, it lost 36% of its capacity. Next on the list of “most unavailable” was the Peoplemover at Magic Kingdom, which was down 16% of the week. This was mostly due to two AWFUL days – September 12th, when it was down 67% of the day, and September 13th, when it was down 45% of the day.
Wait Times 9/12 – 9/19
Attractions with the Highest Average Wait at each park
- Hollywood Studios: Rise of the Resistance, average posted wait time of 74 minutes
- Animal Kingdom: Flight of Passage, average posted wait time of 61 minutes
- EPCOT: Frozen Ever After, average posted wait time of 55 minutes
- Magic Kingdom: Seven Dwarfs Mine Train, average posted wait time of 54 minutes
These numbers won’t mean much by themselves, but in future weeks we’ll be able to do comparisons of whether these attractions change, or how much their posted wait times shift around.
That being said, one data point should immediately jump out to any Genie experts reading this post. At Hollywood Studios, Animal Kingdom and Magic Kingdom, the attractions with the highest wait times are the Individual Lightning Lane options. EPCOT bucks the trend since its Individual Lightning Lane attraction has a virtual queue. That makes Frozen Ever After an excellent use of Genie+.

Parks with the Highest and Lowest Average Wait
These parks likely won’t change week-to-week unless something ridiculous happens, but these data points will give us a high-level view of how wait times are trending from week to week.
- Highest: Hollywood Studios, average park-wide posted wait of 37 minutes
- Lowest: EPCOT, average park-wide posted wait of 21 minutes
Hollywood Studios has a lot of popular high-wait attractions and not much to balance them out other than shows, which don’t have posted wait times. EPCOT, on the other hand, has a few big waits and a lot of people-eating low-wait options. And Cosmic Rewind doesn’t have a posted wait time to contribute since it’s still using the virtual queue. We’ll see how these overall numbers change over the next week.
Most Inflated Posted Wait Times
We all know that Disney inflates their posted wait times on purpose. They have many reasons for doing this. Some are totally understandable, and some are potentially more … problematic. We can figure out how much posted wait times are being inflated by comparing submitted actual wait times from the Lines App and the posted wait time when the person timing their wait entered the line.
From September 12th through 19th, actual wait times in the Lines App averaged 70% of what was posted. So if the posted wait time was 20 minutes, you could’ve expected to wait about 14 minutes instead.
But the worst offender for the week was Buzz Lightyear’s Space Ranger Spin. At this one attraction, submitted actual wait times were 42% of posted wait times. That means if Buzz had a 50 minute posted wait, you probably would’ve waited 21 minutes. Less than half of what was posted. Remember to always check the Lines app for predicted actual waits instead of believing what is posted.

Looking Ahead: September 20th through 26th
Since it takes time to pull data and write a post, you’ll be reading this on the 21st when the 20th is already in the past. But I’m going to stay as close to real-time as possible.
The big lookout over the next week is Magic Kingdom because of those highly variable crowd levels. There are Halloween Parties scheduled for September 20th, 23rd, 25th and 27th. You can expect really nice, low wait times on those days. The 24th and 26th will have much higher crowd levels, and I would suggest avoiding Magic Kingdom on those days.
The weather looks mostly better this upcoming week, with an especially sunny (and hot) streak from the 22nd through the 25th. That should mean less unexpected downtime.
What data would you like to see in this weekly Disney Data Dump? Did you earn a Disney Data Gold Star? More opportunities to earn them next week 🙂
You May Also Like...
-

A small bit of DCL news dropped today with dates for sailings in late April and May 2022 for the Disney…
-

Although cruising has yet to resume on Disney Cruise Line, signs are looking positive that ships could once again sail the…
-

Today, the Walt Disney World Resort dropped a bombshell! Beginning in 2022, Guests will no longer be able to use Disney's…
-

It’s great to share some good news for a change - the early 2022 DCL itineraries have been announced today! The…
What a dream the 20th was thanks to TP! We arrived at almost 11 and left at 5:30 and accomplished 15 of the 16 things on our touring plan because I was just too tired to do the last but could have made the full list. Our 16 included Gaston’s for lunch and Aloha Isle for treats. It was so empty, I could not record actual wait times on some rides. I cheated a little when our Splash ride was literally walk on so I could not record but we were stalled a few minutes so I started and stop a timer while waiting to send 1 minute to the data set which was realistic :). My 15 min Seven Dwarfs ride did not get recorded because the timer did not stop (lost connection likely) and I noticed when it was at 40 minutes so canceled that one.
That sounds like an incredibly fantastic day! Glad that you got to enjoy it 🙂
Thanks for this, Becky! I would love to see more data on downtimes for various rides, specifically at the all-important Rope Drop time. It’d be nice to know which rides tend to be down at the start of the day, and how to then zig when others zag.
Thanks for all you do!
Specific rope drop downtime! That’s an excellent idea. Added to the list for next week.
Love this article, and absolutely yes: I’m here for the data. Data nerd + Disney data? Sounds like heaven to me!
Glad you’re here for it, Lindsay!