Disney Data Dump September 28th 2022
Well, this is a fun and weird week for our second-ever Disney Data Dump! We’ll see next week how Hurricane Ian and the related necessary closures impact the data. But this Wednesday I’ll be giving you a quick review of timely Disney Data so that you can see things that happened in the Disney World parks in the past week. And I’ll take a quick look forward at things you need to know for the upcoming week if you have a trip planned. That part will be really interesting today.
Observed Crowd Levels 9/20 – 9/26

We’ve got our first crowd level 7 day of the fall! The 20th and 21st were nice, but – excluding next week – expect to see more of the yellows and oranges as we move into October and fall breaks, long weekends, etc.
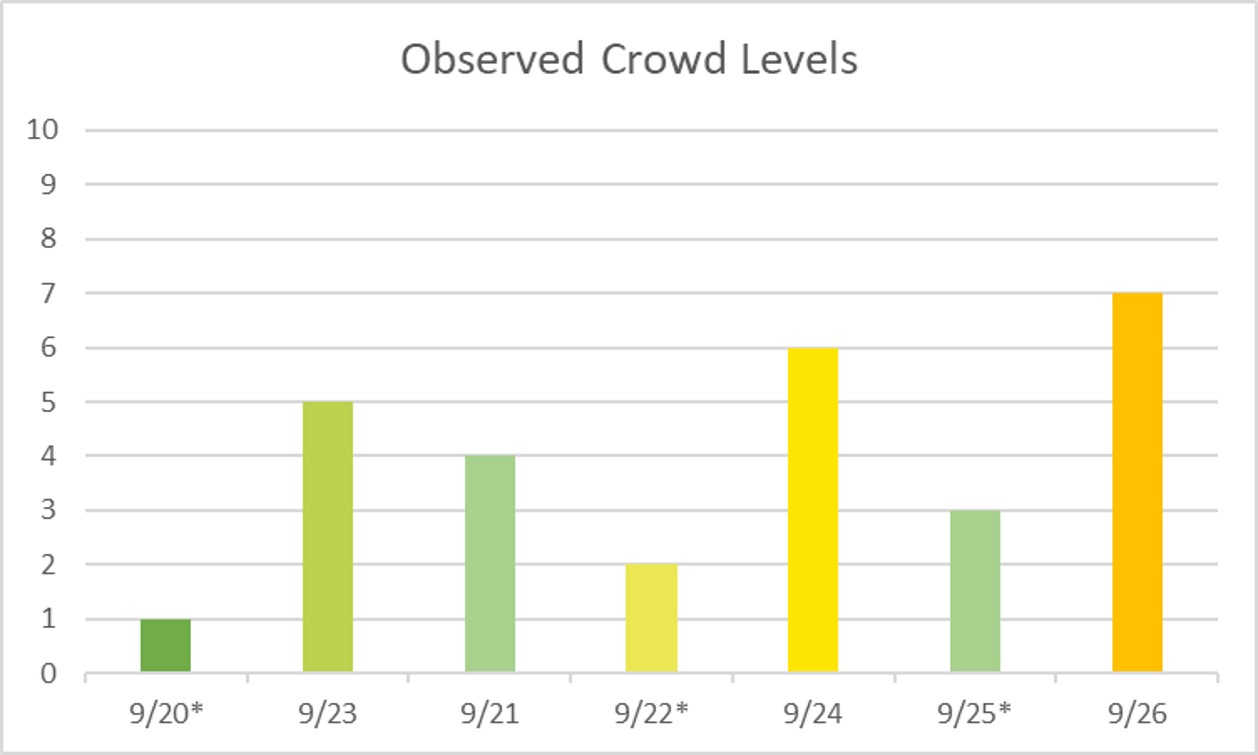
Another first this week are party dates that weren’t a crowd level 1. But don’t despair! Crowds and wait times are still disproportionally low on party days. I’d much rather be in Magic Kingdom on a crowd level 3 day than a 6 or a 7. You’re not going to be able to walk on to everything on party days as we move into October, but you’ll still have a very pleasant experience compared to those non-party days.

Each week, I’m giving you a very transparent look into how our crowd level predictions performed. Each day at each park is one data point, so we have 28 different crowd level predictions to evaluate each week. Any time a prediction is within one or two crowd levels, things won’t really “feel” much different than what we predicted. Being off by 3 or more crowd levels is where we’d like to be more accurate because you might feel that difference in wait times throughout the day.
In the past week, our predictions were either spot-on or within 1 crowd level 64% of the time. Yay! That’s the same as last week! And 89% of the time we were within 2 crowd levels. I’d give us an B+ for those results. On three park days, we were off by 3 or more crowd levels. I did call out last week that we’d likely see at least a CL 7 at Magic Kingdom on Monday the 26th, which we did. Assuming no long-lasting havoc from Ian, Monday October 3rd will also be pretty crowded.
It looks like, in general, fall crowds are picking up a little earlier than we expected them to this year. When we’re missing, the crowds are always higher than we expect. Next week is going to be a weird one, but keep this in mind as you look forward to trips in the next couple of weeks.
Attraction Downtime 9/20 – 9/26
If we average out all of the capacity lost due to unexpected downtime over the past week, it comes out to 3.1% of attractions unexpectedly being down. This is significantly better than last week (4.3%), and is due to more sunny weather! Hope you all enjoyed that while it lasted … The park with the biggest issues was EPCOT (4.6% of capacity lost), which is different from our “loser” park last week, Animal Kingdom. EPCOT has more inherent unreliability, while Animal Kingdom is more susceptible to weather issues.

The single worst day for attraction downtime in the past week was September 26th. On that day, 5% of all capacity at WDW was lost due to unexpected downtime. That’s still not great, but a lot better than the high of 8% we had last week … and a lot better than the high of “100%” I’m predicting over the next week for at least one day. We’ve got a tie for the single worst park-day of the past week, at EPCOT on September 25th and Hollywood Studios on September 24th. On those days, 8% of the parks’ capacity was lost due to unexpected downtime. Downtime may have had an much impact on wait times (EPCOT was predicted to be a 5 and ended up a 7, and Studios was predicted to be 5 and ended up a 6), but nothing too terrible..
What about at the attraction level? The worst offender was Test Track, which was unexpectedly down for over 24% of the week, including being down 76% of the day on September 21st. Yikes! Sorry, once-in-a-life-timers hoping to ride Test Track that day. Not far behind was the always-down Frozen Ever After, which was offline for 18% of the week. On its worst day – September 25th, it lost 89% of its capacity. Next on the list of “most unavailable” was Rise of the Resistance, which was down 12% of the week.
Last week, a savvy reader asked about which rides had the worst downtime right at park opening. I loved that question! So now we have a new recurring segment – rope drop downtime. Here are the problematic offenders:
- Magic Kingdom: Splash Mountain (unavailable for 54% of its first hour of the day), PeopleMover (unavailable for 29% of its first hour of the day), and Seven Dwarfs Mine Train (unavailable for 17% of its first hour of the day)
- EPCOT: Test Track (unavailable for 35% of its first hour of the day), and Remy’s Ratatouille Adventure (unavailable for 18% of its first hour of the day)
- Hollywood Studios: Rise of the Resistance (unavailable for 20% of its first hour of the day)
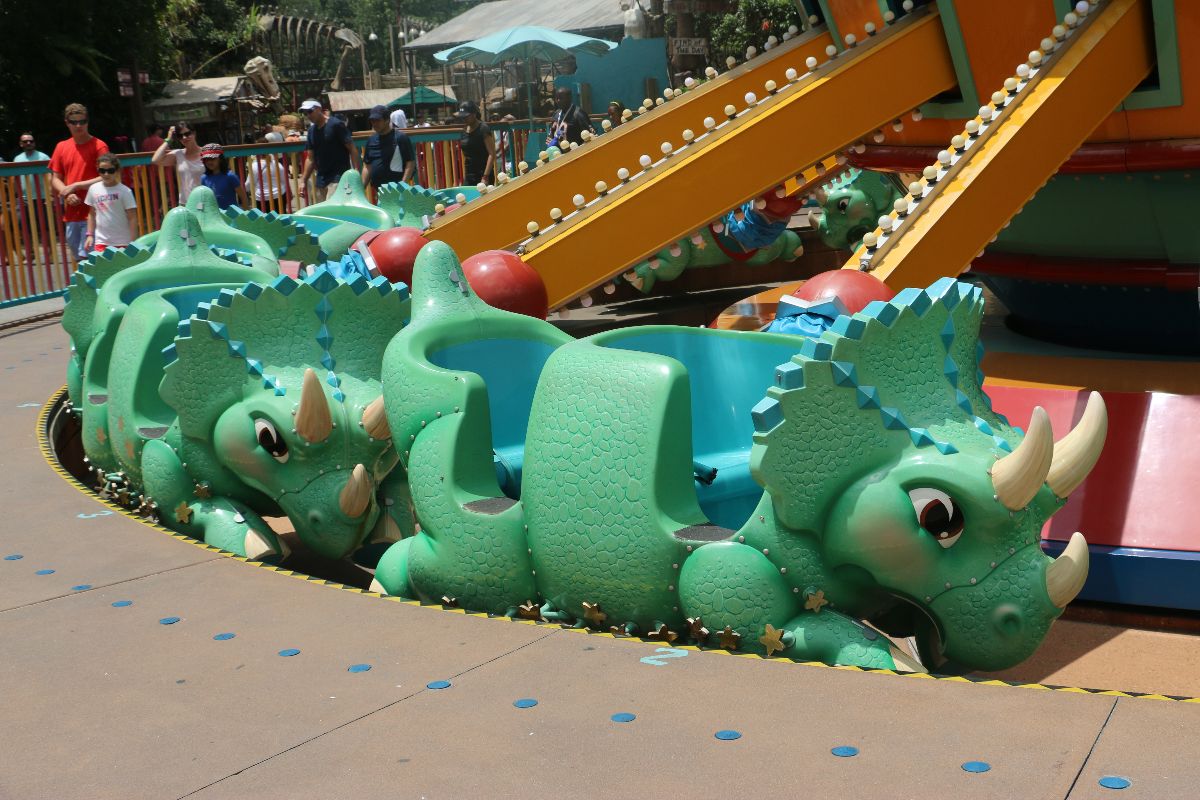
- Animal Kingdom: TriceraTop Spin (unavailable for 11% of its first hour of the day)
So … if you’re rope-dropping TriceraTop Spin, you have bigger problems in your life. But this could legitimately impact strategies for Magic Kingdom, EPCOT and Hollywood Studios. I already recommend not starting your Magic Kingdom day with Seven Dwarfs Mine Train. Hit Peter Pan’s Flight first. But Remy and Rise of the Resistance are the obvious early entry rope-dropping options at their respective parks. If they’re down, it’s a problem. Be sure to have a backup plan in place.
Wait Times 9/20 – 9/26
Attractions with the Highest Average Wait at each park
- Hollywood Studios: Rise of the Resistance, average posted wait time of 88 minutes (74 last week)
- Animal Kingdom: Flight of Passage, average posted wait time of 71 minutes (61 last week)
- EPCOT: Frozen Ever After, average posted wait time of 65 minutes (55 last week)
- Magic Kingdom: Seven Dwarfs Mine Train, average posted wait time of 58 minutes (54 last week)
Most of these average wait times across a week are at least 10 minutes higher than they were last week. An additional 10 minutes of waiting for a headliner isn’t a long time, but it’s indicative of wait times inching up as we move into October.
Parks with the Highest and Lowest Average Wait
These parks likely won’t change week-to-week unless something ridiculous happens, but these data points will give us a high-level view of how wait times are trending from week to week.
- Highest: Hollywood Studios, average park-wide posted wait of 41 minutes (last week 37 minutes)
- Lowest: Magic Kingdom, average park-wide posted wait of 23 minutes (last week, EPCOT with 21 minutes)
We have a switch! Unexpected, and mostly due to a lot of downtime at EPCOT driving up wait times at that park. We’ve also had 3 low-crowd days at Magic Kingdom thanks to Halloween parties, which drives its average wait time down.
Most Inflated Posted Wait Times
We all know that Disney inflates their posted wait times on purpose. They have many reasons for doing this. Some are totally understandable, and some are potentially more … problematic. We can figure out how much posted wait times are being inflated by comparing submitted actual wait times from the Lines App and the posted wait time when the person timing their wait entered the line.
From September 20th through 26th, actual wait times in the Lines App averaged 68% of what was posted. So if the posted wait time was 20 minutes, you could’ve expected to wait just less than 14 minutes instead.
But the worst offender for the week was Toy Story Mania. At this one attraction, submitted actual wait times were 54% of posted wait times. That means if Toy Storia Mania had a 50 minute posted wait, you probably would’ve waited 27 minutes. Just over half of what was posted. Remember to always check the Lines app for predicted actual waits instead of believing what is posted.
Looking Ahead: September 27th through October 3rd
Since it takes time to pull data and write a post, you’ll be reading this on the 28th when the 27th is already in the past. But I’m going to stay as close to real-time as possible.
This week … all bets are off regarding predictions. I’m no meteorologist, but it looks like some big storm is making its way to Orlando. We already know that the parks will be closed for at least two days, and that MCO will be shut down, so this will impact crowds not only on closure days, but for a few days afterward as well. That means next week, we’ll get to do a couple of N/A crowd levels and see how that throws off our analysis – yay for nulls!
You May Also Like...
-

New blog series, who dis? We know that you come to TouringPlans because of all of our data. And other than…
-

A small bit of DCL news dropped today with dates for sailings in late April and May 2022 for the Disney…
-

Although cruising has yet to resume on Disney Cruise Line, signs are looking positive that ships could once again sail the…
-

Today, the Walt Disney World Resort dropped a bombshell! Beginning in 2022, Guests will no longer be able to use Disney's…
Looks like 100% of all attractions will be offline for a couple of days.
If you are down there, be safe.
Yep! It’ll be a weird week. Thankfully, I am in St. Louis. But keeping close track of friends down that way!