Disney World Crowd Report – December 21 to 27, 2014
Christmas crowds at Walt Disney World are not hard to predict. Imagine long lines all day at even the most minor attractions, crowded restaurants and over-packed buses. But it is significantly more difficult to predict which park will be more crowded than the others and we did that with great success last week.
Let’s look at how the crowd levels stacked up each day last week:
| WHAT WE THOUGHT |
WHAT WE SAW |
ANALYSIS | |
|---|---|---|---|
| Magic Kingdom |
7
|
6
|
Crowds between mid-December and Christmas go through a short-lived transition. Pre-Christmas crowds are light while Christmas crowds are extreme. In between are the ‘6’s and ‘7’s that we saw Sunday. |
| Epcot |
9
|
7
|
|
| Hollywood Studios |
7
|
6
|
|
| Animal Kingdom |
7
|
8
|
|
| WHAT WE THOUGHT |
WHAT WE SAW |
ANALYSIS | |
| Magic Kingdom |
8
|
8
|
Monday’s crowds matched what we predicted except at Animal Kingdom where wait times came in a couple points higher. DINOSAUR averaged 51 minutes (predicted 37) while our prediction of 52 minutes at Expedition Everest matched what we observed. |
| Epcot |
10
|
10
|
|
| Hollywood Studios |
8
|
8
|
|
| Animal Kingdom |
7
|
9
|
|
| WHAT WE THOUGHT |
WHAT WE SAW |
ANALYSIS | |
| Magic Kingdom |
9
|
7
|
Epcot hit the maximum level on our scale more often than the other parks last week, including on Tuesday. Soarin’ averaged 105 minutes as predicted while Magic Kingdom saw the lowest relative waits like 48 minutes at Big Thunder Mountain Railroad. |
| Epcot |
10
|
10
|
|
| Hollywood Studios |
9
|
8
|
|
| Animal Kingdom |
8
|
8
|
|
| WHAT WE THOUGHT |
WHAT WE SAW |
ANALYSIS | |
| Magic Kingdom |
10
|
8
|
Wednesday, Christmas Eve, was the biggest surprise of the week. Wait times stayed at least one level lower than expected at each park. The level ‘5’ at Animal Kingdom will prove to be the lowest park level of the week. |
| Epcot |
9
|
8
|
|
| Hollywood Studios |
8
|
7
|
|
| Animal Kingdom |
9
|
5
|
|
| WHAT WE THOUGHT |
WHAT WE SAW |
ANALYSIS | |
| Magic Kingdom |
10
|
10
|
A clean sweep of accurate park-level predictions on Christmas Day Thursday. The Studios and Animal Kingdom saw wait times 10 to 15 minutes lower at the Super Headliners compared to the other parks. |
| Epcot |
10
|
10
|
|
| Hollywood Studios |
8
|
8
|
|
| Animal Kingdom |
8
|
8
|
|
| WHAT WE THOUGHT |
WHAT WE SAW |
ANALYSIS | |
| Magic Kingdom |
10
|
9
|
Friday, like Wednesday, saw wait times come in a little lower than history would suggest, although not by much. Animal Kingdom saw the lowest average wait times, like 44 minutes at Kilimanjaro Safaris (predicted 48). |
| Epcot |
9
|
9
|
|
| Hollywood Studios |
8
|
8
|
|
| Animal Kingdom |
9
|
7
|
|
| WHAT WE THOUGHT |
WHAT WE SAW |
ANALYSIS | |
| Magic Kingdom |
10
|
10
|
Magic Kingdom had the highest wait times on Saturday as predicted although The Studios wait times were slightly lower than expected. Space Mountain averaged 92 minutes (predicted 93), Test Track 92 (predicted 96), Toy Story Midway Mania 94 (as predicted) and Kilimanjaro Safaris averaged 46 minutes (predicted 45). |
| Epcot |
9
|
9
|
|
| Hollywood Studios |
10
|
8
|
|
| Animal Kingdom |
8
|
8
|
|
| December 28, 2014 to January 3, 2015 |
|---|

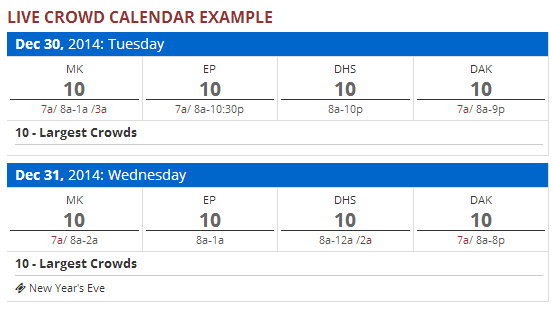
Christmas crowds have been extreme as expected but slightly lower than history would suggest. We don’t expect this to continue however. Next week will be the busiest week of the year.
To see Walt Disney World Crowd predictions for the days of your vacation, check the Crowd Calendar.
To get details about our predictions of future crowds or details about crowds in the past check out the Crowd Calendar and select “Jump to Date” on the left margin.


