Disneyland Resort Crowd Report – December 21 to 27, 2014
Last week our resort level predictions matched what we saw every day, that is why we don’t see a blue line on the Overall Crowd Level Chart. Our park level predictions hit the mark most days as well with none missing by more than one index level. Both parks saw days with average wait times that hit a level ’10’ on our scale.
Let’s look at how the crowd levels stacked up each day last week on the TouringPlans.com Disneyland Resort Crowd Report:
| WHAT WE THOUGHT |
WHAT WE SAW |
ANALYSIS | |
|---|---|---|---|
| Disneyland Park |
9
|
9
|
Sunday’s average wait times were 53 minutes at Indiana Jones Adventure (predicted 51) and 100 minutes at Radiator Springs Racers (predicted 99) which helped our park level predictions match what we observed. |
| Disney California Adventure |
8
|
8
|
|
| WHAT WE THOUGHT |
WHAT WE SAW |
ANALYSIS | |
| Disneyland Park |
10
|
10
|
Another day of perfect predictions at both parks on Monday. Every attraction at Disneyland Park hit a level ’10’ on our scale including Mr Toad’s Wild Ride (34 minutes) and Roger Rabbit Cartoon Spin (48 minutes). |
| Disney California Adventure |
9
|
9
|
|
| WHAT WE THOUGHT |
WHAT WE SAW |
ANALYSIS | |
| Disneyland Park |
10
|
10
|
Tuesday’s crowds matched what we saw on Monday, both in the wait times and the success of our predictions. its a small world averaged 39 minutes, as high an average as you’ll ever see at that attraction. |
| Disney California Adventure |
9
|
9
|
|
| WHAT WE THOUGHT |
WHAT WE SAW |
ANALYSIS | |
| Disneyland Park |
9
|
8
|
Wednesday was the only day where our predictions missed at both parks although they only missed by one level. |
| Disney California Adventure |
7
|
8
|
|
| WHAT WE THOUGHT |
WHAT WE SAW |
ANALYSIS | |
| Disneyland Park |
10
|
10
|
Christmas Day on Thursday brought another ’10’ at Disneyland Park and a ‘9’ at Disney California Adventure just like Monday and Tuesday. |
| Disney California Adventure |
9
|
9
|
|
| WHAT WE THOUGHT |
WHAT WE SAW |
ANALYSIS | |
| Disneyland Park |
10
|
10
|
Friday’s crowds were slightly larger at Disney California Adventure thanks to average wait times like 145 minutes at Radiator Springs Racers (predicted 115). |
| Disney California Adventure |
9
|
10
|
|
| WHAT WE THOUGHT |
WHAT WE SAW |
ANALYSIS | |
| Disneyland Park |
10
|
10
|
More large crowds on Saturday at both parks. Wait times at Disneyland park averaged 67 minutes at Matterhorn Bobsleds (predicted 70) and 35 at Gadget’s Go Coaster (predicted 40). |
| Disney California Adventure |
9
|
10
|
|
| December 28, 2014 to January 3, 2015 |
|---|
The first week of the Christmas Holiday break is over and next week will bring the most crowded week of the year, by far. Guests need to arrive early use Fastpass and follow a good touring plan religiously.
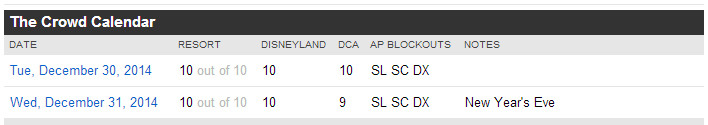
To see Disneyland Resort Crowd predictions for the days of your vacation, check the Crowd Calendar.![]()
To get details about our predictions of future crowds or details about crowds in the past check out the Crowd Calendar and select “Jump to Date” on the left margin.
You May Also Like...
-

Disneyland is Opening! On April 30, 2021, Disneyland will reopen to Californians for the first time since March 13, 2020. The…
-

Since September 1, 2019, crowds at Disneyland Resort and Universal Orlando Resort have been down compared to the same time in…
-
Everyone's number one priority right now is to help slow the spread of COVID-19 by practicing social distancing. Disney did their…
-

If you are hoping to get to visit the Disneyland Resort soon, it appears that may not be an option. According…
i found the crowd report informative and interesting thanks for the info