
2022: Which Dates Went Up In Price This Year At Disney World?
For Disney World fans, February has a distinct zeitgeist as the month of regular ticket price increases. Early on, those in the know will mumble about “getting your tickets soon before prices go up”, but there’s still a feeling of uncertainty. Then the hammer drops, and it’s all about finding a vendor who still has pre-increase tickets to sell. (Our Ticket Price Comparison Tool can help you with that).
Last week Disney raised prices on almost half the remaining days in 2022. This week I’ll break down exactly where those increases are, so that you can know what to expect based on when you’re going. If you don’t care about analysis and just want to see the price right now, we’ve updated them in our post that has them all laid out.
Oh and one more thing … a couple of months ago I took a look at price increases over the last 4 years, and I made a few predictions about the future. Do you want to know how good my crystal ball was? I’ll cover that too.
What Dates Went Up?
And by how much? Disney increased 144 of the remaining 319 dates in 2022, but they weren’t equally distributed. The heatmap below shows which days went up and by how much.

Ho-kay. If you are visiting in October, November, or December and you didn’t already buy your tickets — get yourself to a reseller right now. Don’t stop, don’t pass go, and don’t collect $200.
Other than the last 3 months, and a few mid-week dates in May, increases are mostly either small (only $1-2), or confined to Saturdays. For multi-day tickets the range of increases is shown below, and as you might expect they follow a similar pattern to the single-day raises.

How Does This Compare To The Past?
The difficulty with comparing prices year-to-year is that now there are so many of them. When Disney first went to variable-date pricing, there were only three tiers: Value, Regular, and Peak. The Holiday tier soon followed, and comparing across four tiers doesn’t seem so bad. But after that, everything went kerplooie — now there are commonly 18-21 different prices for a single day ticket in one year.
We can get a sense of how the prices are changing by using a bubble chart, where the size of each bubble shows how many days have that ticket price.
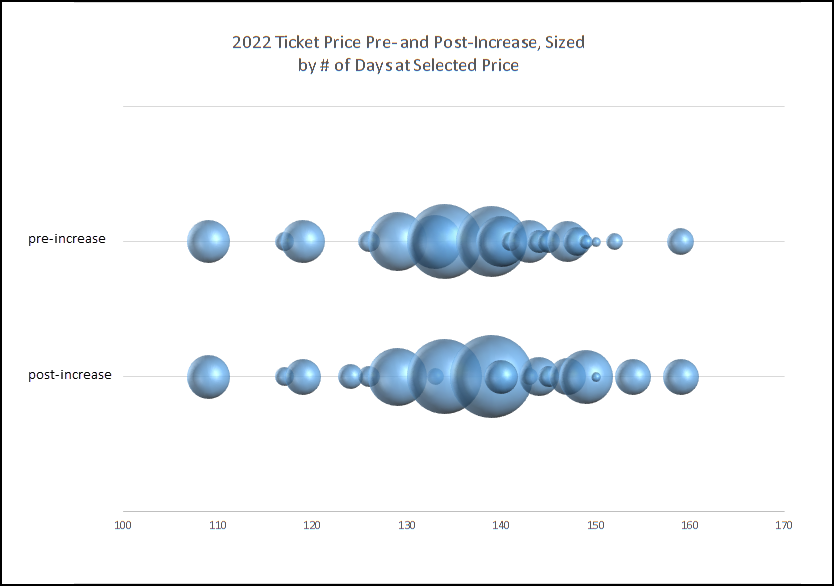
These look pretty similar at first glance, but if you take a second look you can see how the weight is “pushing” towards the right as the prices go up. This doesn’t solve our comparison problem though. To try to get at something we can stack up head-to-head, we need to map these prices back into 4 tiers. Luckily, I already did this when I did the 4-year analysis a little bit ago, so I’ll just build on that.

In the figure above, the top row is the original prices, with their original tier assignments. The second row shows the post-increase prices, but the tiers use the same cutoffs as we did before, so Regular starts at $126, and Peak starts at $143. The problem with this is that the words “Value”, “Regular”, and “Peak” have intrinsic meaning. If bananas are on sale all the time, then it isn’t really the sale price, it’s the regular price, right? And if half the days are in “Peak” then it’s hard to argue that it isn’t “Regular”. So as the prices increase, we move the thresholds to keep about the same number of tickets in each category.
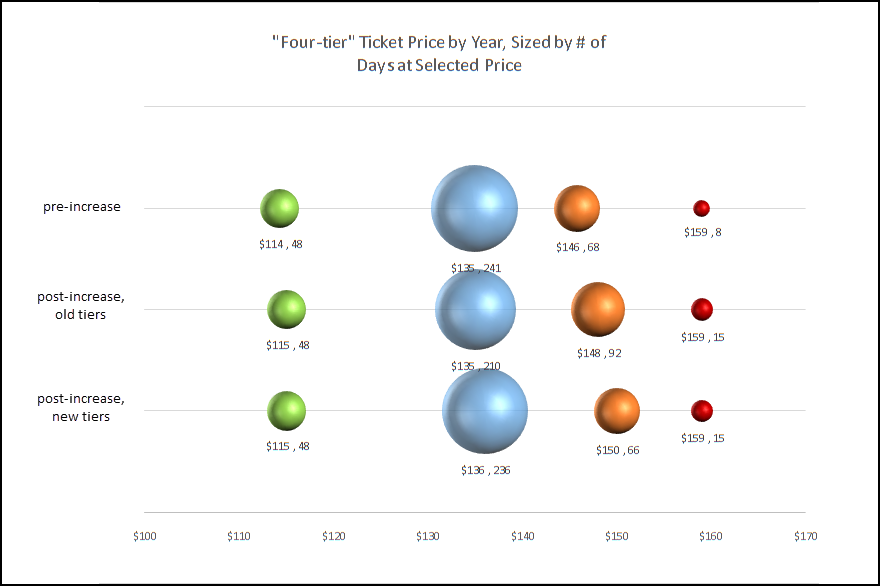
In this version of the chart it’s easy to see how the original thresholds changed the distribution of tickets, with Peak starting at 68 days, jumping up to 92, and then coming back to 66 days when we adjusted the ranges. And one other thing that stands out (if you didn’t already notice it) is the increase in the Holiday tier; it’s almost doubled. I’m going to come back to that in a few minutes, but now we’re ready to compare to historical data.

In the earlier analysis, we saw increases that were right in line with historical raises; mostly $3-5 per year. Now we’ve had a second raise in the same year, and in each tier the numbers are really on the upper edge of what we seen in the past.
An interesting thing is that the Peak tier seems to be repeating a pattern that we saw before. What does it mean? If I had to guess, it just means that a pandemic got in the way of whatever was supposed to happen to this tier in 2020 and 2021. I doubt we’re going to see the pricing of this tier remain flat in 2023.
What About That Crystal Ball?
OK, the time of reckoning has arrived, and it doesn’t start off well. In that earlier article, I pretty freely bandied about the idea that Disney would continue to silently raise ticket prices as they released new dates instead of putting out this kind of across-the-board increase as they had done in the past. Well, feh! I definitely didn’t get that one right. It wasn’t all misses though, let’s take a look at the rest.
Within 2 years Thursday, Friday, and Saturday of Thanksgiving weekend will officially become part of the Holiday tier.
This one’s looking pretty good, hey? I gave it two years and it was a little under two months. And not just Thursday, Friday, and Saturday, but the rest of the week to boot!
We’ll continue to see those disproportionate increases for January, February, and September weekends.
The theory here was that these increases would be driven by a captive weekend audience for Epcot Festivals; people who want to go but are unable to make it during the week. I’ll repeat that chart from the top here so we can have a good look without having to scroll.
I’m going to go with the spirit of the claim here and not the letter of it, and give myself a gold star. September maybe not so much. But February is dead on, and there are heavy increases on Saturdays in March, April, and May corresponding to weekends during Flower & Garden. October is up overall, but the weekends are up twice as much as the weekdays. April weekends aren’t up as much, but that’s partly because they were already quite high. Take a look and you’ll see that weekends are now pretty consistently priced across all of February through May, and then October through December.

Can it really be just Festivals driving those weekend prices? I don’t know, and I admit that seems hard to believe. But it’s definitely something. And it definitely seems to coincide with Festival season. I wouldn’t stake my firstborn on this, but it would be foolish not to at least note the correlation. An alternate take is that only part of the explanation applies — these are the times of year when many visitors are limited to weekends by school schedules.
On the other end, June and July will see smaller relative increases as their popularity continues to be low.
Big checkmark here. Across all of June & July, only 4 dates increased in price.
Within the “Value”, “Regular”, and “Peak” tiers prices will continue to increase at about $3-5 per year.
Oops. We could argue about whether not the $6 increase in Regular is close enough to squeak in, but the $9 increase in Peak is definitely not. Since this was a multi-year prediction, I reserve the right to revisit the verdict here in the future.
In the Value group, Disney will hold firm on that $109 price point for optics as long as they can, and will try to retain the same number of days at that price (it’s been 22 days for the last three years).
Well, there’s 4 different price points in that Value tier now, but the bottom is still $109 and the number of days at that rock bottom is holding steady at 22. So far, so good on this one.
In 3-4 years, Disney will be forced to raise the price of the Holiday tier or the Peak tier’s routine increases will overtake it. When they do, they will make a big jump — at least $20 or $30.
It’s too early to call, but I’m thinking it might be 2-3 years instead of 3-4. Those tiers are only $9 apart right now.
What to Take Away
- Across the board price increases are still going strong. “Silent” increases when tickets are released still offer an opportunity for ticket cost to increase faster than you might realize based on news outlets reporting on sweeping changes like we saw last week.
- The last three months of the year continue to increase faster than other periods.
- Thanksgiving appears to have officially overtaken Easter as the next most crazy crowds after Christmas, with the entirety of Thanksgiving week now moved into the Holiday price tier.
- Other than Easter, weekends make up almost the entirety of the Peak price tier, especially Saturdays. Only in the doldrums of summer (June through September) can you find entire weekends in the Regular price tier.
Were you surprised to see last week’s increase? Did you expect to see Thanksgiving make the big move to Holiday tier pricing? Dataviz people, can you spot the adjustment that needed to be made when checking out these prices on a heatmap? Let us know in the comments!

You May Also Like...
-

Fans of a little extra Disney magic will be thrilled to hear that select Walt Disney World behind-the-scenes tours will be…
-

Perhaps there's a glitch in the space time continuum, but there's some bargain pricing happening right now at the Confectionery on…
-

Feb 1 2023 note: - if you got here from a Crowd Tracker update email sent today, you're looking for the…
-

As we work our way to the summer months, the Walt Disney World Resort is gearing up to reopen more…
I am really surprised that there are still park reservations available for all parks at Easter and on 4th July. Either Disney has increased the number of people allowed in the parks by these dates or people are just not thinking far enough ahead! I got my WDW tickets for last week and this week months and months ago and immediately sat down and went through the TouringPlans crowd calendar to find out which parks were quieter on which days and made my reservations. We are back here in May (all our holidays postponed from when we weren’t allowed to fly here we rebooked really close together for some reason) and I have all my park reservations booked. Of course if our plans change we can always cancel any reservation for free – and swap and change if the parks aren’t all booked up before we decide to change parks. We’ve heard about people being here last week who had dining reservations in one of the parks but no park reservation. The park had no further reservations – so they couldn’t get to their restaurant! It seems such a shame – so PLEASE BOOK YOUR PARK RESERVATIONS AS SOON AS TOU GET YOUR TICKETS TO AVOID POSSIBLE DISAPPOINTMENT.
Might have put this in the wrong blog?
Possibly. 😉 But I agree that reservations still available for Easter are a reflection of increased capacity. July 4th might just be people not planning ahead.
I think part of the issue is that this time last year, everyone knew the parks were low capacity and reservations in short supply. And as you say, if they’re not booked up it’s easy to change at the last minute. What’s problematic is when capacity is increased and they’re still sold out at what’s perceived as non-peak times; the people you heard about last week probably thought there wouldn’t be an issue getting reservations — and to be honest, outside of spring breaks, Easter, Thanksgiving, and Xmas I would probably think the same thing right now, even if it didn’t turn out to be true.