New Heat Maps Show Disney World Crowds Hour-by-Hour
We’ve added hour-by-hour heat maps to our Disney World crowd calendars for mobile and tablet devices. It’s a useful feature if you park-hop during your trip and want to see what the crowds will be like when you arrive. It’s also useful if you want to see how fast crowds are going to increase during your day.
Here’s what a typical heat map looks like:
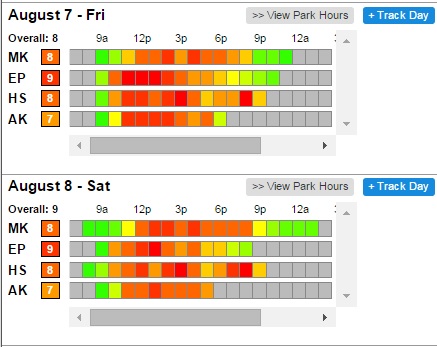
The number immediately to the right of the park is its overall crowd level for the day. Each block in the heat map represents one hour of the park’s schedule. Grey blocks indicate the park isn’t open; green blocks are hours with low crowds, and red blocks are high crowds.
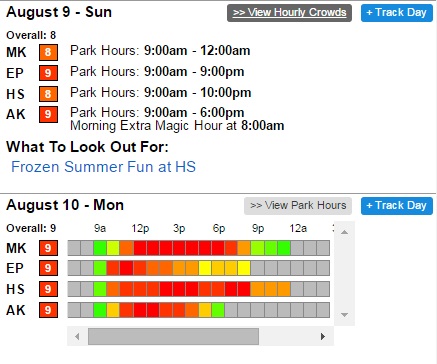
Tap the “View Park Hours” button to see the park hours, Extra Magic Hours schedule, and special events:
Desktop Users If you’d like to see the heat map on your desktop screen, shrink your browser window so that it’s 900 pixels wide or less. You should see the standard Crowd Calendar presentation switch to heat maps, although we recommend you refresh your browser window at this new size to get the best experience.
Track Days TouringPlans subscribers can get automatic email notifications of park hour and crowd calendar changes for every day of their trip. Simply tap the “Track Day” button next to each day you want tracked.
You May Also Like...
-

Now that we're all back into the holiday-free zone for a while, we're taking a quick look at how the new…
-

The Disney Skyliner has been a frequent conversation starter ever since it was announced back at the last D23 Expo. Love…
-

Not since the monorail has there been a transportation system that has captured the hearts of guests like the Disney Skyliner.…
-

Average Errors by Park The Disney World Crowd Calendar is having a good year. Not perfect, but good. In 2017 our…
ha! silly me, I first thought that this would be telling you how hot the weather was at any given hour of a park day. tee hee!
Yes got it on the browser not the app. Thank you!
I was able to get it to work finally on both iPad and Android phone. Had to logout and close my Chrome browser and then log back in and it worked fine.
I found it through the browser on my iphone. Very cool! So, would it be correct that it is not on the app – just on the website?
Ahhh, it’s not (yet) in the Lines app – it’s on the mobile version of the site. Try it in your browser, please, and let me know if it works.
I have tried to find the view park hours button on both an iPad and Android phone and cannot find it on either. On the iPad I can see and activate the “Track this day” but that is not available on my android phone. Any suggestions?
I am in the TP app on iphone. I am on the firsts creen when you enter the app. The grey bar says Today at WDW on left side. On right side it gives the time and the date. That is all. Undeneath it asks us to Help us out by giving a review! I’ve never answered this question, btw. Could that be the issue?
The “View park hours” button should be to the right of the date.
If the “View park hours” button is not visible, is the “Track Day” button visible?
No I do not see either of those options. I am on the iPhone touring plans app and I am a registered user. Should I not be in the app?
I’m sorry I cannot figure it out on my iPhone either. What am I doing wrong?
I’m on my iphone and I don’t see a “view park hours” button
Been looking for the heatmaps can’t seem to find them…any direct link to them?
On ios, you have to view as portrait! If you tip your device to landscape, it appears the old way. Weird!
Curious how the heat maps are produced. Will all days with the same crowd level and the same operating hours always have the same heat map, or is there more to it, such as seasonal and day-of-the-week variations, dependence on other parks’ hours, presence of special events, . . etc.?
If the maps are produced by algorithm, are there adjustments made for “unusual” days, such as Epcot on marathon Sunday, where rare effects such as traffic access come into play?
The charts are produced by algorithms. We are using the attractions’ wait time modes like what we do for the crowd levels. Instead of looking at an entire day, we are looking at a single hour. The “unusual” days will appear different. Days with similar attributes will like have similar heat maps.
I’m wanting to have a short-term version of these heat maps that can take hour weather forecasts into account. If we know that tomorrow is going to be a rain out from 8am to noon, all the parks will have low crowds in the morning, and many guests will skip Animal Kingdom altogether. (ah the things us Statisticians dream about at Touringplans.)
Terrific – love these heat maps!