Walt Disney World Crowd Report – March 9 to 15, 2014
Last week our predictions performed very well, hitting the mark more than missing it. Several days last week we saw our park level prediction hit the mark in three of the four parks. No prediction missed by more than two index points. This is encouraging especially because we felt a little nervous about our predictions last week given the higher than normal percentage of schools out of session for Spring Break. If you visited the parks this week while your child was out of school consider yourself lucky, we’ve seen busier weeks than this during the same week in the past.
Let’s look at how the crowd levels stacked up day-to-day last week.
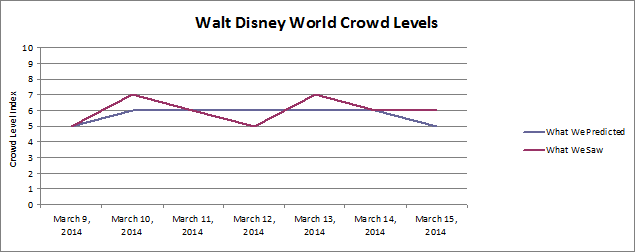
| March 9, 2014 to March 15, 2014 |
|---|
Our predictions on Sunday hit the mark resort-wide (5) at Magic Kingdom (6) and Epcot (5). We only missed by one at The Studios (‘3’, predicted ‘4’) and Animal Kingdom (‘5’, predicted 4). Our accuracy at Magic Kingdom was impressive given that the 1:00 am closing and 3:00 am Extra Magic Hour closing would normally draw a crowd level at least as high as an ‘8’.
We correctly predicted Magic Kingdom’s crowds again on Monday (7) although resort-wide we predicted a level ‘6’ and it was a level ‘7’. Epcot, The Studios and Animal Kingdom all saw crowds larger than expected although no park exceeded our prediction by more than 2 index levels. Epcot was a ‘7’ (we predicted ‘5’), The Studios a ‘6’ (we predicted ‘5’) and Animal Kingdom was a ‘6’ (we predicted ‘4’).
Predictions were bang-on more often than not on Tuesday as well. Our resort-wide prediction (6), Magic Kingdom (7), Epcot (6) and The Studios (5) all hit the mark. Animal Kingdom was the only exception with a ‘7’, two levels higher than our prediction. Animal Kingdom has been steadily more crowded than expected the last few weeks so we are currently taking a closer look to see if we can determine why.
Epcot and The Studios stayed moderate on Wednesday as predicted with level ‘5’s at both parks. In fact, ‘5’ was the number across the board at all parks as well as resort-wide. At Magic Kingdom most attractions had moderate average posted times except for The Many Adventures of Winnie the Pooh which proved less popular than normal at a 22-minute average.
We correctly predicted that Magic Kingdom would increase to an ‘8’ on Thursday. Elsewhere we were fairly accurate as well with each of our park estimates accurate within 2 index points. Epcot was a ‘7’ (we predicted ‘5’), The Studios a ‘5’, (we predicted ‘6’) and Animal Kingdom was an ‘8’ (we predicted ‘7’).
Our predictions were spot on again on Friday for the resort-wide number (6), Magic Kingdom (7), Epcot (6) and Animal Kingdom (7). On Friday, The Studios was the exception where crowds underwhelmed at a level ‘4’ on our scale despite our prediction of ‘6’.
On Saturday Magic Kingdom was a ‘6’ (we predicted ‘7’), Epcot was a ‘5’ (we predicted ‘4’), The Studios was a ‘5’ (we predicted ‘6’) and Animal Kingdom was a ‘6’ (we predicted ‘5’). With a resort-wide level of ‘6’ (we predicted ‘5’) that means that all our predictions missed by exactly one index level.
| March 16 to 22, 2014 |
|---|
The start of spring break is upon us and crowds around Walt Disney World will increase accordingly. We still like March as a time of year to visit however. The weather is nice and although crowds are larger than January and February they are easily manageable with a good touring plan. Other than at Downtown Disney’s Raglan Road, St. Patrick’s Day has little effect on the resort.
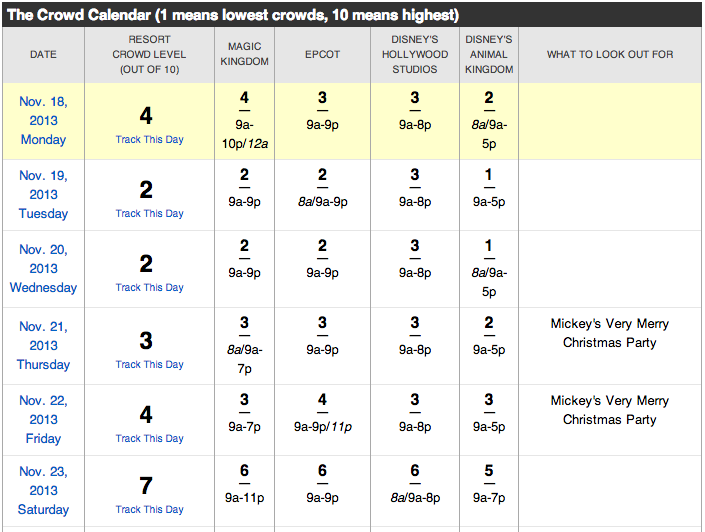
To see Walt Disney World Crowd predictions for the days of your vacation, check the Crowd Calendar.![]()
To get details about our predictions of future crowds or details about crowds in the past check out the Crowd Calendar and select “Jump to Date” on the left margin.
You May Also Like...
-

This weekend will have the longest park hours since Walt Disney World re-opened in July. Extended park hours are a signal…
-

Disney has shared another update regarding operational changes to Walt Disney World due to Coronavirus. 5 p.m. on Friday March 20,…
-
We have been holding off on doing any big Crowd Calendar updates until we saw how the crowds were in 2021.…
-

The February 2020 Crowd Calendar update is now live. So far 2020 is showing increased crowds at Walt Disney World. We…
This seems like a case of Disney actually giving people what I have suggested in many blog comments. My past comments regarding fastpass+, the removal of GAC for DAS, and the general control over things Disney wants to exert indicates that they are much more interested in giving the illusion of allowing sanctioned line cutting (FP+) for the priveleged (i.e. the resort guest or passholder or advance ticket purchaser).
They spent a lot of $$ just to “re-wire” admittance to the “special line”.
I don’t know if the actual guest count (attendance) was up or down in relation to other “5” or “6” crowd “levels”.
I’d love to know this stat: The ratio of actual attendance to crowd level throughout the year.
My hypothesis: It’s possible for Disney to reduce to “crowd level” even though there are more people in the parks. But they often CHOOSE NOT TO.
If there is a variance across time, and the same crowd level is acheived even with more guest admittances, then I think that hypothesis would be shown to be correct.
I get a lot of backlash when I theorize that Disney should have use the money to increase capacity because people think it’s not possible to increase capacity. But eventually people get worn out, and they eat, and they sleep in, etc…
I am excited to try out what is a relatively new thing for me: Going during an actual school break.
I’m excited about the extended hours at MK and AK which I’m not used to, and I’m excited that Disney might actually be focused on running the park instead of being focused on maintaining the park for the “other more peak” times.
We’ll see if it turns out well or if the crowds are too high.
Thanks for nitty gritty updates here on the blog.
If I were teaching math again I would be using this column every day in my classes. Fred’s work, and the staff who also contribute, makes this a fascinating read on so many levels.
Thank you!
This would be graduate level statistics and modeling.
I’m going to look at Disney’s Imagineering posts right now for analysts, statisticians, etc…
They spent big $$ to get a HUGE repository of data (tracking data) on people that is much more granular. They’ll need people crunching and digging into the data if they want to actually recoup the investment in better profitability from future decisions.
A quick indeed search actually yielded 50 positions all involving skills in things like excel, SAS, SQL etc..
Here’s an example: 168265BR-1 Sr. Advanced Analytics Analyst in Celebration, FL: Needs a masters degree in quantitative field. (I’d bet that’s not a deal breaker, but basically needs to be “smart”).
Here’s a quote from the job posting:
Within WDPRO, the Advanced Analytics team is focused on leveraging “big data” to drive economic value and increase Guest satisfaction throughout the segment.
Yes, Disney is spending a lot of money so that many Edward Snowden type analysts can track your every move while on property.
Disney’s motivation: More profit by serving the customer at a granular and personalized level.
Side effects: Unknown.
You mentioned about looking into Animal Kingdom being more crowded than expected. I’m wondering if it’s not necessarily more crowded, but with the loss of Festival of the Lion King in a park that doesn’t have the most attractions, it is causing the wait times at other attractions to go up much more than would be seen at other parks. Lion King seats about 1,400 people for 6 or 7 shows a day for a half hour. I love this show and see it at least once a trip and it always seems 90-95% full so this attraction while never really having a wait, gobble up close to 9,000 visitors a day for 30 minutes. Also, probably to a lesser extent, the parade not showing any more has also probably caused wait times to go up. It will be interesting to see if wait times go down some when Festival of the Lion King re-opens in the summer.
I’d agree. Any decrease in things to do (decrease in supply) will increase the price (the wait times) across the board.
An increase in the demand for things to do (the attendance) will also increase the price (the wait times) across the board. Increased hours at AK may be enticing more people to choose this park.
In order to decrease the attendance (demand for things to do) Disney would need to raise gate prices, but the “curve” relationship of Attendance to price is steep, and people just seem to keep on coming no matter the price increase.
It’s more likely to me that Disney has probably gotten WAY TOO forgiving of the animals on Kilimanjaro Safari. I was on that ride for triple the normal ride time and it was a huge traffic jam because basically they don’t want to “make” the animals get out of the trucks way.
This unexpected slow down of Kilimanjaro could also affect wait times dramatically.