What’s Up with Wait Times at Epcot?
Minor update on 11/4: An Epcot CM has offered wait time data for a couple of attractions we didn’t have. See [2].
This is the second of four blog posts about wait times at Walt Disney World. We covered Disney’s Hollywood Studios yesterday, and there’s a lot of background material that I won’t copy into today’s post.
Epcot’s average posted wait time seems to be up from around 23.2 minutes in 2014, to 25.0 minutes in 2015 – an increase of just under 8%. We think this is due to 3 things:
- The closure of Maelstrom at Norway
- Better handling of FastPass+ return lines in the park
- Growth in attendance
Maelstrom’s Closure
We think that the people who used to get in line at Maelstrom now get in line at other Epcot attractions. By itself, Maelstrom’s closure explains 60% of Epcot’s slightly longer lines.
Here’s the average wait and number of people in line at these Epcot attraction still open in 2015:
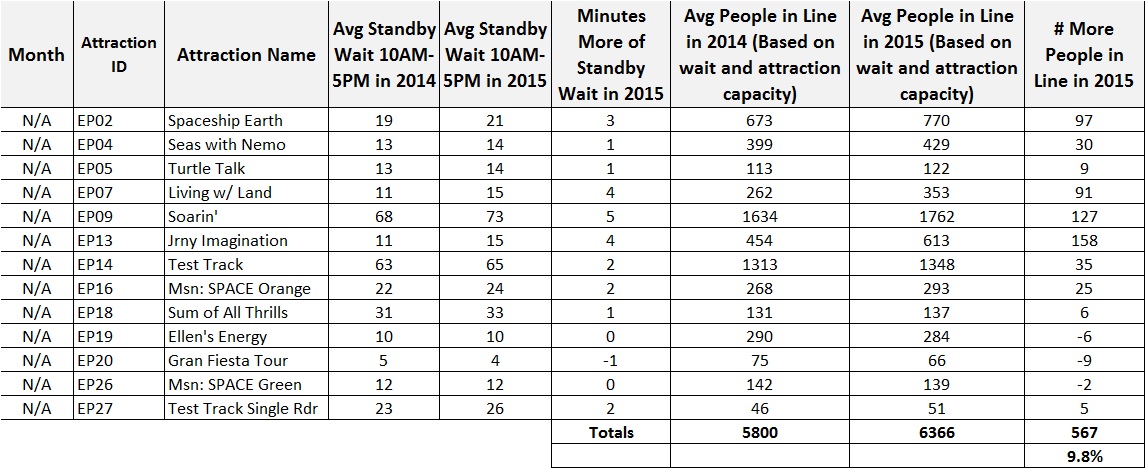
On average, there are around 567 more people in line at Epcot between 10 AM and 5 PM in 2015 – an increase of 9.8%.
Here’s how many people were typically in line at Maelstrom before it closed on October 5, 2014:
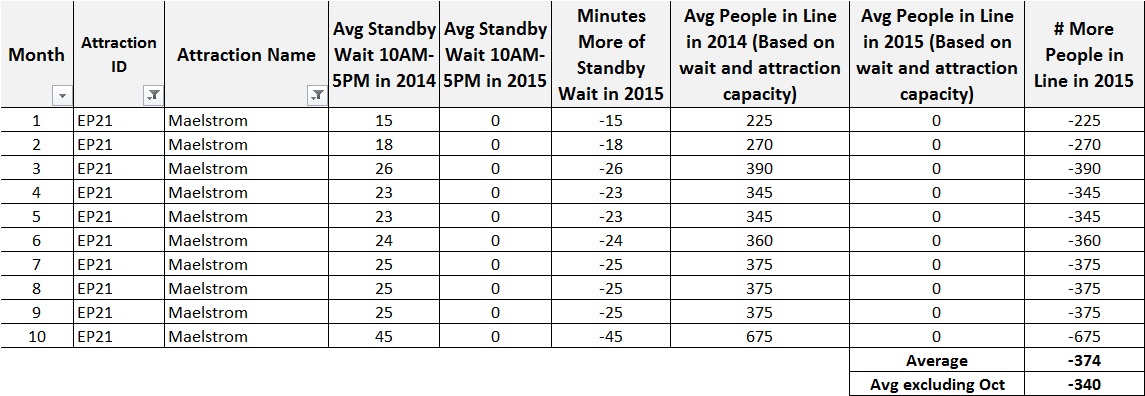
We’re not going to count the 5 days in October when Maelstrom was open and fans were getting in their last rides. That was a special event.
Up until it closed, there were an average of 340 people in line at Maelstrom. Those 340 people represent 60% of the increase in Epcot’s lines in 2015 (340 of 567).
Innoventions West also closed, in late April 2015. The Captain EO theater was also closed for a few weeks in 2015 to switch over to show upcoming Disney movie previews. Neither was popular. In fact, we can’t see any definitive impact in other attractions’ wait times with these closures. Those attractions had people in them, but the numbers are too small to stand out.
Better Handling of FastPass+ and Attendance Growth
Based on the above information, there’s seems to be an 8% increase in standby waits at Epcot in 2015. Maelstrom accounts for 60% of that, or roughly 5%. What about the other 3 to 4%?
Epcot didn’t add any major new rides or shows in 2014, and its attendance grew 2% from 2013. It hasn’t added anything major 2015 either, so an attendance increase of around 2% for 2015 seems like a reasonable assumption. It’s possible that Epcot’s attendance growth is slightly higher than that, too, if multi-day visitors are choosing to skip Disney’s Hollywood Studios.
And as we discussed in yesterday’s post on Hollywood Studios, we think that Disney has resolved many of the technical issues around using FastPass+ in the parks, which would increase standby wait times versus 2014. Our best guess is that accounts for the remaining increase in standby waits. We’ll talk about this in detail when we get to the Magic Kingdom.
Finally, the wait Disney measures wait times in 5-minute increments may also play a small part in year-over-year wait time increases [1].
The Epcot Crowd Calendar
Our crowd calendar predictions for Epcot have done reasonably well for 2015, within +/- 1 point on average. There’s always room for improvement, but it looks like the models did reasonably well in picking up the effect of Maelstrom’s closure. Still, we’ll have updates to Epcot (and the rest of Walt Disney World) shortly. We’re also paying special attention to the closure of Soarin’ in early 2016.
Epcot Attraction Wait Times and FastPass+ Availability
As we did for the Studios, here’s a look at Epcot’s attraction wait times and FastPass+ availability for 2014 and 2015. We’re not able to see a pattern
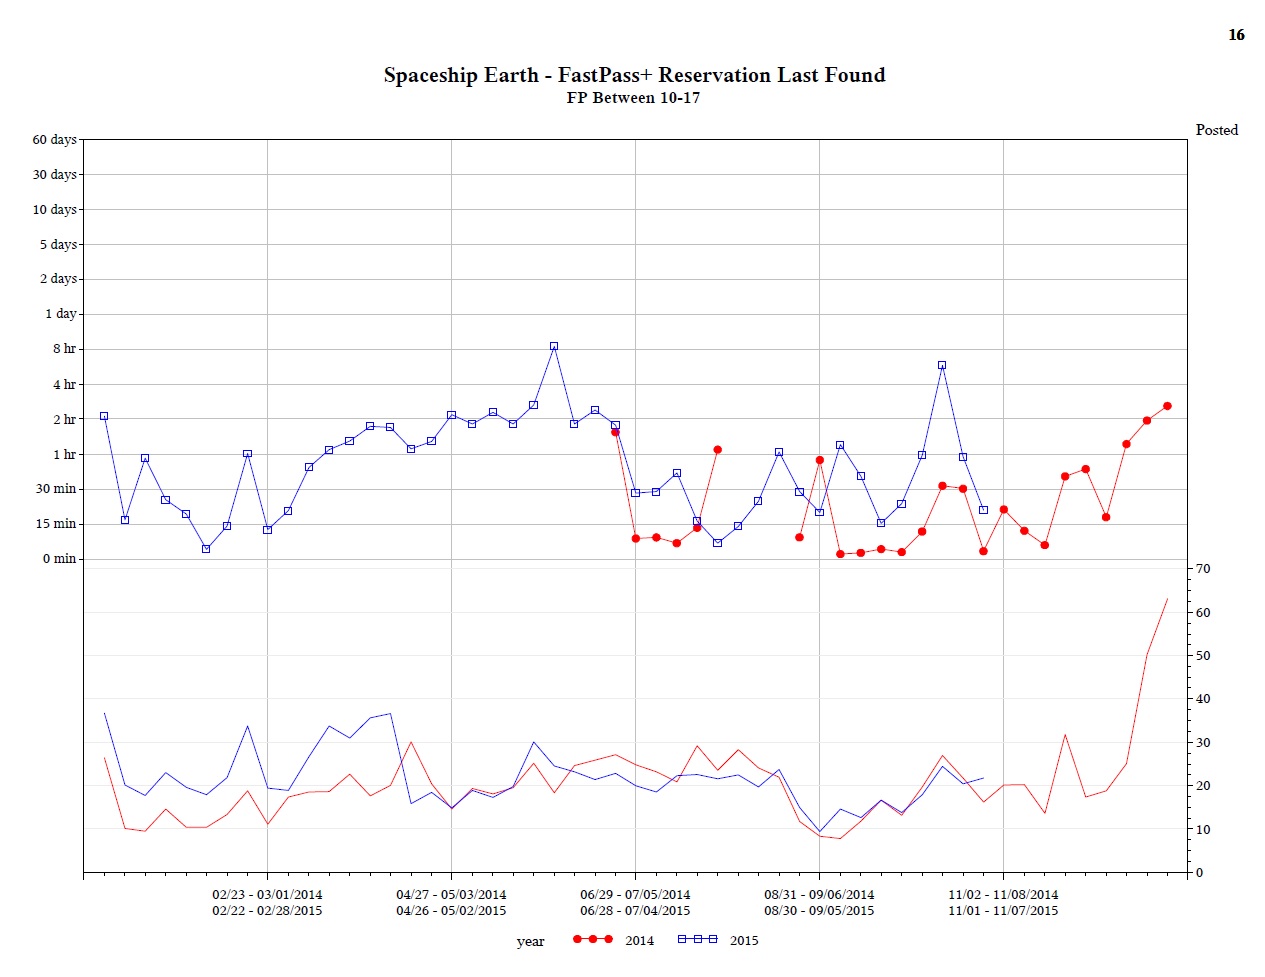
Here’s Spaceship Earth. FastPasses were more available in early 2014, yet wait times were higher. And it was harder to get FastPasses in September and October 2015, but wait times were the same or lower.
Here’s The Seas with Nemo and Friends:
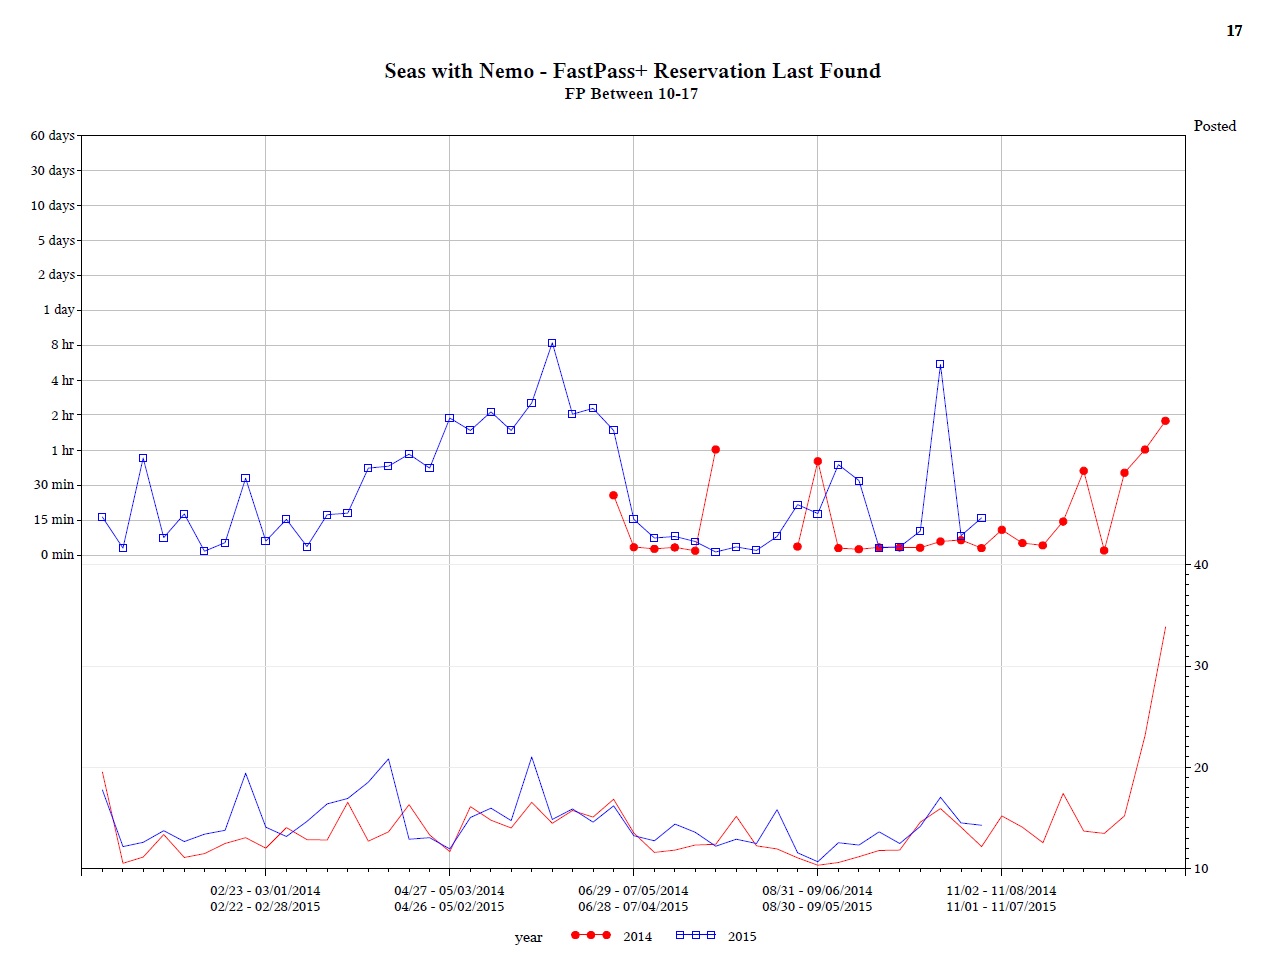
Average wait times are between 10 and 20 minutes almost every week, so there’s not much variation here. A couple of 2015’s FastPass and standby wait peaks line up, which is interesting. But much harder to get FastPasses in late July 2014, late August 2014, and early October 2015 don’t seem to have corresponding spikes in standby waits.
Here’s Turtle Talk with Crush:

Like The Seas with Nemo, Turtle Talk’s average wait times don’t vary much: between 8 minutes and 22 minutes over the past two years. And while there’s a sharp drop in FastPass availability in early October 2015 – from almost instant availability to selling out more than 4 hours in advance – wait times only increased by 2 minutes. Also, FastPasses got easier to get for the first few weeks of September, 2015, while standby waits went up. It’s hard to see a consistent pattern in those two things.
Here’s Living with the Land:
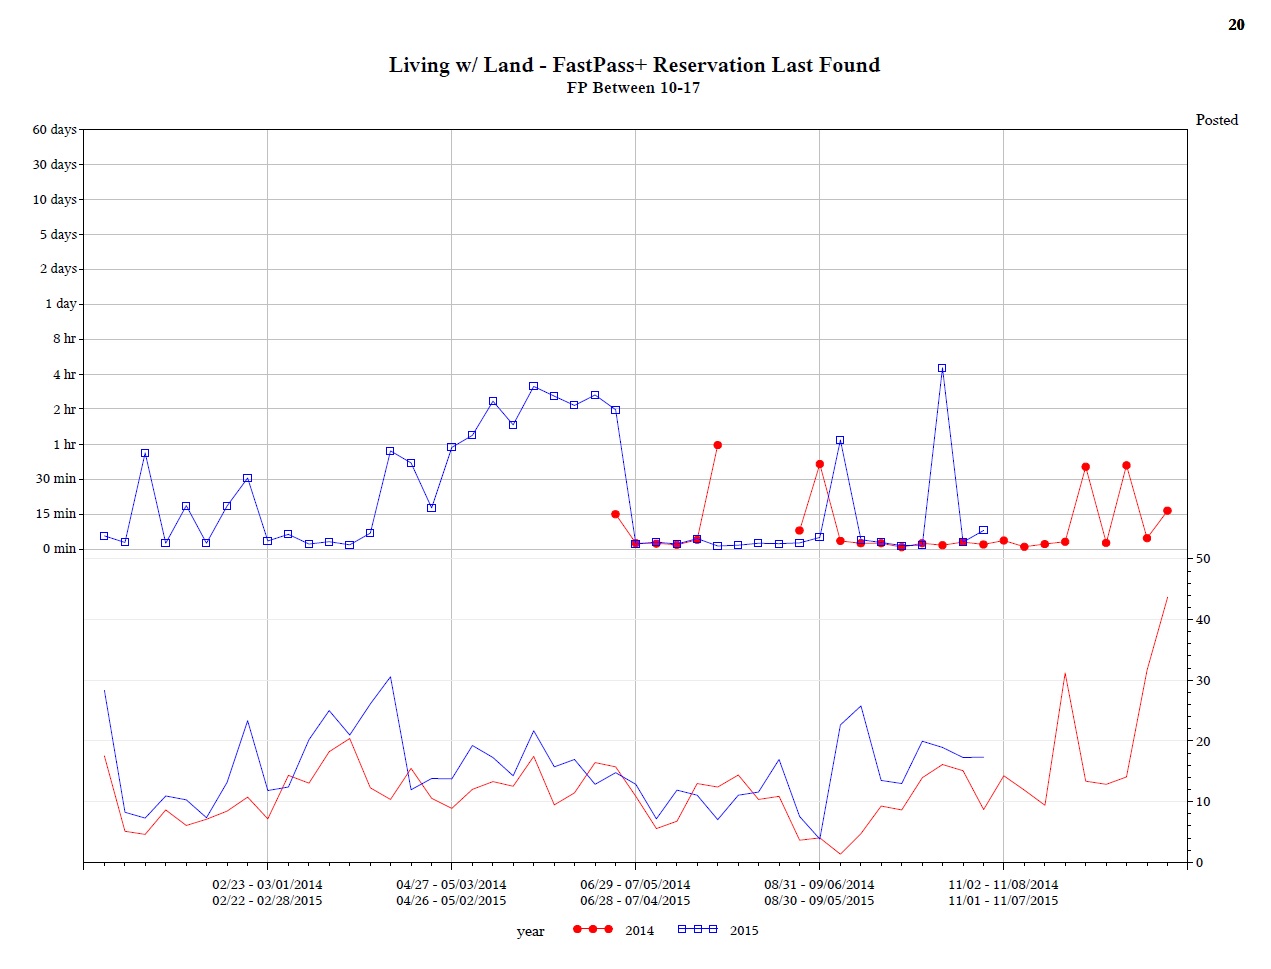
Again, there are lots of weeks where you could get an “instant” FastPass at LWTL. (It’s an underrated ride – everyone should go on it.) There’s a big drop in FastPass availability around the last week of September 2015 to the first week of October. But standby wait times were down slightly.
In June 2014, Living with the Land switched from a Tier 2 FastPass+ attraction to Tier 1. That doesn’t seem to have affected its standby wait. Prior to the switch, LWTL was averaging a standby wait of 11.6 minutes; it was 10.6 minutes after the switch for the rest of 2014.
Here’s Soarin’:

Since early May, standby waits at Soarin’ haven’t been lower in 2015 than at any point in 2014. Yet FastPasses in 2014 ran out as fast or faster for around 8 weeks. And while there’s a sharp drop in FastPass availability and sharp increase in standby waits in mid-July 2015, there’s no corresponding spike when the same thing happened in 2014.
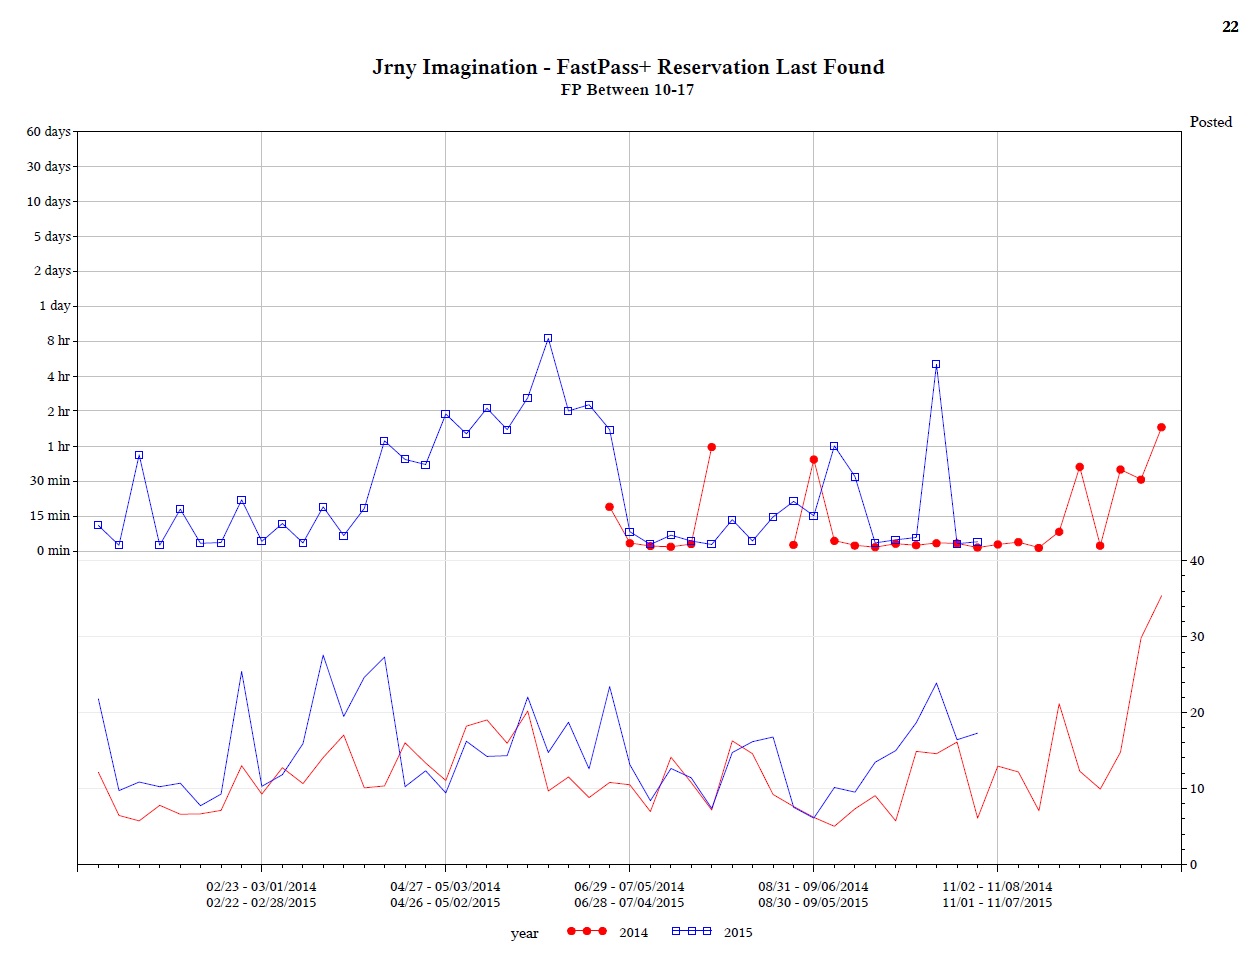
Here’s Journey Into Imagination:
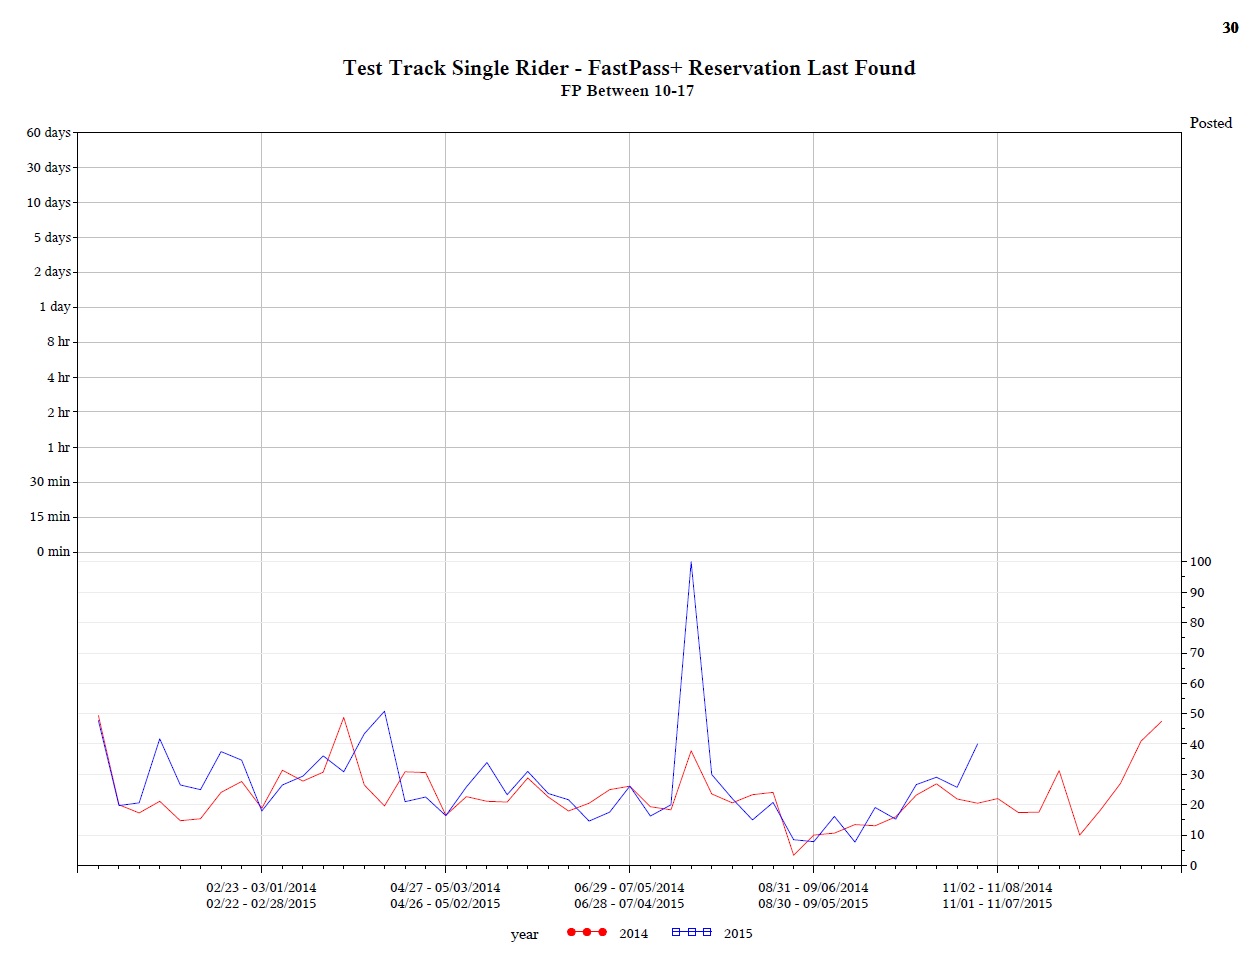
And Test Track:
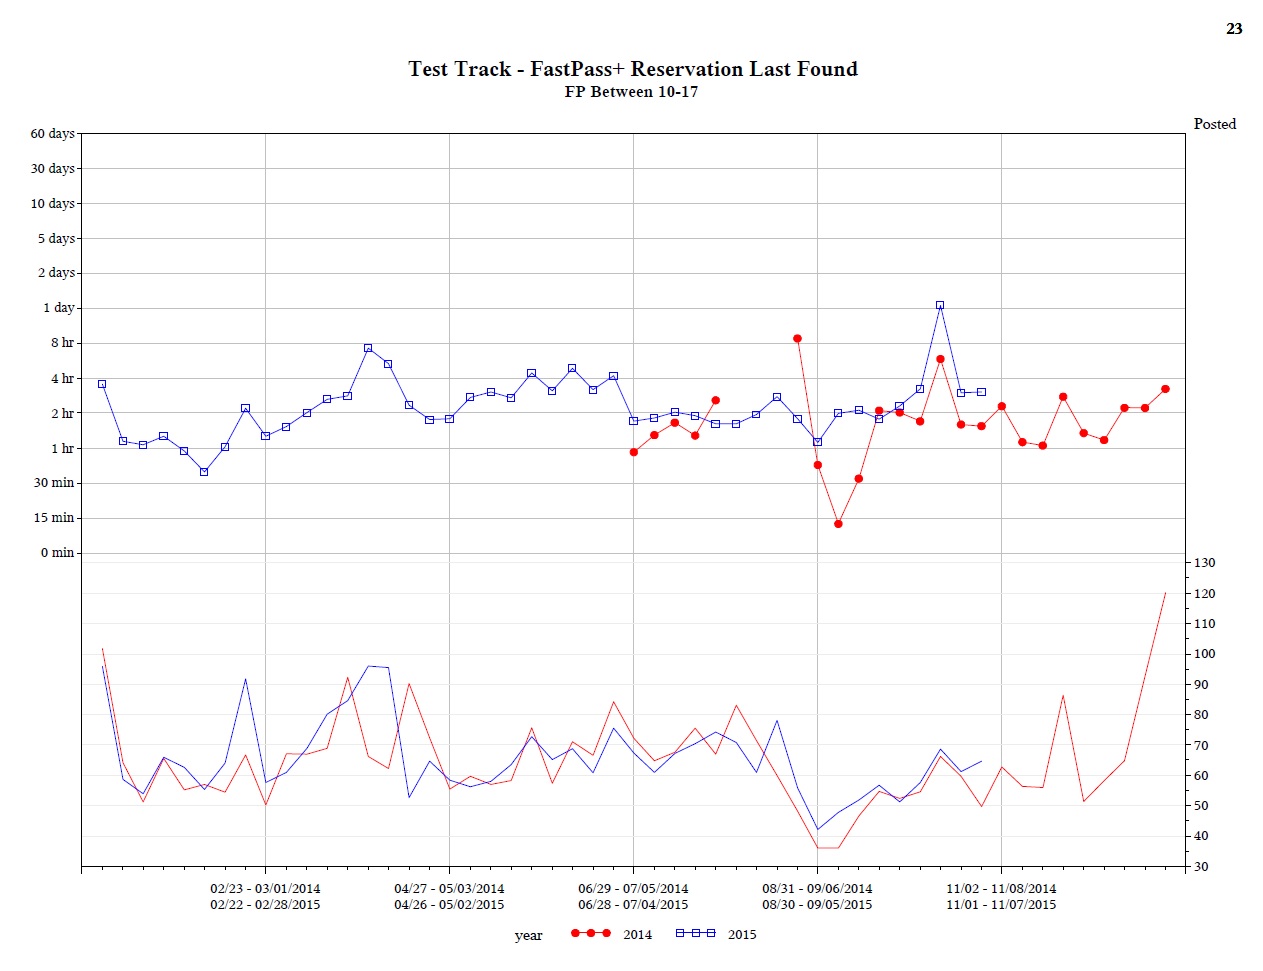
Without looking at the actual numbers, the blue lines here look like they follow the same pattern. So that’s interesting. But there’s a lot that’s hard to explain, like why wait times were 50 minutes when FastPasses ran out more than 8 hours in advance in late August 2014, but wait times were around 80 minutes when Fastpasses were available longer in late June 2014 and early July 2014,
Here’s Test Track’s Single Rider line, which doesn’t have FastPass+. That huge increase in waits in 2015 is almost certainly either a technical problem with the ride, or bad posted wait times.
Here’s Mission: Space Orange:

Other than early July 2015, there doesn’t seem to be a match between the spikes in FastPass+ demand and wait times.
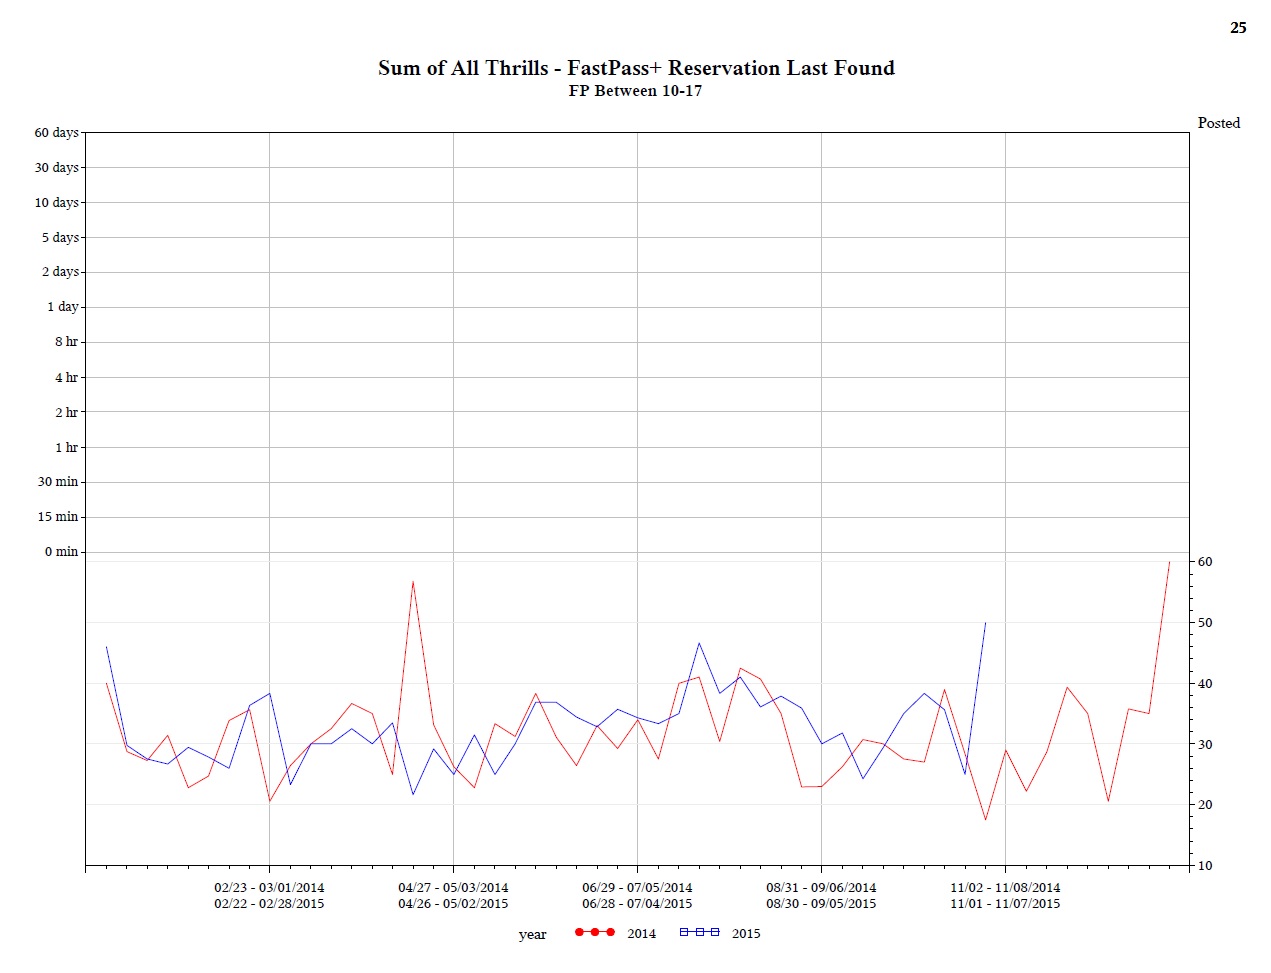
Here’s Sum of All Thrills. It doesn’t have FastPass+, but we still collect wait times:
Here’s the Gran Fiesta Tour in Mexico, which also doesn’t have FastPass+:
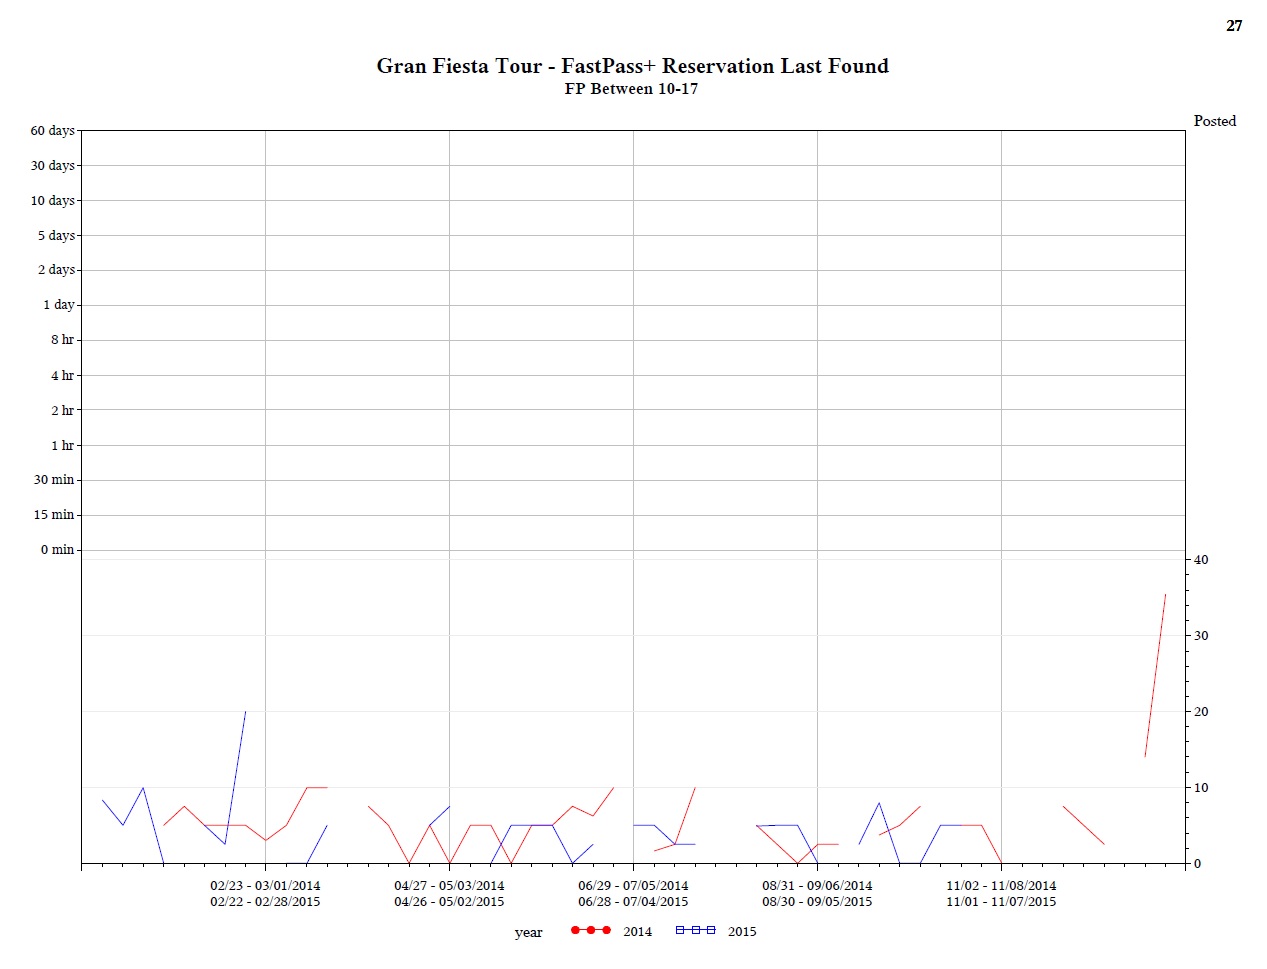
The good news is that wait times are low here for most of the year, rarely exceeding 10 minutes most weeks.
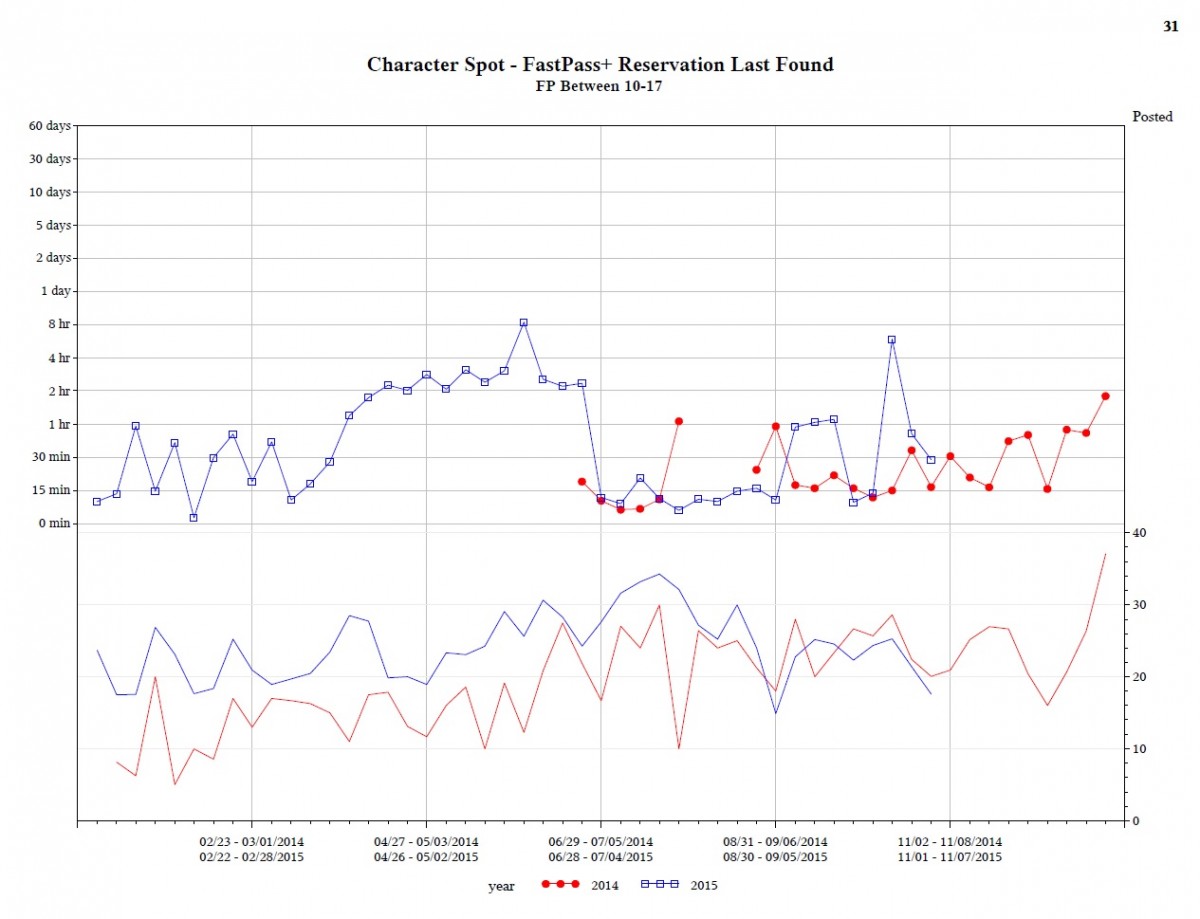
Finally, here’s the Epcot Character Spot:
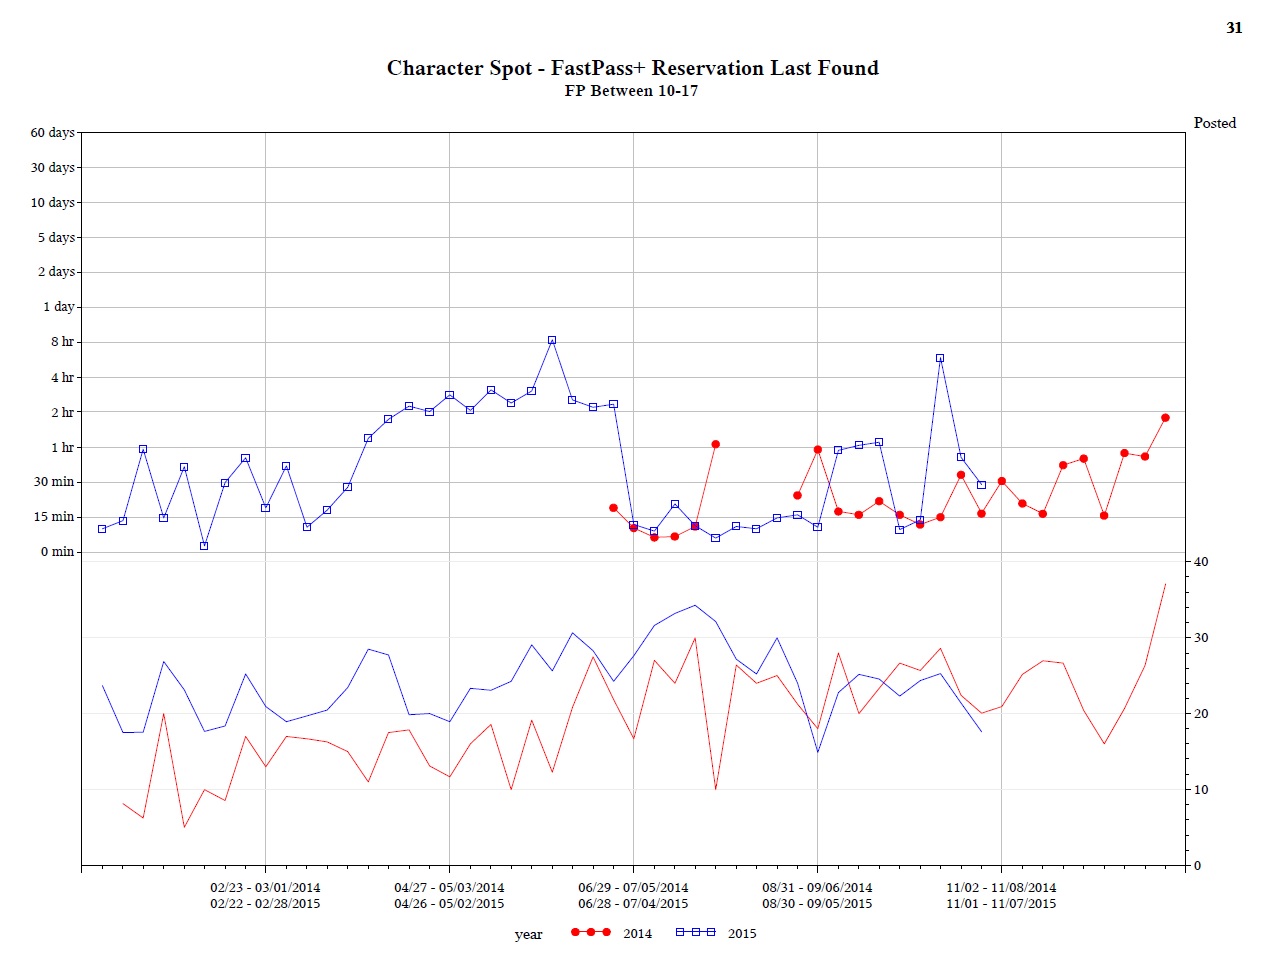
This one’s strange. In July 2015 you could get a FastPass within 15 minutes of “now”, so FastPass demand was low. Yet standby waits were the highest seen over two years, except for Christmas. When FastPasses were harder to get in September 2015, standby waits were lower. And the spike in FastPass+ demand in October 2015 had lower waits too.
I’ll cover the Animal Kingdom tomorrow before heading out of town for the weekend. We’ll finish up with the Magic Kingdom early next week.
Footnotes
[1] It’s also possible that the way Disney displays wait times has a small effect. Disney generally displays wait times in increments of 5 minutes (e.g., 5, 10, 15, 20, etc.). So a 7-minute wait gets rounded down to 5, while a 7.5-minute wait gets rounded up to 10. That’s a 100% increase in posted wait times but a 7% increase in actual waits.
This effect is more pronounced when wait times are low, and when there are relatively few attractions with posted wait times. Epcot’s average posted wait is 25 minutes, and we count 5 attractions in our Epcot Crowd Calendar.
[2] A kind Epcot CM has offered us some hand-counts of guests at Innoventions West’s Where’s the Fire?, The Great Piggybank Adventure, and IBM’s Think exhibits, which closed in early 2015, plus the first version of the Anna & Elsa meet-and-greet at Norway, before it moved to the Magic Kingdom’s Princess Fairytale Hall in early 2014. We’re told these guest counts were collected manually, and not on a regular basis. We’ll update the charts if there’s anything we can use.
You May Also Like...
-

This past weekend we saw the highest attendance at Walt Disney World since its reopening. Back to school was a major…
-

Back in June, which is Pride Month, we showed you the Rainbow Disney Collection on shopDisney as well as multiple ways…
-

With topiaries "springing" up everywhere in preparation for the EPCOT Flower and Garden festival, and with temperatures being fairly mild in…
-

TouringPlans is all about understanding what's actually going on with lines for rides. But most guests base their decisions only on…
Didn’t people ride Maelstrom as part of their tour of world showcase? If Maelstrom is closed, I gather most of those people would just continue through world showcase rather than clog up the lines at the popular future world attractions.
We’ve considered the possibility, Lawgman.
We also considered the possibility that by advertising it as a FastPass attraction, Maelstrom pulled people into World Showcase who would have otherwise stayed in Future World longer.
If you had an 11 AM or 12 PM FastPass for Maelstrom, for example, it’s unlikely you completed a full tour of Future World beforehand. But without that FastPass, what’s the rush in getting to World Showcase? Better to stay in Future World and not have to backtrack later, right?
Unfortunately, Gran Fiesta isn’t popular enough of an attraction for us to see whether waits were different with and without Maelstrom. That would have been useful.
Loving these posts as a Disney nerd. I need to make our touring plans for our NYE trip. Are the custom touring plan formulas updated to reflect your new data yet? I’d rather only do them once and I’m the family planner. With a party of 8, time is important to adjust any fastpasses.
Thanks Melissa! We’re working on the data for the customized touring plans and should have them done within a few days.
Could the increase in wait times be attributed to guests scheduling fast passes but choosing to enter a line for a different ride? Anyway to track abandoned fast passes?
Sorry answered my own question, a smaller fast pass line would lead to a quicker stand by line. But bringing up the age old discussion of “feel” verses wait. Are more people who are already in the park now choosing to ride instead of shop and walk around and sight see?
I understand that the Crowd Calendar is based on wait times, but unfortunately, at least for Epcot during Food & Wine and Flower/Garden (and perhaps DHS during Star Wars Weekends), the Crowd Calendar isn’t doing a very good job of predicting actual crowds.
Case in point: first and second Saturdays of Food & Wine this year were predicted 6 and 3, respectively. You said you “saw” crowds of 6 and 6, respectively. However, the park was slammed both days, due to Food & Wine. Epcot was way more crowded than either of those numbers would imply.
The problem here is that the term “Crowd Calendar” implies that you are predicting actual crowds, when in actuality, you are only predicting ride wait times, which is a very different thing, especially during special events like Food & Wine. In our experience, the Crowd Calendar is next to useless during special events.
This did not seem to be the case previously, as our two trips in 2013 (one of which included Food & Wine) seemed to track pretty well with the crowd calendar (except for our first night in MK during the 2013 Food & Wine trip, where the Calendar missed pretty bad — predicted 8, said you saw a 7, but it was far more crowded than a 7).
I’m not sure what the answer is, but it’s clear to us based on empirical data that the Crowd Calendar just isn’t working anymore, especially during special events.
So, if I read this right, Maelstrom represented about 6% of the line capacity in Epcot before it closed. Closing it caused wait times to rise 8%. Currently, Soarin is about 27% of the line capacity. When it closes in January (in which Maelstrom will still be closed), what sort of line Armageddon can we expect throughout Epcot? 35% increase in lines?
Yeah, that’s a lot of capacity. Fred’s still running the calendar updates, but I expect to see jumps in the numbers.
At least some of Epcot’s evening numbers will be reduced once Rivers of Light comes on line at AK in April. But for those first few months of 2016, it looks like longer lines.
Sounds like you’ll need to update the guide to recommend a FP for Ellen’s Energy Adventure (and everything else).
Certainly it looks like there will be a major impact. On the other hand, one would think that the closure of Soarin’ will cause some guests to spend less time at Epcot, reducing the overall attendance and the overall “rate” of the impact. The Maelstrom closure wouldn’t have caused a reduction in attendance.
Did you notice if there a significant difference when Disney introduced more than three Fastpass entitlements?
Haven’t checked, Stephanie, but we will. Good idea. Thanks!
Great job, Len and the whole team!
When work on Norway is complete, they will have both a replacement for Maelstrom AND a new character meet, so that may make things better (except for those who must see Anna and Elsa).
You are giving changes in average wait times from 2014 to 2015. Do you have similar numbers for 2012 and 2013 so we can see how wait times have changed since before FP+ was introduced and during the first transitions in 2013?
I am familiar with the blog post from last summer in which you concluded that FP+ caused average wait times to go up slightly at some attractions and down slightly at others. Is that still your conclusion?
We do. Let us get through this, Jack, and catch up on some other work, then we’ll revisit that. Great idea.
Saving the difficult Magic Kingdom for last?
It’s really the only park that is a mystery to me. Epcot hasn’t seen huge increases in lines. At DHS, the closures are a pretty good explanation.
But Magic Kingdom — huge increases without significant closures…
Second… How bad is the Soarin closure going to be for 6 months?? With only a single operating “E-ticket” attraction, and really only a handful of attractions in any event… seems very very scary.
And what about the big-name refurbishments coming up in Magic Kingdom? Looking at the Upcoming Closures and Refurbishments page (http://touringplans.com/walt-disney-world/closures), there’s a month-long closer for Buzz Lightyear, 3 and a half months for Big Thunder Mountain Railroad, and a 3 week closure of it’s a small world (overlapping with a 10 week closure of Swiss Family Treehouse).
That’s more than 4 months of (pretty popular?) rides that are unavailable next year. Buzz and BTMRR are indicator rides for the crowd calendar, too.
Most of those types of closures are pretty normal. Didn’t realize BTMR is scheduled for 3 1/2 months, but 2-4 closures through the year are pretty normal for all attractions for routine maintenance.
And unlike Epcot, Magic Kingdom has plenty of attractions and plenty of E-ticket attractions. So 1 or 2 closures usually doesn’t have a massive impact.
Yep, Magic Kingdom is last. It’s a craven strategy to get everyone to read the first three, I know. But I think we have the right approach. We’ll have it early next week.
Yeah, Soarin’ will be interesting. When Test Track was closed, the mitigating factors there were the height requirement and rough ride. Not so at Soarin’. It’ll be interesting.
And it was pre-FP+ when Test Track was down.
Just a random point that won’t help anyone anywhere, but it really made me shake my head.
When I was waiting from Peter Pan yesterday, I heard several people in line commenting about how wait times went down when they went from 90 minutes to 105 minutes, and so they left line because times were “clearly getting shorter” (around 12 PM). They were convinced that because the sign said 105 minutes, that meant 1 hour and 5 minutes and were upset that the lines were “so much shorter” than when they got in line at 90 minutes.
So for anyone feeling overwhelmed by the math, if you understand that 105 minutes > 90 minutes, you’re already doing better than some guests… 😉
I wish I thought you were exaggerating. It’s just so sad…
Nope, not exaggerating, we overheard the same thing last week, a lady outside Peter Pan thought 105 meant an hour and 5 minutes too.
But getting out of line because the line was getting “shorter”? In the middle of the afternoon? Yikes… Maybe some of those people left line and got in back so they could have a shorter wait 🙂
That’s at least as logical, Lauren! At least they make the line shorter for the rest of us.