2021 Disneyland Crowd Calendar Retrospective
For the last couple of weeks we’ve been taking a look at the performance of the Disney World Crowd Calendar in 2021, and now it’s time to turn the spotlight to Disneyland. I haven’t even looked at the data yet — I’m just going to do that in a few minutes and then come back to finish writing this — but I wanted to pause first and give my unbiased expectation. (That’s unbiased by not having seen the data, not unbiased about being a TouringPlans fan). That expectation is: 2021 was not a good year to be in the business of forecasting wait times at Disneyland and California Adventure. Here are just a few of many reasons.

1. Avengers Campus opened. Whenever a new land opens, or even a single new headliner, it shifts the wait time patterns at the other attractions in the park and our accuracy takes a hit for a little while. We need time to gather enough data and make the necessary adjustments.
2. Being able to forecast accurately relies on an assumption that the future will be similar to the past. Operational changes — differences in the way that Disney is running the parks — break those assumptions, and can cause all sorts of problems for forecasting. Here’s a short list of some changes that went into effect when Disneyland Resort reopened.
- Changes in attraction capacity: to maintain social distancing attractions were loading every other row, or every other vehicle, or were taking other strategies that limited attractions to serving fewer people per hour.
- Parks had capacity limits, enforced by the need to make a Park Pass Reservation.
- Changes to Park Hopping: if you’ve only visited Disney World, you might not realize that the park entrances to the DLR parks are right across from each other. Hopping between them takes a similar amount of time as moving between Future World and World Showcase in EPCOT, and guests with park hopper tickets may go back and forth many times a day. When the parks reopened, park hoppers couldn’t switch parks until 1 p.m., which could be expected to produce a noticeable change in the traffic pattern.
- No Fastpass. For over two decades many attractions had two queues: the normal standby line and a second line for guests with an assigned Fastpass reservation window. Changing a fundamental dynamic of the queues by eliminating the Fastpass line couldn’t possibly have an effect on wait times, could it? Really? You don’t say.
3. Annual Passes were discontinued during the closure and not offered again until several months after reopening. At Disneyland locals make up a significant portion of guests, and locals who might have visited a few times over the summer may have limited themselves to one visit at the regular ticket price, or none at all.
4. The ups and downs of the local COVID situation. Need I say more?
Time to go crunch some numbers. I’ll be back in a bit.
January, February, March, April
OK, I’m back with the results. I have to say, the first four months when the parks were closed were a breeze, as we successfully predicted crowd levels of 0 on practically every day! The parks were actually open the last day in April, and here’s how we did:
- Disneyland: Predicted = 2, Observed = 1, Error = +1
- California Adventure: Predicted = 1, Observed = 1, Error = 0
An On Target performance (within +/- 1 of the predicted crowd level) everywhere.

Since there’s nothing that we really need to post-mortem in our performance for April, let’s move on.
May & June
I want to take a few moments to introduce the visuals. Each month below contains 7 charts. The 1st represents Park Pass availability for regular tickets and park hoppers. Our crowd levels go from 1 to 10, but since we know that the parks are not operating at full capacity this data is important; we can use it with observed crowd levels to get an idea of what the maximum achievable level actually is. Next are two sets of three heatmaps: each of Disneyland and California Adventure has a set showing what we predicted, what we observed, and the error.
On Target predictions (+/- 1 of prediction) are not colored in the error heatmaps, but to avoid giving the idea that errors in one direction are “good” these charts are colored in orange and purple. Of course, when measuring accuracy all error is bad, but the reality is that most people would very much prefer to find an overprediction, where crowds are lighter than expected. So underpredictions are represented as negative numbers here, matching our expectation that visitors will think about them negatively.


May starts off pretty well, and then somewhere around the middle of the month the crowds really start to swell. It’s almost like a wave: if you just look at Disneyland you can see crowd levels of 1 in the first week, 2 in the second week, 3 in the 3rd week and so on. Towards the end of May we updated our forecasts, moving California Adventure up to 3 and 4 for the rest of May and June.
In hindsight, it definitely looks like we should have raised them a bit higher in both parks. Hindsight is always 20/20 though; we were not relying much on historical data at this point and instead were trying to adapt based on what we saw. Towards the end of May, there were a number of days with the parks at capacity and we got our first look at the max crowd level — it appears they were about a 4 or a 5 in both parks.
On June 4, Avengers Campus opened. Our crowd level forecasts are based on wait times, which means that if there are a lot of people in the park who are there to eat, drink, or take in the atmosphere then we can end up with overprediction. That’s exactly what we see in California Adventure on June 4 and 5; crowds had been steady at level 4-6 for most of the previous week, and again starting on Sunday they went back up, but as a two-day only special they were a 1 in California Adventure! In this case it doesn’t necessarily mean that attendance was light, it just means that lots of guests were spending time in Avengers Campus instead of on rides in other areas of the park.
On June 11 schools in Los Angeles let out for the summer, and on June 15 Disneyland reopened to out-of-state visitors. So of course crowds dropped and people stopped coming to the parks; we can see this because the average crowd levels went from 4-6 all the way back down to 2-4. Maybe locals were so used to their annual passes being blocked out during these dates that they didn’t come even though nobody had annual passes anymore?
Just kidding! While it’s true that there were no annual passes and locals may have chosen to visit less frequently, what we’re really seeing here is that Disney had started to lift some of the social distancing measures that were in place when the park reopened. We saw this same thing at Disney World; when rides began loading every row again attraction capacity increased and wait times (and therefore crowd levels) dropped. If we look at the sold-out days in the latter half of June we can see that the maximum crowd level on these days is now a 3 or a 4 in both parks, which is what tells us that capacity changes are responsible for these lower crowd levels. Attendance, which we don’t measure, was probably steady or increasing.
July

On July 4, evening fireworks returned at Disneyland, bringing more changes to crowd patterns. Disney has also clearly increased capacity again, as there are many days in July where we see levels of 5-7 in both parks even though the parks are not at capacity. Towards the end of July COVID cases are rising very rapidly in L.A. as Delta spreads across the U.S. We see this as overprediction, with crowd levels mostly holding steady through the month although we had expected them to continue rising. It appears as though Disney may have rolled back capacity a bit as we’re now seeing 4-5 again in Disneyland and 5-6 in California Adventure, but with only a few days it’s hard to tell for sure.
August

The story of August at Disney World was Delta, and it’s the story of August at Disneyland as well. In the first half of the month the weekend crowds we were predicting definitely did not show up, and they weren’t coming on weekdays either. After Los Angeles schools went back in session on August 16, our forecasts were a little more in line with what we were seeing in the parks.
September, October & November

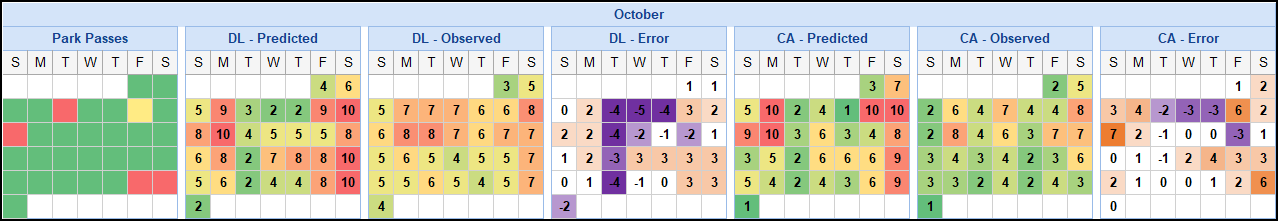
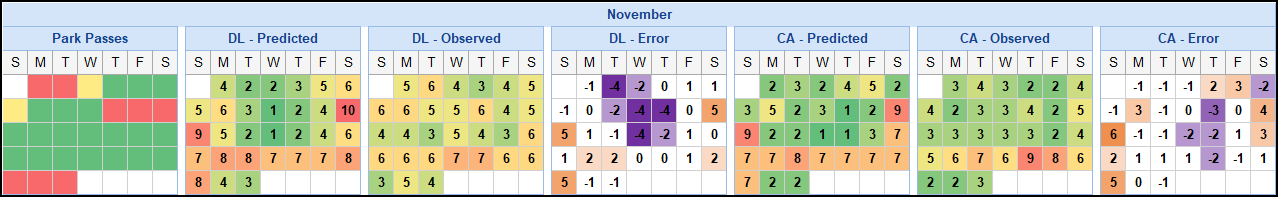
On August 25, Disneyland began selling Annual Passes again with a whole new set of price tiers and blackout dates. As caseloads from Delta begin to wane and more and more locals have access to the parks again with their newly purchased APs, we see demand begin to rise towards the end of September and all through October. For the first time since early June we’re seeing a strong pattern of underprediction, mostly in Disneyland and less so in California Adventure; some of this is likely also due to vacationers who postponed trips during August.
You may be tempted to ask why we didn’t release an update to bring forecasts back in line with observations. The problem is that swells like this that come partly from pent-up demand have a tendency to behave like water flowing through a burst dam. At first it’s fast and furious, but eventually it slows to a trickle — and exactly how long that will take can be hard to anticipate. Even when it’s running strong it can be hard to predict; October has a mix of overprediction and equally large underpredictions as we got the weekdays wrong in one direction and the weekends wrong in the other one. If you look at the observed crowd levels, you can see that by early November the average is already beginning to drop back towards what we might expect based on historical demand.
December
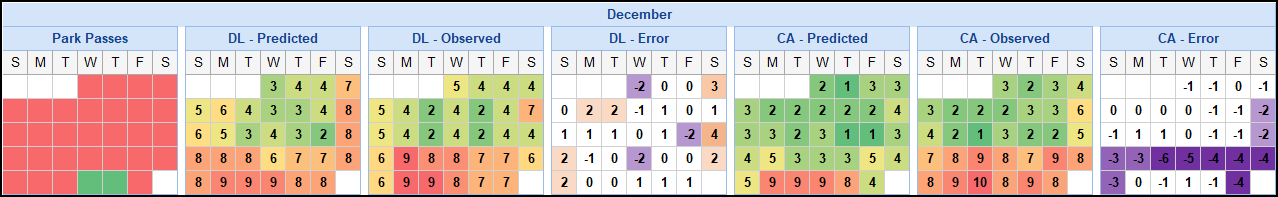
December looks great! OK, I don’t really know what happened at California Adventure in the week before Christmas, and it kind of looks like that one is totally on us because the crowd levels in our CA forecasts are so much lower than they are in Disneyland. That’s definitely something we should review for next year. But overall, I’ll take it!
Final Scores
We’ve been working our way through the error based on “feel”, so to get some hard numbers I calculated the error distribution for each park. This lets us see not only the percentage of On Target days but also how the overall errors were distributed.

We did pretty well! The distributions are bell-shaped, which we like, and both are centered around 0 as the most frequent outcome, which we also like. Disneyland kind of has a flat top on its hill, but it’s not too bad. Most importantly, our On Target prediction percentage comes out at 56.1% for California Adventure and 58.9% for Disneyland.
This might seem surprising to see this after reading the analysis above, but there are two critical things that can create a biased perception. The first is that we spent a lot of time talking about where errors were coming from, but when there wasn’t a lot of error I breezed through it quickly. The second is that when you have heatmaps like we used here where some of the data is uncolored, the colored cells are emphasized and we’re often left with a distorted impression of the outcome. They’re terrific for highlighting patterns and areas of interest, but you should never rely on a partly-colored heatmap like this for a final assessment.
How does this compare to historical accuracy? Pretty well, as it turns out.

Our accuracy this year was very similar to what we achieved in 2017 and 2018. In 2019 the scores are very low, but that was the year that Galaxy’s Edge opened and crowd patterns that year were … interesting. Any time a new land opens it can affect accuracy for a while, but you may also recall stories of the expected crowds that didn’t appear because everyone simultaneously decided to wait until the crowds died down.
Wrapping Up
As I’ve been working my way through these crowd calendar reviews, I find that I keep using the word rollercoaster — and yes, that word does mean what I think it means. It often felt that our forecasts were dependent on factors that went from up to down in an instant, and vice versa, with no warning and no control on our part. There are always limits to what we can do with a prediction, as factors like weather can easily affect crowd levels. But this year, in this park, there was a constant stream of So Much Change. I really think our modeling team deserves a round of applause for achieving results that were right in line with our accuracy in a normal year.
As you visit the parks, here are our suggestions to get the best experience with our crowd calendars.
- Check crowd-level predictions shortly before your trip, since we make updates on a regular basis. Subscribers can use the crowd tracker and get notified automatically when we make updates to days they’re following.
- Take the time to look at the predicted attraction wait times for the park you plan to visit. Sometimes we get complaints from people who are in the parks on a level 3 day and are surprised by a long line; they don’t realize that what they’re seeing might be par for the course at level 3. Having realistic expectations can be the key to a great day.
- If you use a touring plan, reoptimize it every now and then during the day. Once the park opens our prediction is frozen in history, but we update our day-of wait time estimates frequently based on what we see in the parks. Even if our predicted crowd level turns out to have been way off, reoptimizing will help you to have an optimal day.
Are you planning a trip to Disneyland this year? Do you agree that our modeling team deserves a round of applause? Let us know in the comments!

You May Also Like...
-

Happy Thanksgiving Everyone! Well, almost. We are anxiously waiting to see how many people head to Disneyland Resort for the holiday.…
-

Disneyland Resort has been reopened for 25 days and crowds are already starting to build. After opening to mostly crowd level…
-

Everyone's number one priority right now is to help slow the spread of COVID-19 by practicing social distancing. Disney did their…
-
Disneyland is Opening! On April 30, 2021, Disneyland will reopen to Californians for the first time since March 13, 2020. The…
Please make a post about what’s been going on last week! We’re seeing stuff that’s as much as 5 points higher than predicted on the CL scale, and I’d love to hear your take on the reasons why (even if it’s just speculative).