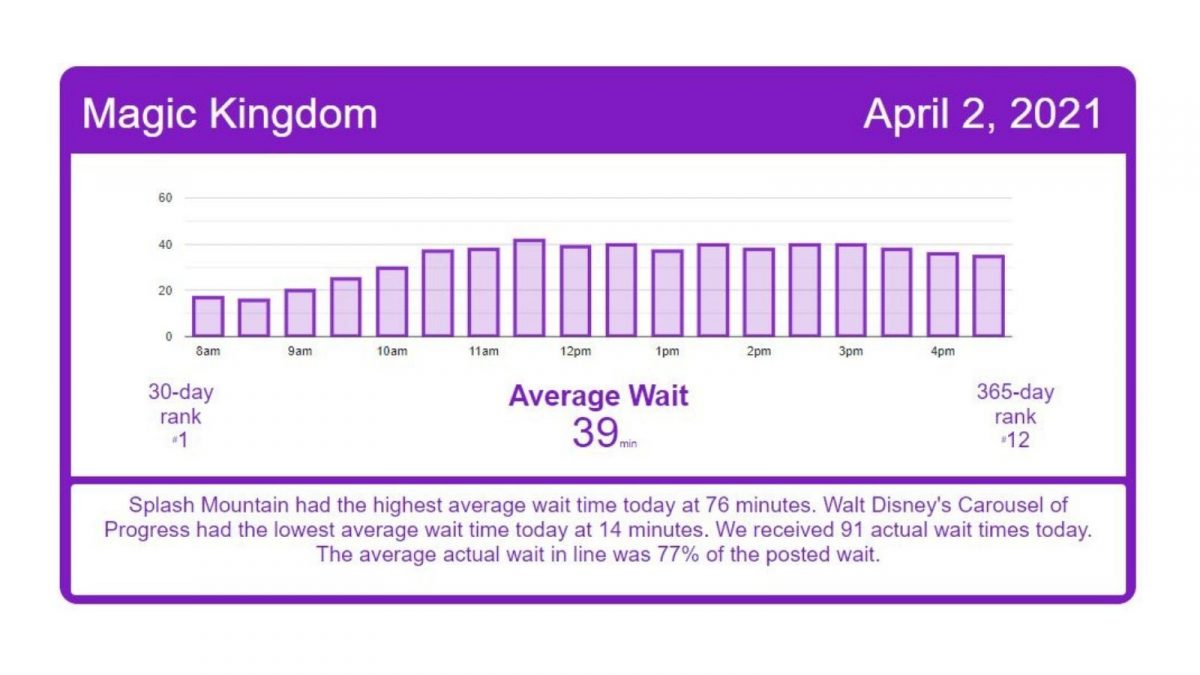
Magic Kingdom’s Busiest Day – Wait Times for Friday, April 2, 2021
Easter weekend is here! Pleasant weather combined with Easter crowds lead to Magic Kingdom’s posted wait times being the highest of the past 30 days. It should be noted that a few attractions at Magic Kingdom and Hollywood Studios had some significant down times, or started operating later in the day. EPCOT’s wait times rank at number 5 of the past 30 days, while Hollywood Studios and Animal Kingdom rank in the middle.
Disney’s posted wait times were about as accurate as we expect. We received 191 actual wait times from our awesome Lines app users, our Liners. At Magic Kingdom today we observed 493 out of 500 (98%) guests wearing their masks in accordance with Disney’s guidelines. Let’s hop into the numbers!
Magic Kingdom Wait Times

Astro Orbiter had an average wait time today of 41 minutes. Its 7-day average is 38 minutes, so today ranks #1 for this week. Its 30-day average is 40 minutes, so today ranks #12 for the past month. Its 365-day average is 32 minutes, so today ranks #48 for the past year.
Big Thunder Mountain Railroad had an average wait time today of 62 minutes. Its 7-day average is 40 minutes, so today ranks #1 for this week. Its 30-day average is 42 minutes, so today ranks #1 for the past month. We received 9 actual wait times today, and the actual wait averaged 51% of the posted wait time, so the average actual wait time was 32 minutes.
“it’s a small world” had an average wait time today of 48 minutes. Its 7-day average is 47 minutes, so today ranks #3 for this week. Its 30-day average is 47 minutes, so today ranks #10 for the past month. Its 365-day average is 36 minutes, so today ranks #38 for the past year.
Peter Pan’s Flight had an average wait time today of 43 minutes. Its 7-day average is 41 minutes, so today ranks #2 for this week. Its 30-day average is 44 minutes, so today ranks #16 for the past month. Its 365-day average is 33 minutes, so today ranks #45 for the past year. We received 6 actual wait times today, and the actual wait averaged 101% of the posted wait time.
Space Mountain had an average wait time today of 68 minutes. Its 7-day average is 52 minutes, so today ranks #1 for this week. Its 30-day average is 52 minutes, so today ranks #1 for the past month. Its 365-day average is 37 minutes, so today ranks #8 for the past year. We received 12 actual wait times today, and the actual wait averaged 88% of the posted wait time.
Splash Mountain had an average wait time today of 76 minutes. Its 7-day average is 77 minutes, so today ranks #4 for this week. Its 30-day average is 73 minutes, so today ranks #15 for the past month. Its 365-day average is 51 minutes, so today ranks #39 for the past year.
The Barnstormer had an average wait time today of 28 minutes. Its 7-day average is 21 minutes, so today ranks #1 for this week. Its 30-day average is 22 minutes, so today ranks #3 for the past month. Its 365-day average is 18 minutes, so today ranks #50 for the past year.
The Haunted Mansion had an average wait time today of 24 minutes. Its 7-day average is 27 minutes, so today ranks #5 for this week. Its 30-day average is 29 minutes, so today ranks #26 for the past month. We received 11 actual wait times today, and the actual wait averaged 42% of the posted wait time, so the average actual wait time was 10 minutes.
Seven Dwarfs Mine Train had an average wait time today of 74 minutes. Its 7-day average is 62 minutes, so today ranks #1 for this week. Its 30-day average is 63 minutes, so today ranks #1 for the past month. Its 365-day average is 57 minutes, so today ranks #37 for the past year. We received 9 actual wait times today, and the actual wait averaged 73% of the posted wait time.
Under the Sea ~ Journey of the Little Mermaid had an average wait time today of 23 minutes. Its 7-day average is 24 minutes, so today ranks #4 for this week. Its 30-day average is 25 minutes, so today ranks #21 for the past month. Its 365-day average is 20 minutes, so today ranks #123 for the past year. We received 4 actual wait times today, and the actual wait averaged 47% of the posted wait time.
EPCOT Wait Times

Gran Fiesta Tour Starring The Three Caballeros had an average wait time today of 6 minutes. Its 7-day average is 9 minutes, so today ranks #4 for this week. Its 30-day average is 9 minutes, so today ranks #15 for the past month. Its 365-day average is 9 minutes, so today ranks #175 for the past year.
Journey Into Imagination With Figment had an average wait time today of 22 minutes. Its 7-day average is 20 minutes, so today ranks #1 for this week. Its 30-day average is 17 minutes, so today ranks #3 for the past month. Its 365-day average is 14 minutes, so today ranks #38 for the past year.
Soarin’ had an average wait time today of 68 minutes. Its 7-day average is 69 minutes, so today ranks #3 for this week. Its 30-day average is 57 minutes, so today ranks #6 for the past month. Its 365-day average is 35 minutes, so today ranks #13 for the past year. We received 5 actual wait times today, and the actual wait averaged 79% of the posted wait time.
Spaceship Earth had an average wait time today of 28 minutes. Its 7-day average is 35 minutes, so today ranks #6 for this week. Its 30-day average is 29 minutes, so today ranks #17 for the past month. Its 365-day average is 18 minutes, so today ranks #49 for the past year.
Test Track had an average wait time today of 77 minutes. Its 7-day average is 73 minutes, so today ranks #2 for this week. Its 30-day average is 65 minutes, so today ranks #7 for the past month. We received 7 actual wait times today, and the actual wait averaged 61% of the posted wait time, so the average actual wait was 47 minutes
The Seas with Nemo & Friends had an average wait time today of 17 minutes. Its 7-day average is 19 minutes, so today ranks #6 for this week. Its 30-day average is 16 minutes, so today ranks #13 for the past month. Its 365-day average is 11 minutes, so today ranks #36 for the past year.
Frozen Ever After had an average wait time today of 53 minutes. Its 7-day average is 52 minutes, so today ranks #3 for this week. Its 30-day average is 46 minutes, so today ranks #6 for the past month. Its 365-day average is 45 minutes, so today ranks #86 for the past year.
Disney’s Hollywood Studios Wait Times

Muppet*Vision 3D had an average wait time today of 33 minutes. Its 7-day average is 34 minutes, so today ranks #5 for this week. Its 30-day average is 32 minutes, so today ranks #15 for the past month. Its 365-day average is 21 minutes, so today ranks #33 for the past year.
Star Tours: The Adventures Continue had an average wait time today of 39 minutes. Its 7-day average is 36 minutes, so today ranks #1 for this week. Its 30-day average is 37 minutes, so today ranks #8 for the past month. Its 365-day average is 28 minutes, so today ranks #32 for the past year.
The Twilight Zone Tower of Terror had an average wait time today of 62 minutes. Its 7-day average is 63 minutes, so today ranks #2 for this week. Its 30-day average is 68 minutes, so today ranks #17 for the past month. Its 365-day average is 51 minutes, so today ranks #65 for the past year. We received 4 actual wait times today, and the actual wait averaged 94% of the posted wait time.
Toy Story Mania! had an average wait time today of 37 minutes. Its 7-day average is 33 minutes, so today ranks #1 for this week. Its 30-day average is 35 minutes, so today ranks #6 for the past month. Its 365-day average is 27 minutes, so today ranks #28 for the past year. We received 7 actual wait times today, and the actual wait averaged 88% of the posted wait time.
Mickey & Minnie’s Runaway Railway had an average wait time today of 40 minutes. Its 7-day average is 37 minutes, so today ranks #1 for this week. Its 30-day average is 43 minutes, so today ranks #22 for the past month. We received 9 actual wait times today, and the actual wait averaged 88% of the posted wait time, so the average actual wait was 35 minutes.
Millennium Falcon: Smugglers Run had an average wait time today of 66 minutes. Its 7-day average is 62 minutes, so today ranks #1 for this week. Its 30-day average is 61 minutes, so today ranks #6 for the past month. Its 365-day average is 52 minutes, so today ranks #40 for the past year.
Lightning McQueen’s Racing Academy had an average wait time today of 32 minutes. Its 7-day average is 30 minutes, so today ranks #4 for this week. Its 30-day average is 30 minutes, so today ranks #10 for the past month. Its 365-day average is 20 minutes, so today ranks #39 for the past year.

Rise of the Resistance is having a pretty strong day after a few rough ones earlier this week. It is running ahead of pace of the past 7 days in some cases and could reach boarding groups in the 180 range.
Disney’s Animal Kingdom Wait Times

DINOSAUR had an average wait time today of 55 minutes. Its 7-day average is 49 minutes, so today ranks #1 for this week. Its 30-day average is 52 minutes, so today ranks #8 for the past month. Its 365-day average is 32 minutes, so today ranks #35 for the past year. We received 4 actual wait times today, and the actual wait averaged 93% of the posted wait time.
Expedition Everest – Legend of the Forbidden Mountain had an average wait time today of 28 minutes. Its 7-day average is 26 minutes, so today ranks #1 for this week. Its 30-day average is 25 minutes, so today ranks #6 for the past month. We received 13 actual wait times today, and the actual wait averaged 74% of the posted wait time, so the average actual wait was 21 minutes.
Kali River Rapids had an average wait time today of 22 minutes. Its 7-day average is -1 minutes, so today ranks #1 for this week. Its 30-day average is -1 minutes, so today ranks #1 for the past month. Its 365-day average is 18 minutes, so today ranks #48 for the past year.
Kilimanjaro Safaris had an average wait time today of 42 minutes. Its 7-day average is 35 minutes, so today ranks #1 for this week. Its 30-day average is 35 minutes, so today ranks #6 for the past month. Its 365-day average is 22 minutes, so today ranks #12 for the past year. We received 8 actual wait times today, and the actual wait averaged 64% of the posted wait time.
Na’vi River Journey had an average wait time today of 42 minutes. Its 7-day average is 44 minutes, so today ranks #6 for this week. Its 30-day average is 64 minutes, so today ranks #27 for the past month. Its 365-day average is 46 minutes, so today ranks #153 for the past year.
Avatar Flight of Passage had an average wait time today of 86 minutes. Its 7-day average is 74 minutes, so today ranks #1 for this week. Its 30-day average is 70 minutes, so today ranks #1 for the past month. Its 365-day average is 48 minutes, so today ranks #19 for the past year. We received 9 actual wait times today, and the actual wait averaged 84% of the posted wait time.
You May Also Like...
-

The weird winter chill has come and gone, leaving pleasant temperatures in Orlando again. Posted wait times at all four Walt…
-

Today's average posted wait times at the Animal Kingdom were the highest they've been in the past 30 days, while posted…
-

We're kicking off the week by seeing higher average posted wait times today at Hollywood Studios and EPCOT. The Studios' average…
-

The Magic Kingdom's average posted wait today was just 16 minutes - that's all day, across all attractions - and even…