2022 Disney World Crowd Calendar Retrospective
If you were paying attention last week, you know that I celebrated the new year by comparing Touring Plans predictions to Disney’s ticket costs “prediction” about crowd levels. The results were admittedly very favorable to Touring Plans, and you can catch up with them here. This week I’m digging a little deeper and trying to determine how our crowd calendar predictions performed compared to previous years and at the park level. All of this will help the stats team to make even better predictions in the future, and to help you make better plans throughout the 2023.
Explain the Math!
If you take a peek at our Walt Disney World crowd calendar, you’ll notice that each park-day is given a predicted crowd level on a scale from 1 to 10. Crowd level 1 days are the least crowded of the year, and crowd level 10 days are wall-to-wall humans everywhere you look. These are Touring Plans’ predicted crowd levels.
Then, after a park day happens, we can measure all of the wait times at every attraction in every park and determine what the actual crowd level was for that day. By subtracting the difference between the actual and the predicted crowd level, we can get an easy measure of how accurate those predictions were.
In this case, I’m going to subtract the predicted crowd level from the actual crowd level. For example, if Touring Plans predicted a crowd level 10 at Magic Kingdom, but the day ends up being a crowd level 8, the difference is -2. The crowds were overpredicted by 2. But if Touring Plans predicts a crowd level 4 at EPCOT and the day ends up being a crowd level 7, the difference is 3. The crowds were underpredicted by 3.
In general, you’re not going to feel any difference in your park day if predictions are off by just one crowd level. Within 1 crowd level is the goal. Really anything within 2 crowd levels I’ll call “fine”. Missing by 3 or more crowd levels is a big miss, and that’s the type of thing that should be avoided.
2022 Performance Compared to Previous Years

In an ideal world, that green bar would be 100% every year. Touring Plans would have perfect predictions, you’d love and believe them 100% of the time, and we’d all get along so well together. In reality, there was this thing called a pandemic. And even before then, Walt Disney World could change their operational decisions on a whim. Capacities, staffing, hours, etc. are all under their control. And the stats team tries to not change the predicted crowd levels constantly so that people planning have some stability. These operational changes have shifted into hyper-drive post pandemic, along with the unpredictability of COVID waves and other weird human behavior. So there’s a lot working against stable predictions. Still, everyone wants that green bar in the graph to be as big as possible. And we especially want the red and pink bars (missed by 3 or more crowd levels) to be as small as possible.
What about the other bars? Well, in general, people are happier if the parks are less crowded than they expect (aka, Touring Plans overpredicted). And they’re more upset if the parks are more crowded than they expect (aka, Touring Plans underpredicted). But Touring Plans is full of math nerds, and math nerds want our distribution to be centered (aka, just as many underpredictions as overpredictions). Still, during a retrospective, I’m going to recognize and acknowledge that all of our lovely customers are going to be less angry with us if those underpredictions are kept to a minimum.
2022 wasn’t terrible. The size of that green bar is smaller than in 2020 and 2021. But those were weird years. In 2020 specifically, Touring Plans could predict a 1 and the actual crowds would be a 1 most of the time after reopening. The comparison to 2019 is more interesting. And that green bar is slightly larger in 2022 than in 2019. Unfortunately, the location of that green bar in 2022 is more problematic than in 2019. In 2019, Touring Plans underpredicted by 2 or more crowd levels just 18% of the time. In 2022, that number went up to 27% of the time. So the good news is that predictions were spot-on more of the time, but they also underestimated crowd and made people angry more of the time than any of the 3 previous years.
2022 Performance Compared Across Parks
In order to understand what went right (or wrong) in 2022, we need a little more information. In this article we’ll go down one level and look at how predictions performed at each park rather than the resort as a whole.
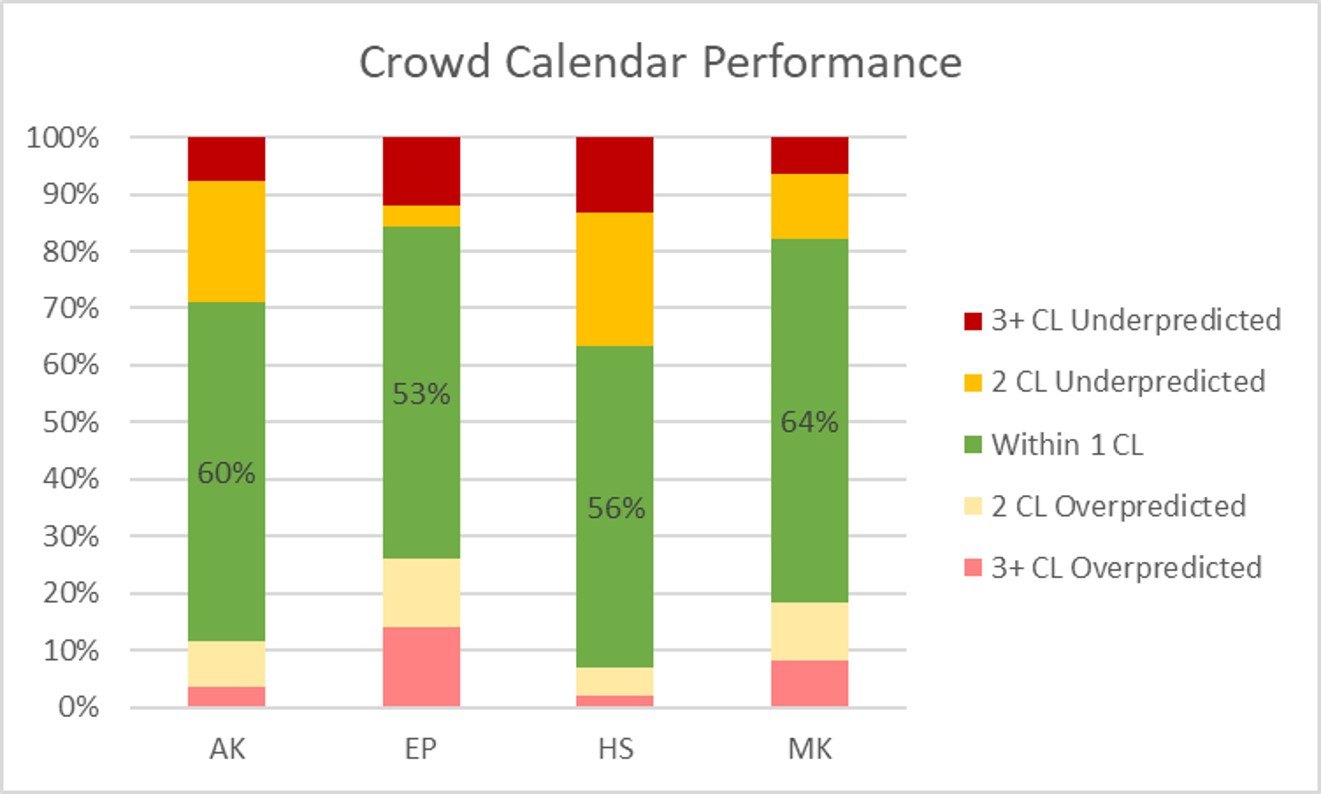
We can quickly see that Magic Kingdom is the park that the predictions got “most right” in 2022. Touring Plans predictions were within 1 crowd level 64% of the time. And EPCOT is where there was the most trouble in 2022 – predictions were only within 1 crowd level 53% of the time.
Magic Kingdom wins again for least “skewed” predictions. At that park in 2022, Touring Plans overpredicted by 2 or more crowd levels 18% of the time, and underpredicted by 2 or more crowd levels 18% of the time. Nice and centered. At Hollywood Studios, we see the most “skewed” predictions. Touring Plans only overpredicted by 2 or more crowd levels 7% of the time. On the other hand, we underpredicted by 2 or more crowd levels 37% of the time.
Calendar Retrospective of Crowd Calendars
What better way to review calendars than with more calendars?!
I’ll start here with the park where predictions had the highest accuracy, provide my commentary, and then move to the next park. We can discuss park-specific issues, as well as trends that I notice affecting multiple parks.
Magic Kingdom

At Magic Kingdom, predictions were within 1 crowd level 64% of the time. This is represented by all of those lovely white days on the calendar. When Touring Plans overpredicted crowds, those days turn purple. And when predictions make people angry by underpredicting crowds, those days turn orange. The darker orange, the angrier the people.
We start off with a weird January. A very weird January. Omicron snuck up on everyone and knocked out a lot of travel, especially in early January. We’ll see lots of purple at every park in early January. But then on January 24th, Touring Plans predicted a crowd level 4 and it ended up being a 10! This underprediction by 6 crowd levels is the worst miss of the entire year – matched only by one day at Hollywood Studios. This was a weird day, because the park was closing very early the next day. That forced a lot of unexpected crowds into Magic Kingdom the day before.
Zooming back out, April was generally more crowded than expected, while March and July were more crowded than expected. During party season, you can see a pattern of regularly overpredicting crowds on party days, and underpredicting crowds on non-party days that were surrounded by party days. What’s the deal with that?
On party days, the Magic Kingdom closes early so that party guests can enjoy the more-empty-ish park that they paid to experience. That means that regular day guests tend to avoid these days and instead go to Magic Kingdom on other surrounding days that have longer operating hours. Which makes sense, if you don’t think about ALL of the other humans making the same decision. What ends up happening is that party days have much lower crowds, and non-party days that are sandwiched in-between two party days have much higher crowds. We know this phenomenon exists, but crowd calendar predictions didn’t accurately capture the extent of the behavior this year.
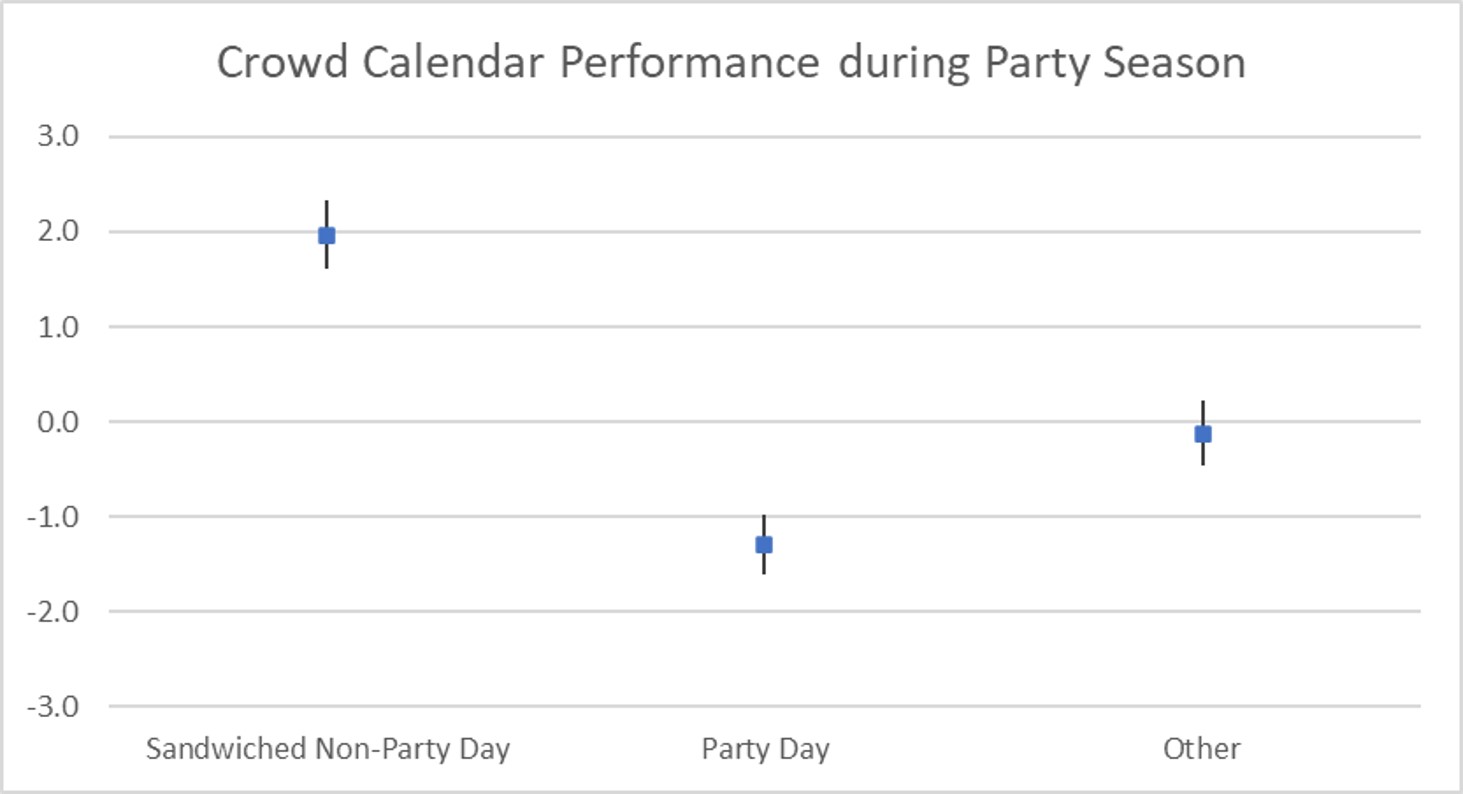
Here’s a visualization of the problem. On non-party days that were sandwiched by party days, Touring Plans tended to under-estimate the crowds by an average of 2 crowd levels. Those lines on either side of the box are the 95% confidence interval based on the sample we have. On party days, on the other hand, Touring Plans tended to over-estimate the crowds by an average of 1.3 crowd levels. If there are days during party season that don’t have parties, but also aren’t sandwiched, Touring Plans did really well predicting crowds for those days.
Animal Kingdom

Animal Kingdom still has a lot of white-colored days. And early January is still hit by the Omicron avoid-the-humans length of overpredicted days.
Otherwise, a lot of the trends here are different than Magic Kingdom! July’s behavior, for example, is totally different. At Magic Kingdom it was all whites and purples, and at Animal Kingdom it is all whites and oranges. So folks avoided Magic Kingdom and headed to Animal Kingdom instead. In fact, most of the April-through-October time displays this behavior.
Most of the purples (overpredictions; lower-than-expected crowds) at Animal Kingdom occur in the cooler months in Orlando – especially January through March.
Hollywood Studios

Ah, Hollywood Studios. Remember, this was the most “skewed” park, and we can see it in the coloring here. There’s more orange on this calendar than any of the others. We still have our purple early-January, but otherwise purples are few, and scattered almost at random.
We also see our tie for worst under-prediction at Hollywood Studios on February 15th. On that day, the predicted crowd level was a 2, and the actual crowd level ended up being an 8. Part of this was due to ride downtime, because 10% of capacity was unexpectedly lost that day. But that doesn’t make up all of a 2 to an 8. This was a big miss.
The core summer months were also off here – with regular underpredictions from the beginning of June through late August. July was especially bad, with only 8 days that were predicted accurately within one crowd level.
EPCOT

We wrap things up with the most inaccurate park, dear old EPCOT. I think there are a lot of interesting things that this calendar, in particular, can show us.
If we begin at the start of the year, we have the usual Omicron-induced overpredictions. But then, right when the Festival of the Arts kicks off, crowds begin heading to EPCOT at a rate that wasn’t predicted. And those crowds keep beating predictions all of the way through that first festival of the year. When the festival ends, the crowds disappear (or choose other parks). In March all of the predictions started being reliably too high instead of reliably too low. And that trend continues through most of the Spring.
In June and July the pendulum swings back to more crowds in EPCOT than expected. This shouldn’t be surprising, given the late-May opening of Cosmic Rewind that drew many visitors to the park. They had boarding groups that required them to wait to be called, and so they swarmed all of the other attractions in the meantime.
Things calm down in August, and then in September get even less crowded than expected … again. Crowds come back in October, then even back out for the rest of the year.
What can all of this tell us? Crowds at EPCOT are more heavily dependent upon events than any other park. And Festival of the Arts is pretty popular. It was probably all of those people trying to get Figment popcorn buckets 🙂
Did any of the results of this retrospective surprise you? Were you at Walt Disney World for any of the significant overpredictions or underpredictions? Let me know in the comments!
You May Also Like...
-

Average Errors by Park The Disney World Crowd Calendar is having a good year. Not perfect, but good. In 2017 our…
-
The April Crowd Calendar update only has minor changes. We are halfway through spring break, and crowd levels have been in-line…
-
Today we are pushing a quick update to Crowd Calendar forecasts for Disneyland Resort. These are to reflect the lower weekend…
-
Feb 1 2023 note: - if you got here from a Crowd Tracker update email sent today, you're looking for the…
Interesting to see the challenges of predicting the quickly changing environments of the past few years. It has me a bit worried that we are planning to go to the Magic Kingdom the Monday before it closes early for their Cast member celebration on Tuesday 1/31, the exact same setup as last years big miss at Magic Kingdom. Despite that miss, this years Crowd Calendar is predicting that day to be a 3 at Magic Kingdom. I’m trusting this one will be more accurate. I understand the strategy of going on a early closing day for the low crowds the rest of the day from the perspective of strictly getting on rides efficiently, but we really feel like being in the Magic Kingdom at night and experiencing the nightly fireworks (still kills us that there isnt a replacement night time parade since MSEP was retired) are some of the most memorable and magical parts of a day at MK.
This is great data and love the self reflection!
Interesting to see how off the crowds were in the middle of February. That’s when we just happened to be there and we purposely picked what parks we were going to when based on the predicted levels. It was quite shocking to see what those were in reality!
We are going this year earlier in February, so I’m hoping those predicted levels are more accurate this time.
For our trip during Thanksgiving week, we hit MK during a light purple and a dark purple. They were both party days and SO amazingly uncrowded!!! Our HS, AK, and EPCOT days were white!!! Way to go data gurus!!