2022 Disneyland Crowd Calendar Retrospective
We’re almost to the end of January, and that means that we need to wrap up all of our crowd calendar retrospectives so that we can start looking forward to the year ahead! We’ve already reviewed the results from Walt Disney World, and from Universal Orlando. That leaves us with Disneyland. How did the Touring Plans predictions fare compared to actual crowds on the west coast?
Explain the Math!
If you take a peek at the Disneyland crowd calendar, you’ll notice that each park-day is given a predicted crowd level on a scale from 1 to 10. Crowd level 1 days are the least crowded of the year, and crowd level 10 days are wall-to-wall humans everywhere you look. These are the predicted crowd levels.
Then, after a park day happens, we can measure all of the wait times at every attraction in every park and determine what the actual crowd level was for that day. By subtracting the difference between the actual and the predicted crowd level, we can get an easy measure of how accurate our predictions were.
In this case, I’ll subtract the predicted crowd level from the actual crowd level. For example, if we predict a crowd level 10 at California Adventure, but the day ends up being a crowd level 8, the difference is -2. We overpredicted the crowds by 2. But if we predict a crowd level 4 at Disneyland and the day ends up being a crowd level 7, the difference is 3. We underpredicted the crowds by 3.
In general, you’re not going to feel any difference in your park day if predictions are off by just one crowd level. Within 1 crowd level is the goal. Really anything within 2 crowd levels I’ll call “fine”. Missing by 3 or more crowd levels is a big miss, and that’s the type of thing it’s best to avoid.
2022 Performance Compared to Previous Years

In an ideal world, that green bar in the middle of each column would be 100% every year. Touring Plans would have perfect predictions that matched reality, everyone would trust them all of the time, and we’d all be so happy. The problem is … this isn’t an ideal world. Humans are unpredictable. And humans make the operational decisions for Disneyland, and humans are the ones that decide whether to visit Disneyland or not. Plus, Touring Plans tries to not change the predicted crowd levels constantly so that people planning have some stability. So there’s a lot working against perfect predictions. Even still, we all want that green bar in the graph to be as big as possible. And we especially want the red and pink bars (missed by 3 or more crowd levels) to be as small as possible.
What about the other bars? Well, in general, people are pleasantly surprised if the parks are less crowded than they expect (aka, Touring Plans overpredicted). And they’re unpleasantly surprised if the parks are more crowded than they expect (aka, Touring Plans underpredicted). But Touring Plans is full of math nerds, and nerds want distributions to be centered (aka, just as many underpredictions as overpredictions). Still, during a retrospective, I’m going to recognize and acknowledge that all of our lovely customers are going to be less full of rage if the stats folks can keep those underpredictions to a minimum.
2022 doesn’t look so bad if we’re paying attention to the size of that green bar in the middle. Predictions were within one crowd level 47% of the time. That’s better than predictions performed in 2019 and 2020. It’s worse than 2021, but 2021 was a weird and short reopening year. There was quite a bit of time where Touring Plans could predict low crowds, and everyone knew there were going to be low crowds. Unfortunately, our results are much more skewed this year than any of the previous three years. Touring Plans’ predictions underestimated crowd levels by 2 or more crowd levels 31% of the time and only overestimated crowd levels by 2 or more crowd levels 22% of the time. Previously, the biggest years for underestimated only underestimated 20% of the time.
2022 Performance Compared Across Parks

In order to understand what went right (or wrong) in 2022, we need a little more information. Let’s go down one level and look at how predictions performed at each park rather than the resort as a whole. This is significantly easier at Disneyland, compared to Disney World, since there are only two parks.
We can pretty quickly see that predictions for California Adventure were more “off” than those for Disneyland. Its green bar smaller (40% within 1 crowd level compared to 54%), and it has slightly more underpredictions. But Disneyland, while more accurate overall, predictions were much more “skewed”. At that park, Touring Plans only overpredicted by 2 or more crowd levels 16% of the time. On the other hand, we underpredicted by 2 or more crowd levels 30% of the time. Underpredicting almost twice as much as overpredicting feels a lot worse than when the errors are balanced.
Calendar Retrospective of Crowd Calendars
What better way to review calendars than with more calendars?! I know I love making and coloring calendars in Excel so that probably means you love the results. We’ll go with that.
I’ll start here with Disneyland, where predictions had the highest accuracy, provide my commentary, and then move to California Adventure. We can discuss park-specific issues, as well as trends that I notice affecting both parks.
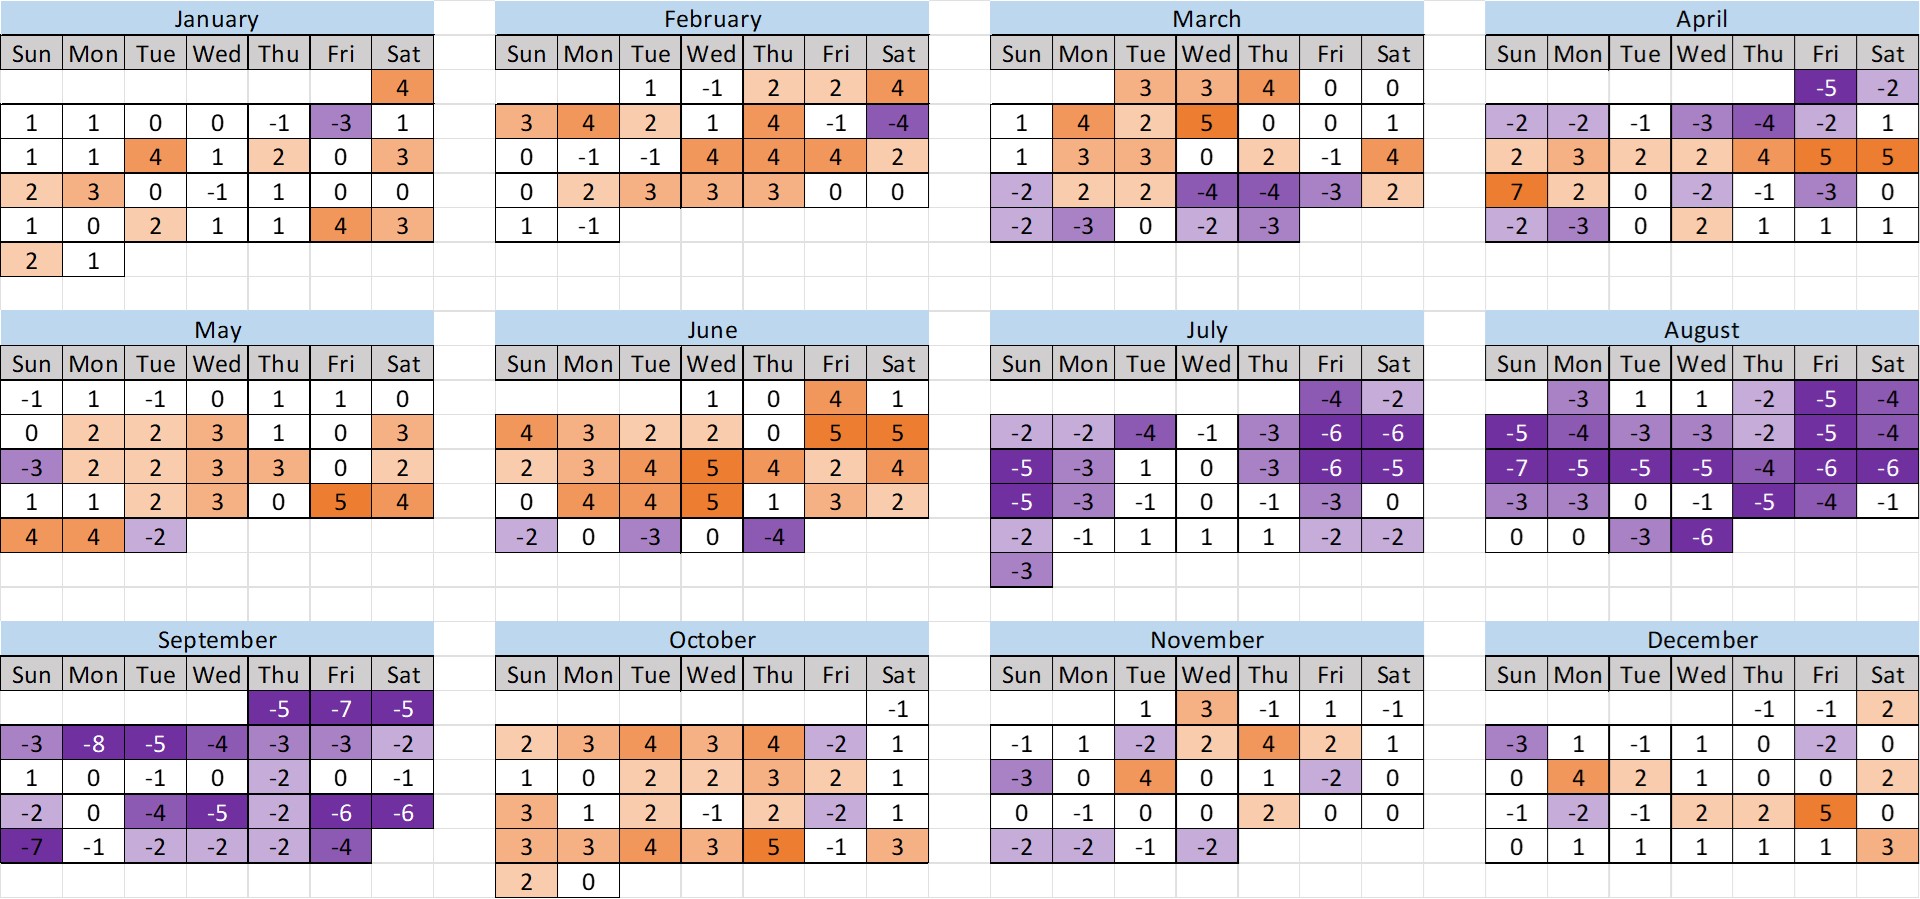
Disneyland

We’re seeing a lot more color here than we did in most calendars for WDW or for Universal Orlando. And we see a few trends that will become even more clear as we move on to California Adventure. First, that omicron wave of cancelled trips and overpredictions in Florida didn’t impact Disneyland at all. In fact, at Disneyland, most days were underpredicted – some significantly so.
February, March, and April are generally more balanced, other than a couple of big misses, like an underprediction by 6 crowd levels on February 7th, and four more underpredictions by 5 crowd levels. Then May and June were filled with underpredictions – more crowds than what were predicted or expected. In July, though, this flips on its head, and crowds are consistently overpredicted instead, all of the way through September.
For the rest of the year, things come back into more balance, other than we still see an underprediction of crowds in the middle of the week through most of October and November.
California Adventure
California Adventure is the … well, it’s admittedly the worst calendar that we’ve seen. We’ve rarely seen any misses by more than 5 crowd levels. And here we see 25 misses by 5 crowd levels, 8 misses by 6 crowd levels, 4 misses by 7 crowd levels, and even a miss by 8 crowd levels.
Trends first noted in the Disneyland calendar are magnified at California Adventure. The mixed results of under- and over-predictions in March and April see bigger swings in magnitude of the misses. May and June are even more steadily under-predicted. July through September are even more overpredicted, with lots of very significant overpredictions through each of these months.
Compared to the rest of the year, things calm back down to something more “normal” from October through the end of 2022. October has a bunch of underpredictions, but these even out in November and December.
Did you experience any of these major overpredictions or underpredictions at Disneyland or California Adventure? Do you have any hypotheses about the trends in months that were much more or much less crowded than expected?
You May Also Like...
-

Today we are pushing a quick update to Crowd Calendar forecasts for Disneyland Resort. These are to reflect the lower weekend…
-
We recently updated our Crowd Calendar predictions for Walt Disney World. You can read about it here. Many of the explanations…
-
Wait times at Disneyland Resort are up - way up! Since June 1, Disneyland Park has seen crowds levels hit a…
-
Average Errors by Park The Disney World Crowd Calendar is having a good year. Not perfect, but good. In 2017 our…
Do you think restrictions on park hopping had any affect on the unexpected crowd fluctuations at DCA?
Ooh, that’s an intriguing hypothesis. But I would assume that it would lead to more baseline shifts rather than weird spiky off-ness that we saw. I could definitely be wrong though.
What are the closing times for regular guests during the January night time parties, and how do they compare to the Halloween and Christmas parties?