New Average Wait Times at Soarin’ & Toy Story Midway Mania
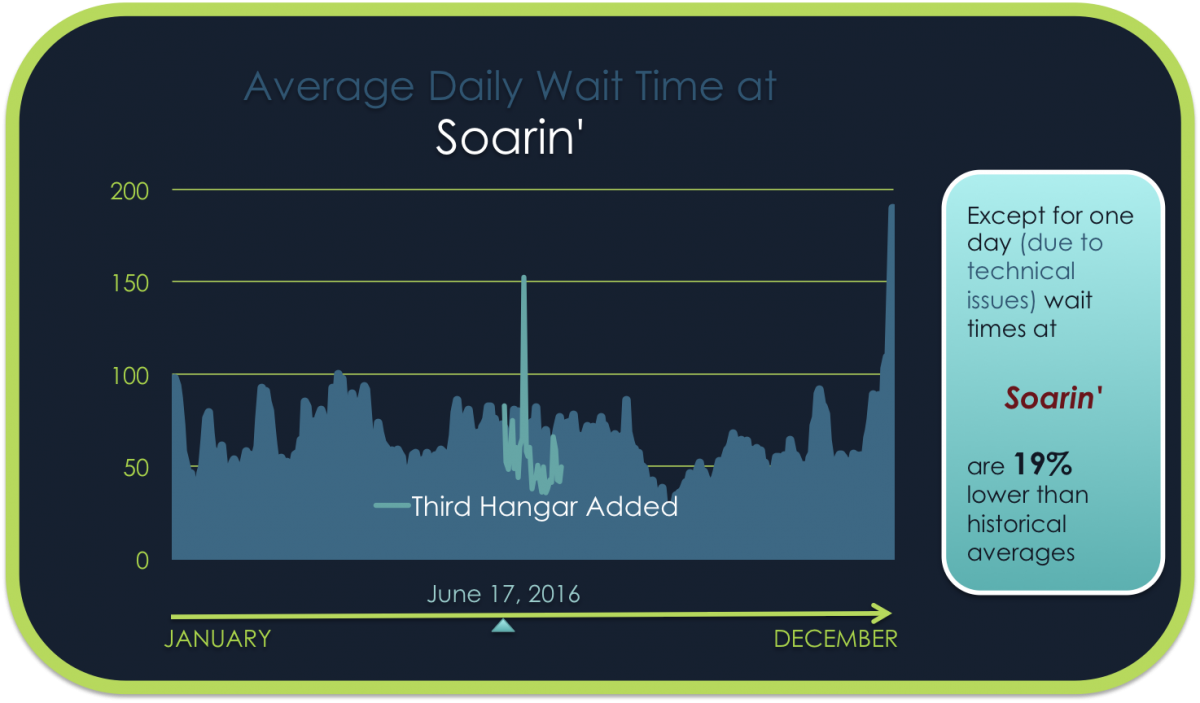
Two of Walt Disney World’s most popular attractions recently went through significant changes to their capacity. Toy Story Midway Mania added a third track on May 25, 2016 and Soarin’ re-opened on June 17, 2016 after a long refurbishment to add a third hanger and present a new film. An increase in capacity should lower the average standby wait at these super headliners, now that we have at least a month of collected wait times for both, let’s take a look to see if the average wait times have changed.

First, let’s get a baseline for how wait times are doing in general compared to historical averages across all Walt Disney World Attractions. Here is the average daily wait time across all attractions since 2009. Since May 25th, 2016 the average daily wait time remains almost unchanged, down about 1%. Sure, the sample size is not large but we can be fairly certain that any change in the average daily wait time at Toy Story Midway Mania and Soarin’ would be due to the capacity changes, not to a significant drop in overall attendance. It is also helpful that we are comparing a time of year that is historically very similar year over year. Late Spring and early Summer have only two holidays, Memorial Day and July 4th, both of which have similar crowd patterns each year.

Except for an initial spike in wait times shortly after re-opening, Toy Story Midway Mania wait times are way down compared to years past. There we see a 38% percent reduction in the average daily wait time since May 25th, 2016 when the third track began entertaining guests. Toy Story Midway Mania is still the most popular attraction at Disney Hollywood Studios but the extra track helps relieve pressure on the standby queue for those guests unable to obtain a Fastpass+ reservation. Historically, it would not be unusual to see Toy Story Midway Mania hit a peak wait time of 100 minutes or more, even on an average day. Now, that peak is more likely to be 70 to 80 minutes or less.

At Soarin’ we see about a 19% dip in the average daily wait time. We can assume that the new film for Soarin’ is attracting more guests than that attraction would normally see and those additional guests will offset some of the gains in capacity. So, the 19% dip in the average daily wait time is quite significant, probably equivalent to what we see at Toy Story Midway Mania. That 19% average decline is also influenced by a significant spike in the average wait in late June when the attraction experienced some mechanical problems and the wait time was artificially high.


Now if they could only add a third track to Space Mountain
Is there any info on FPP distribution being taken into account here? Theoretically they could have increased FPP distribution by 1/3 at each ride and still seen about a 1/3 reduction in waits given the same attendance, but altering the distribution by some other amount would have a definite impact on the numbers above.
I’d like to think that in addition to 1/3 shorter waits there is also 1/3 better FPP availability.
I’ve also heard that Soarin’ Around The World is a little shorter than the original. Has that had an impact as well?
Soarin’ over California is 4m51s long. Soarin’ Around the World is 4m45s long. The fact that the latter is 6s shorter is probably lost in the noise.
For those of us who would only use FPP or ride these rides first thing in the morning, a standby reduction doesn’t help much and theoretically is somewhat worse, since the fewer people in line at these rides mean more in other areas of the park (probably not a noticeable impact).
I’m not bemoaning the change, because it’s still good for the parks overall, but I suspect most of us won’t be much helped unless it also shortens the FPP availability – will it impact that at all?
Following your logic I do not think this would push “more” people out of the line and into the park – MORE people move through the lines FASTER, the key being it is still MORE people in the lines to begin with…assuming people are more likely to get in a shorter line AND that the # of FPP distributed has gone up…I would think a zero net impact would be seen?
Assuming that all three tracks/hangers are running all day, all other things being equal a reduction of time of about a third (33%) would represent no change in the amount riders in line at the attraction.
I don’t know the underlying statistics, but between measurement variation and the slight reduction in attendance, the 38% reduction at Toy Story Mania should have no little to no affect on the number of guests elsewhere in the park. On the other hand, Soarin’ is only seeing a 19% reduction, so there should be LESS people in other areas of Epcot.
Ha. I was focused on the drop in wait time, forgetting the cause of it. You’re right…it is a good assumption that there will be as many or more people still in those lines, so there should be no negative impact.
I am hopeful they choose to keep all 3 tracks running as well as all hangars running rather than shutting them down / not running @ full capacity during lighter crowds (do those really even exist anymore?)… Any thought or predictions on this? I know they do t run at full capacity on other rides during lower crowd days essentially making lower crowd days wait times consistent with moderately high crowd days… 🙁