
Disney Data Dump June 7 2023
Anyone else feel like you can finally breathe a sigh of relief now that the school year is over with all of its events and obligations? Just me? That’s cool too. We’re finally hitting the point in the calendar year where most school districts are on their summer breaks. That means a more steady stream of families with time off and the ability to head down to Orlando. At the same time, we’re seeing increasing afternoon storms and weather-related downtime, which can drive wait times up. All of this should mean greatly increasing wait times – but what does the data show us is actually happening?
Observed Crowd Levels 5/30 – 6/5

Well this is a fun and tricky graph! What is it saying to us? Ah, crowds are relaxing back to late-spring levels … here they go … crowds disappearing. Bam! Just kidding! It’s been a long time since we’ve seen a crowd level 7 or higher day. It’ll be interesting to see if this was a weather-related blip or if crowds will stay at these slightly elevated levels.

Magic Kingdom was the big driver of the overall trend here, starting the week at an 8, steadily declining all of the way to a 2, and then immediately hopping up to an 8 again! Those are some big differences in wait times depending on which day you decided to visit. Other parks stayed a little more stable, but Animal Kingdom was the big outlier on Monday the 5th, with every other park shooting up to a crowd level 8.

Each week, I’m giving you a very transparent look into how our crowd level predictions performed. Each day at each park is one data point, so this week we have 28 different crowd level predictions to evaluate each week. Any time a prediction is within one or two crowd levels, things won’t really “feel” much different than what we predicted. Being off by 3 or more crowd levels is where we’d like to be more accurate because you might feel that difference in wait times throughout the day.
In the past week, Touring Plans predictions were either spot-on or within 1 crowd level 46% of the time. That’s the highest that number has been in about 5 weeks. 75% of the time Touring Plans predictions were within 2 crowd levels, and that means we earn a solid C for our predictions this past week. Much better than the last 3 weeks. And predictions were finally somewhat less skewed than we’ve been seeing. Still, only three park days were under-estimated by two crowd levels – and they were all at Magic Kingdom. The biggest miss of the past week over-predicted crowds by 5 crowd levels. That happened twice, both times at Hollywood Studios, when Touring Plans predicted crowd level 9, and it ended up being a crowd level 4 day.
Attraction Downtime 5/30 – 6/5
If we average out all of the capacity lost due to unexpected downtime over the past week, it comes out to 3.9% of attractions unexpectedly being down. Exactly the same as last week! The park with the biggest issues was Hollywood Studios, with 5.6% of its capacity lost due to unexpected downtime. Animal Kingdom was close behind with 5.1% downtime for the week.
The worst day for attraction downtime in the past week was on May 30th. On that day, 7% of all capacity at WDW was lost due to unexpected downtime. The worst park-day of the week was at Hollywood Studios on May 30th. On that park day, 14% of the capacity at the park was lost due to unexpected downtime. Hollywood Studios was open for 13 hours on the 30th, so 14% downtime is the equivalent of the whole park being down for almost 110 minutes. That’s a LOT of downtime.
Attraction Downtime
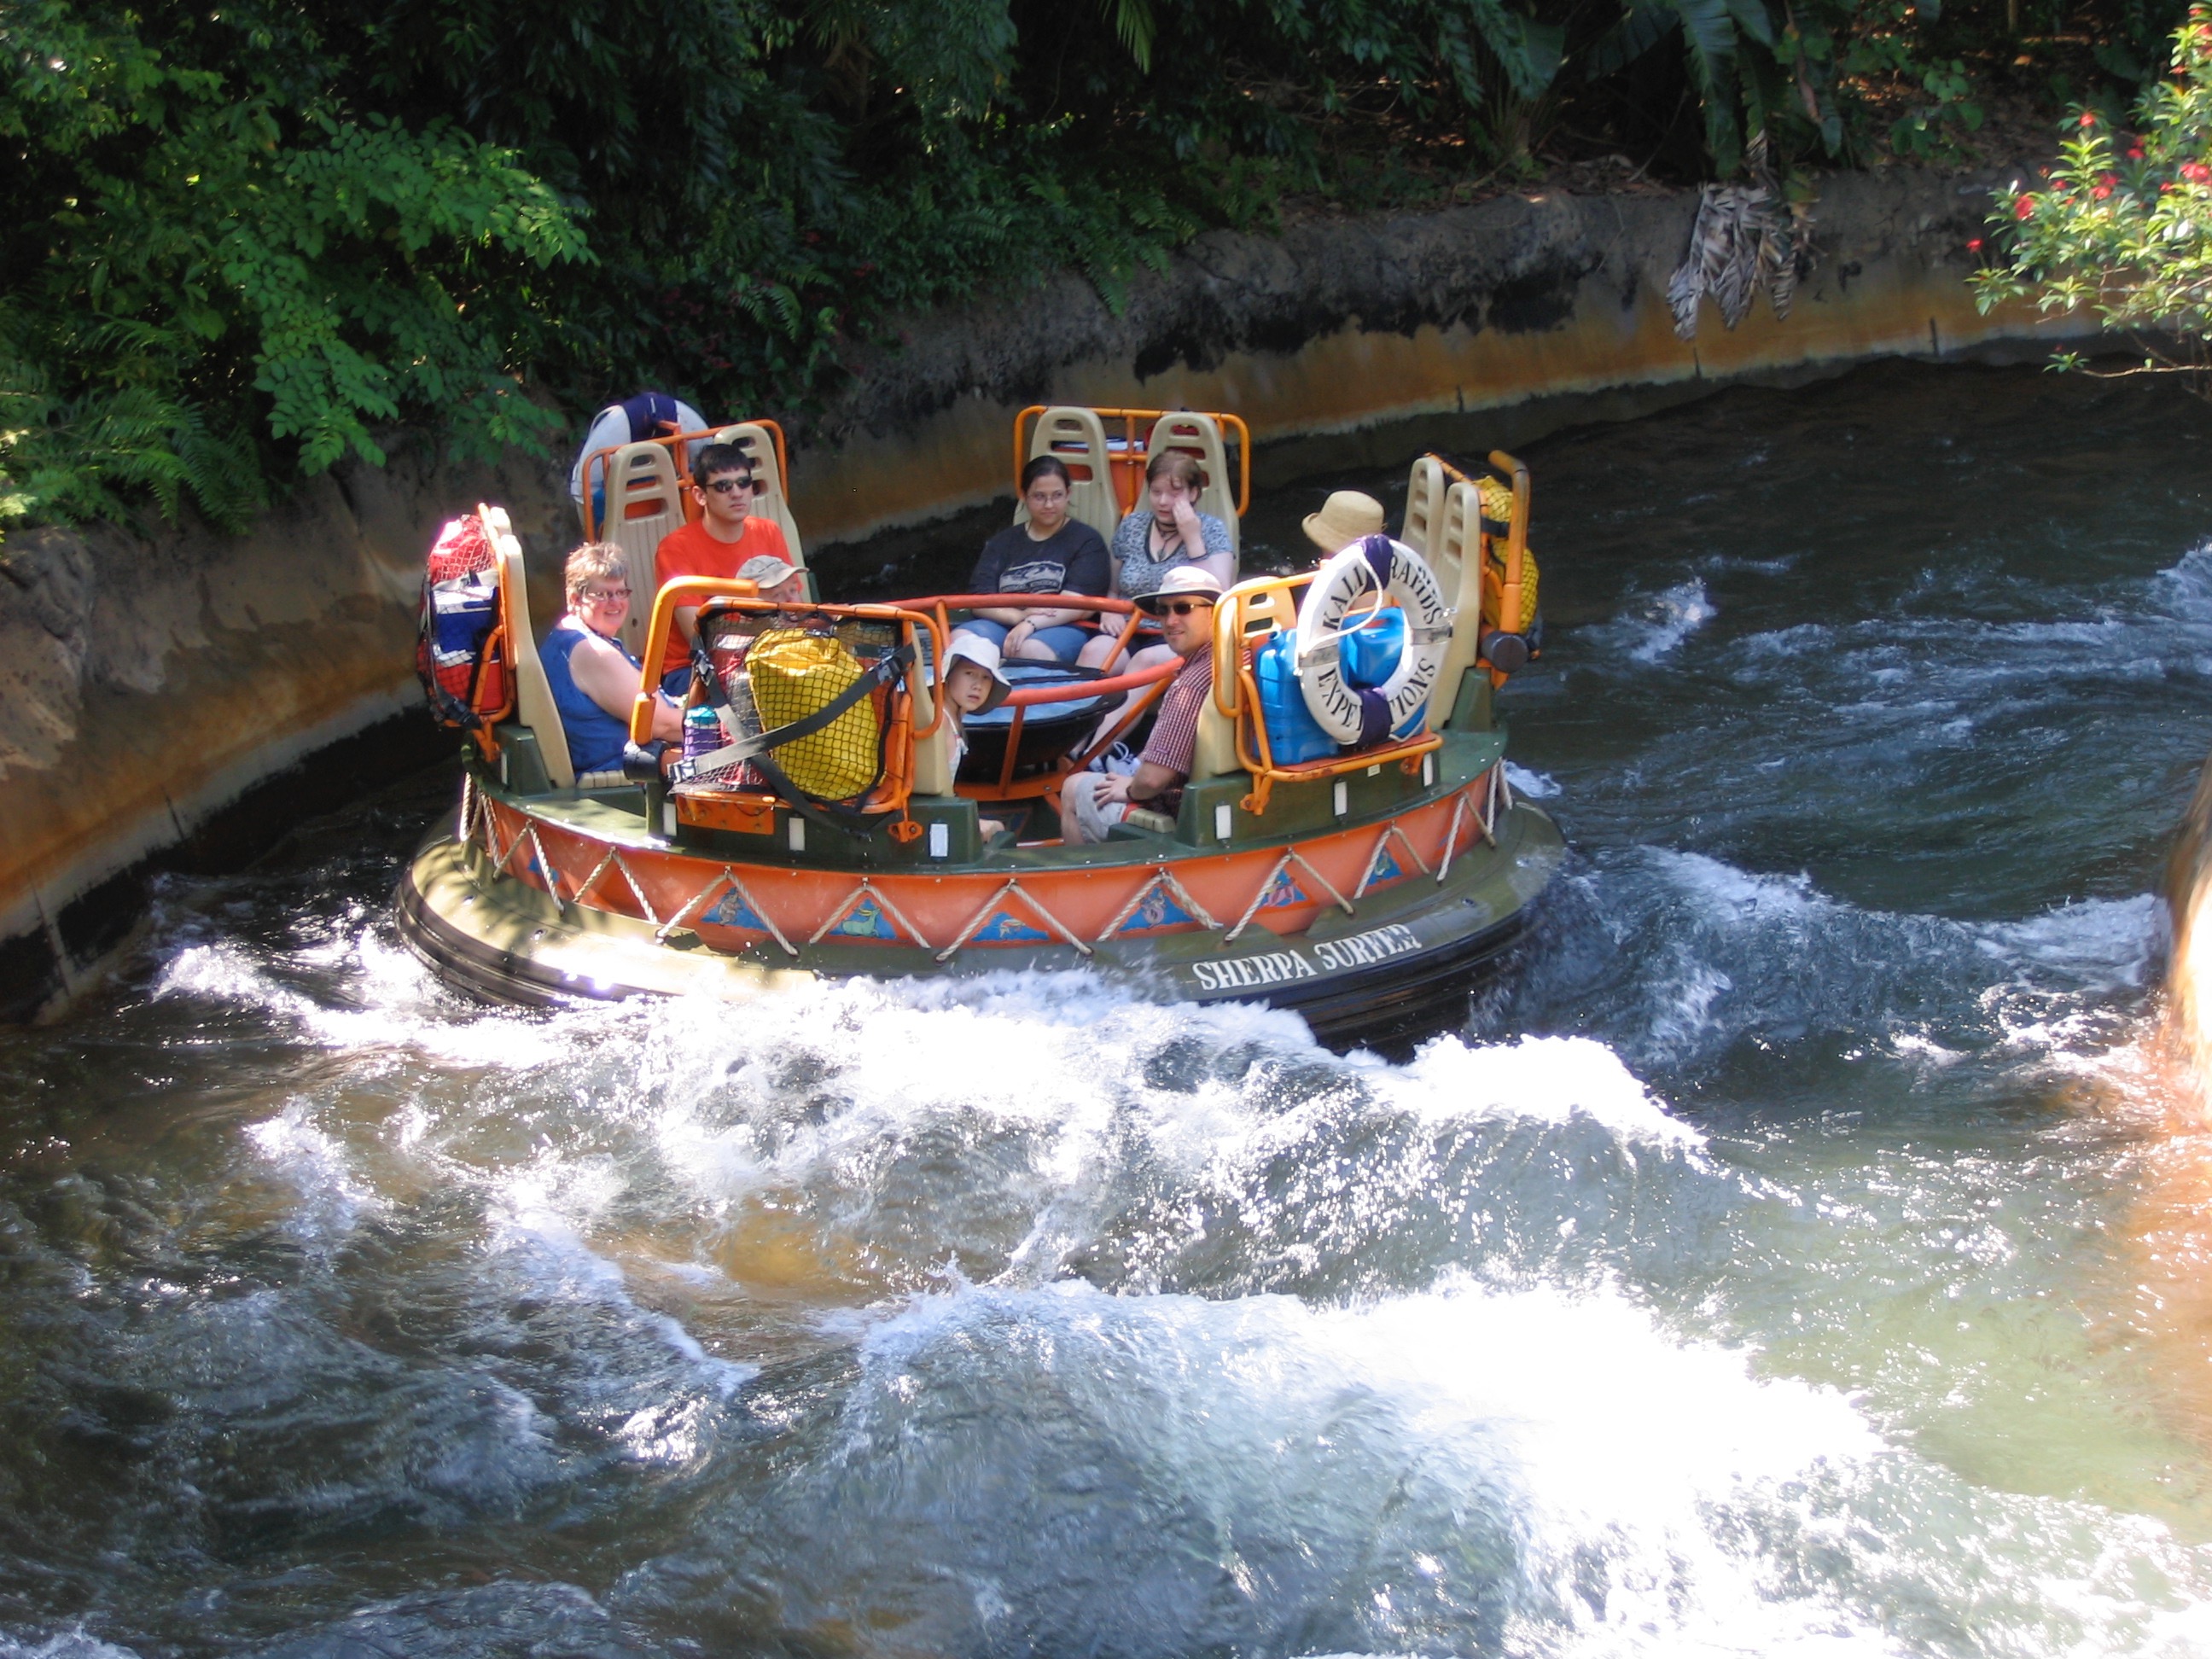
The worst offender of the past week was Kali River Rapids, which was unexpectedly down for approximately 20% of the past week. The worst day for Kali River Rapids was on May 31st, when it was unexpectedly down for 37% of the day. In general, this attraction has been struggling to wake up in the morning, including on the 31st.
Rope Drop Downtime
Here are this week’s problematic offenders:
- Magic Kingdom: Pirates of the Caribbean (unavailable for 27% of its first hour of the day), TTA PeopleMover (unavailable for 19% of its first hour of the day), Under the Sea (unavailable for 16% of its first hour of the day), Buzz Lightyear’s Space Ranger Spin (unavailable for 16% of its first hour of the day)
- EPCOT: Frozen Ever After (unavailable for 16% of its first hour of the day)
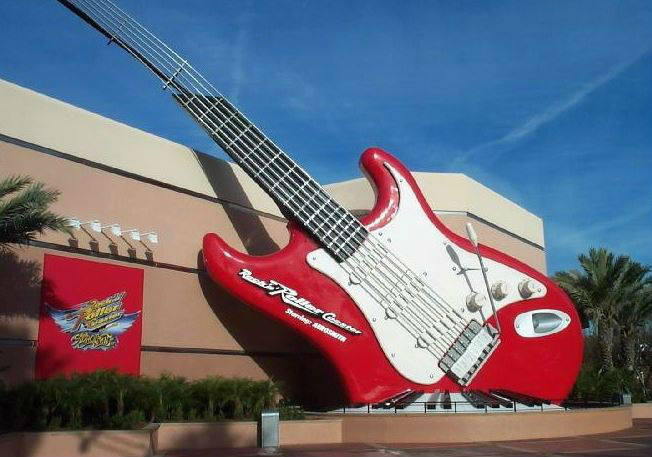
- Hollywood Studios: Rock’n’Roller Coaster (unavailable for 29% of its first hour of the day), Slinky Dog Dash (unavailable for 22% of its first hour of the day), Rise of the Resistance (unavailable for 17% of its first hour of the day)
- Animal Kingdom: Kali River Rapids (unavailable for 34% of its first hour of the day)
This was a remarkably rough week for rope drop downtime, especially at Hollywood Studios, with Slinky Dog Dash and Rise of the Resistance both down around 20% of the time. Magic Kingdom had its share of problems too, and we even have a rare week with Animal Kingdom showing up on the list.
Wait Times 5/30 – 6/5
Attractions with the Highest Average Posted Wait at each park
- Hollywood Studios: Slinky Dog Dash, average posted wait of 90 minutes (77 minutes last week)
- Animal Kingdom: Flight of Passage, average posted wait time of 82 minutes (87 minutes last week)
- EPCOT: Frozen Ever After, average posted wait time of 67 minutes (61 minutes last week)
- Magic Kingdom: Seven Dwarfs Mine Train, average posted wait time of 80 minutes (74 minutes last week)
We’ve got some interesting behavior in the posted wait time data this week, with most attractions weeing roughly 10% increase in their posted wait times, but Slinky Dog Dash going up by much more than that, and Flight of Passage actually decreasing!
Parks with the Highest and Lowest Average Wait
These parks likely won’t change week-to-week unless something ridiculous happens, but these data points will give us a high-level view of how wait times are trending from week to week.
- Highest: Hollywood Studios, average park-wide posted wait of 39 minutes (35 minutes last week)
- Lowest: EPCOT, average park-wide posted wait of 25.5 minutes (23 minutes last week)
Hollywood Studios has seen its average posted wait time go up by 50% over the past two weeks. That’s a huge shift not necessarily well-captured by the crowd level trends. Most of the other parks haven’t seen that kind of a remarkable increase – EPCOT’s average has only gone up by 20% in the same two weeks.
Actual Wait Time Rock Star
The Actual Wait Time Rock Star for the past week was … passesforsix, who submitted 48 actual wait times through the Lines App over the last 7 days! This includes 10 Lightning Lane waits, 30 Standby waits, 4 single rider waits and 4 virtual queue waits. Thank you for all of that timing, passesforsix! You came pretty close to the all-time record of 50 recorded waits times in a single week, currently held by shop.kgb and ccsademko.
Looking Ahead: June 6th through June 12th
It takes some time to crunch all of the numbers, so when you’re reading this article, June 6th will already be in the past. But we’re trying to stay as timely as possible. So let’s get along with our future-casting.
We’re starting to settle into an early summer pattern of what should be some predictably moderate crowd levels, usually in the 6 or 7 range. There are no special events in the upcoming week, other than the regular extended evening theme park hours, and now the addition of H20 Glow nights.
We’re also starting to settle in to the pattern of afternoon thunderstorms in the Orlando area, which is having an impact on downtime, crowd patterns, and wait times. If you’re headed to the parks this week, be prepared with ponchos and umbrellas so that you can wait out the rain when everyone else gets scared and heads out!
You May Also Like...
-

In the world of Disney Data, this week was all good news. Wait times were the lowest we've seen since mid-September…
-

Just when you think we've made it through Spring Break season! The weather is getting warmer. The kids are getting antsy…
-

Anyone else ready for summer? If nothing else, we need something to shake up these Disney Data Dumps that have become…
-

What a busy week we've all had! May the Fourth, Cinco de Mayo, Revenge of the Fifth. Also important holidays like…
“with most attractions weeing roughly 10% increase in their posted wait times” Weeing?
I mean … it’s funnier that way 🙂 I’ll go scold my blog editor.