Disney Data Dump: What’s the Best Day of the Week to Visit the Magic Kingdom?
Len’s Large Data Law, which I just made up, says that with enough data the answer to every question starts with “It depends.” Keeping that in mind, let’s add to Becky’s Disney Data Dump column this week to do a way-too-deep dive into the question of whether there’s a best or worst day of the week to visit the Magic Kingdom.
The data: 22 million wait times since 2015
To do this analysis we’ll be looking at a dataset of 22,224,000 wait times we’ve collected in the Magic Kingdom since January 1, 2015, from every attraction in the park, every few minutes, from park opening to park closing.
The data includes posted wait times (the times Disney displays on a sign at each ride’s entrance) and actual wait times, which the TouringPlans community submits after timing their wait in line using our Lines app. We’ll focus on posted wait times to keep things simple.
The analysis process
We want to answer two questions:
- Are wait times different on different days of the week?
- Is any difference we might see just the result of random chance?
We collect wait times from every ride every few minutes of every day. And suppose we see that Monday’s average wait time is 32 minutes and Tuesday’s is 33 minutes. Sure, those are different, but we want to know whether that’s a real trend or just random noise from a few unlucky breaks on a couple of Tuesdays. We need to do some math to figure that out. Here’s how we did that analysis.
Step 1: Do the wait times look like a bell curve? Lots of statistical tests assume that the data we’ve got forms a bell curve, with a big peak in the middle that tapers off evenly on the right and left sides.
You’re probably already saying “wait times don’t work like that” and you’re right. For one thing, wait times can’t go below zero but can get into the 200 to 300 minute range. So the curve is probably lopsided to the right. And sure enough, it looks like that:
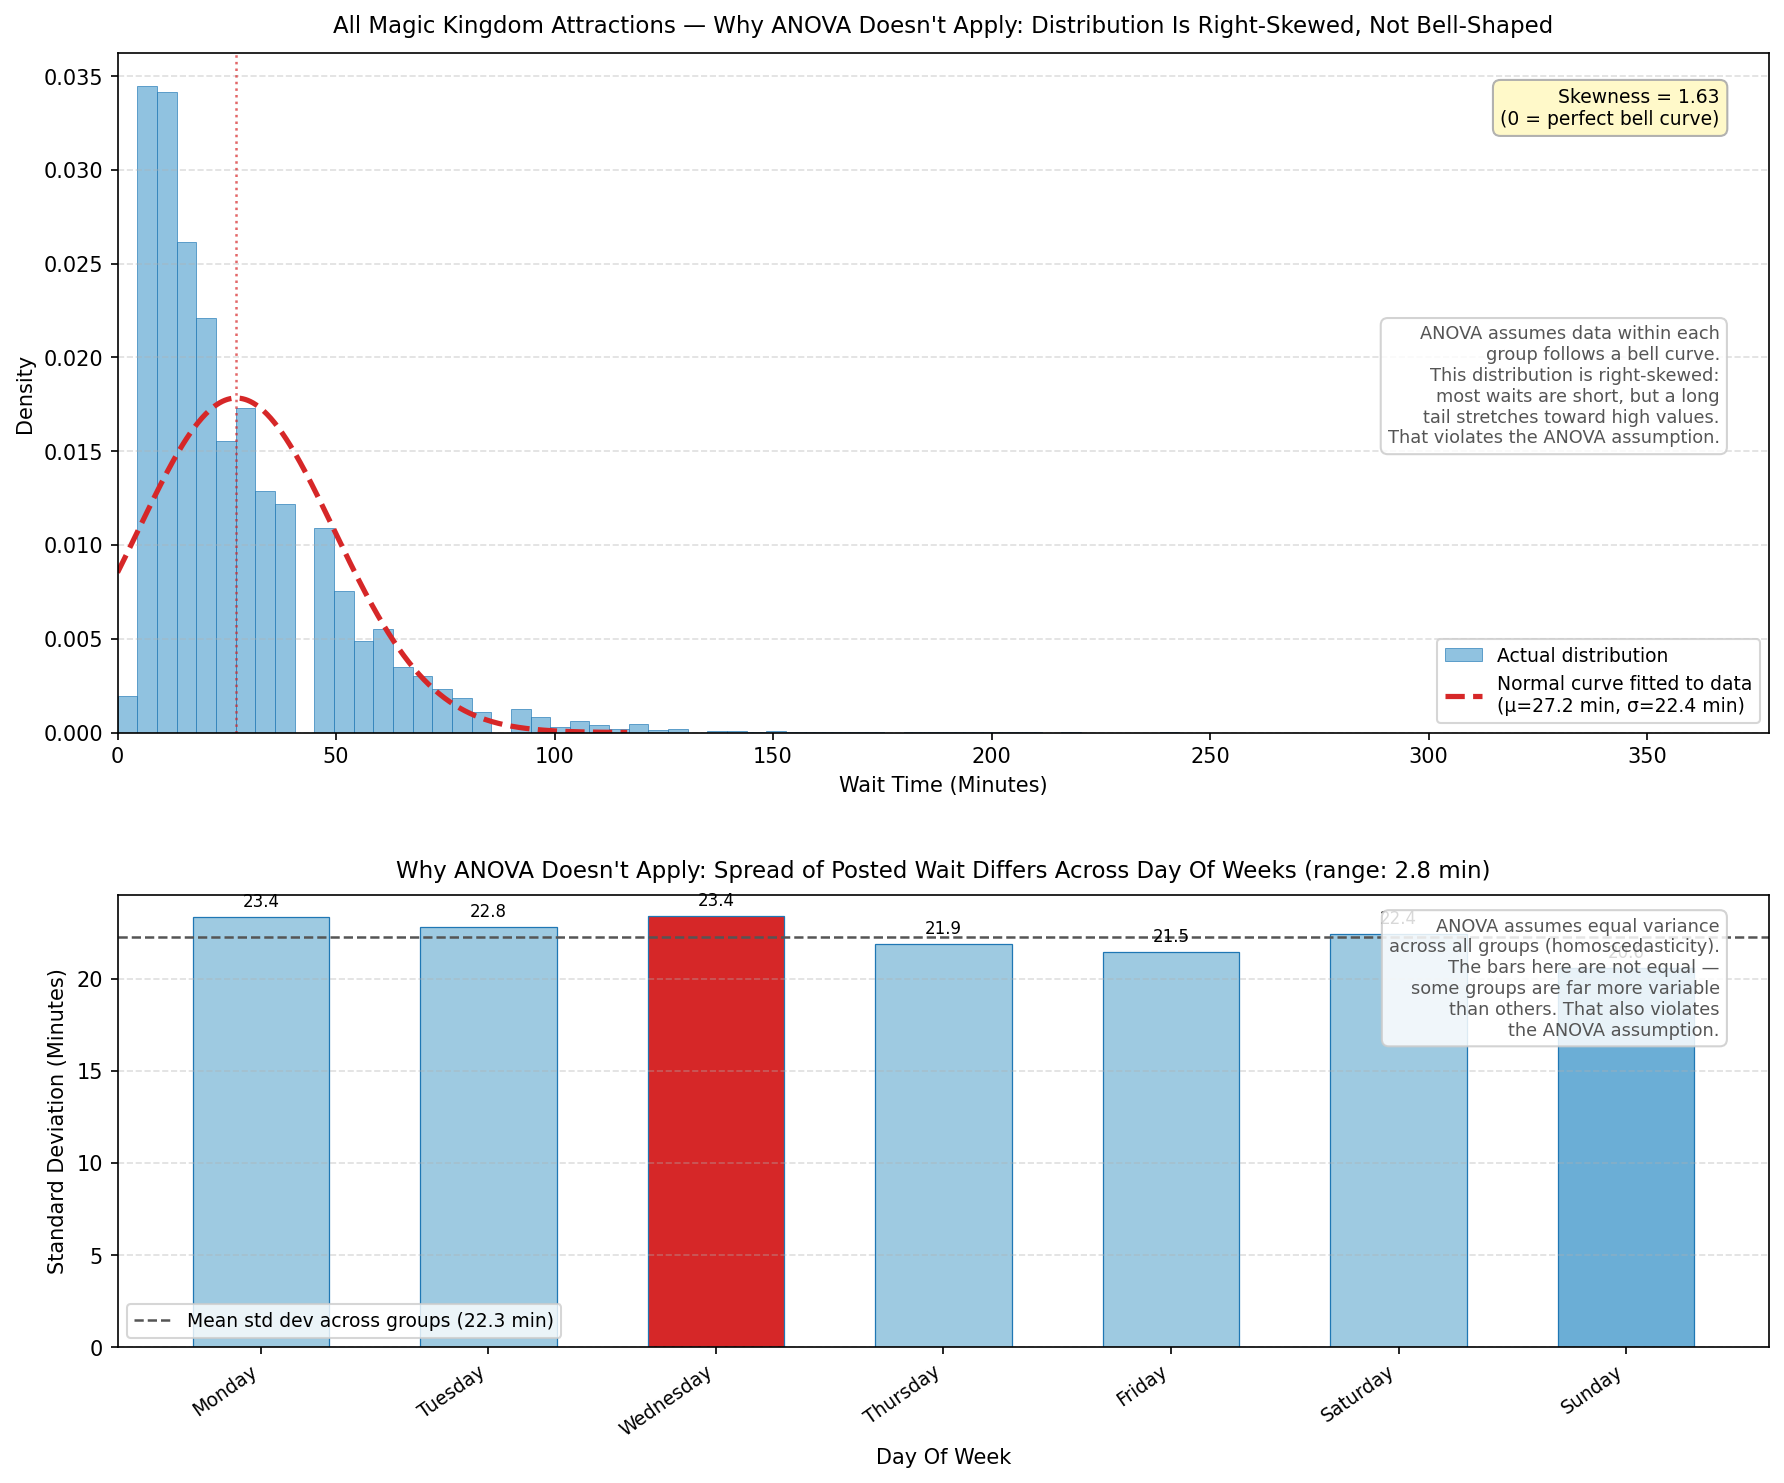
Step 2: Is each day’s range of wait times the same? Let’s say each day of the week has a different average wait time. To do an accurate comparison we still need to know if the range of wait times is similar across all days.
For example, suppose Monday’s average waits are always pretty consistent, say between 20 and 45 minutes, and average out to 32 minutes overall. But Tuesday’s waits are all over the place, ranging from 5 minutes to 180 minutes, that average out to 33 minutes. Sure, Monday’s average of 32 minutes is really close to Tuesday’s average of 33 minutes, but the wide variety in Tuesday’s data tells us Tuesday is fundamentally different from Monday. We’ll use Levene’s Test to determine if each day’s data is spread out the same.
Step 3: The Kruskal-Wallis test Spoiler alert: the data don’t look like a bell curve and each day’s data has a different spread. That means we can’t use ANOVA – the default starting point for this sort of analysis.
But don’t worry – there’s still a way to test if the days are different using something called the Kruskal-Wallis test, which converts each wait time to a rank starting with the number 1 for the single shortest wait time we observed, going up to 22,224,000 for the single highest wait time we’ve got. The result of the Kruskal-Wallis test will tell us if something’s different across any of the 7 days of the week.
Step 4: Dunn’s Test The Kruskal-Wallis test tells us whether there’s a difference between any day of the week. But it doesn’t tell us which days of the week are different. For that we use Dunn’s Test, which tests every pair of days against each other. There are 7 days of the week, and we compare each day to the other 6. That means there’s 7 x 6 = 42 tests to perform, but comparing Monday and Tuesday is the same as comparing Tuesday and Monday, so there’s really only half as many tests – 21 of them – to run.
This is the point in the post where my wife Laurel, who’s doing a Masters in statistics at Columbia, would say “Baby, schnookums, love of my life … if you run 21 tests there’s decent odds some of them are gonna say they’re different just by random chance. Like if you flipped a fair coin enough times there’s decent odds you’ll see tails,tails,tails,tails,tails,tails,tails, and tails come up at some point.”
Laurel’s right, of course, so we use the False Discovery Rate test to check for that possibility.
That gives us enough tools to start digging into the data. Those of you who want to see the test output can find the reports here. (And yes, I already know I’m not the smart one or the pretty one in my relationship with Laurel. When Laurel starts asking about things like heteroscedasticity I bat my eyes and ask if I can get her a snack.)
Analysis #1: All the attractions, all the time
Let’s start by looking at wait times by day of week for every ride in the Magic Kingdom that’s ever had a posted wait time in My Disney Experience. Here’s the graph:
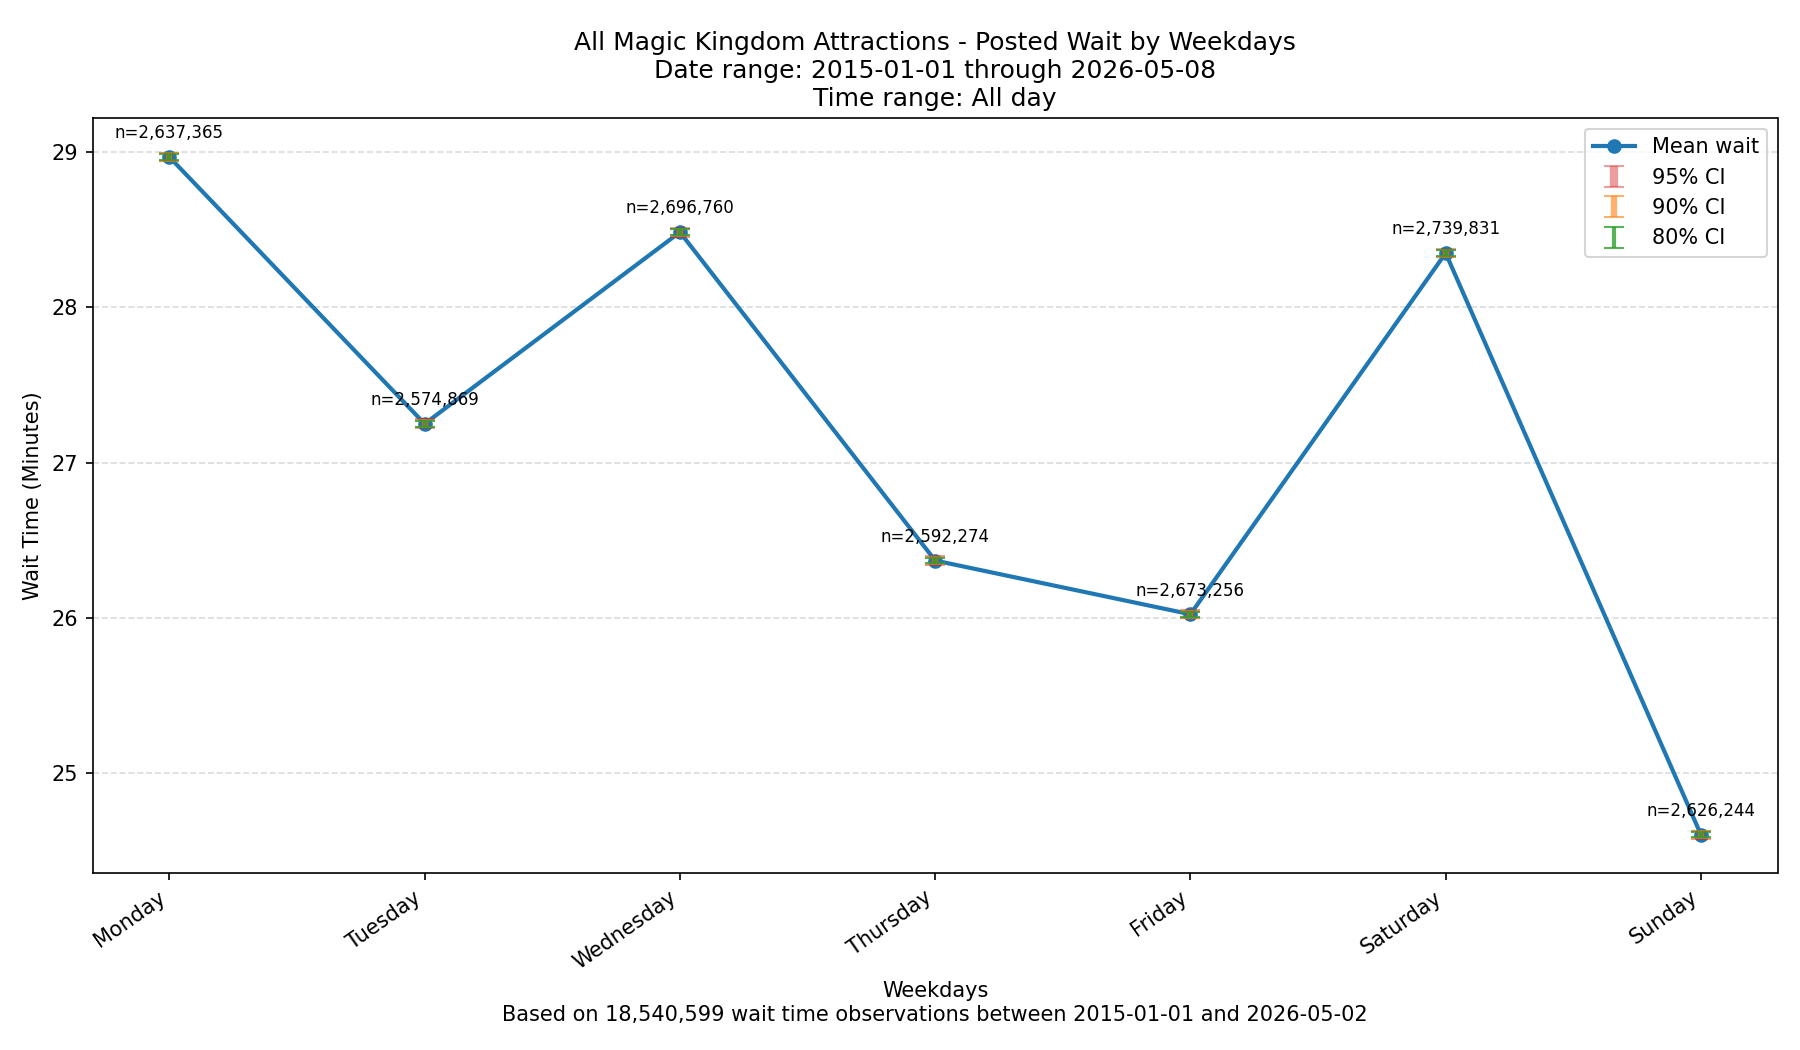
That initial analysis gives us this ranking of weekdays from lowest posted waits to highest:
- Sunday’s the day with the lowest posted wait times, averaging ~24.5 minutes
- Friday’s posted waits average ~26.0 minutes
- Thursday’s posted waits average ~26.4 minutes
- Tuesday’s posted waits average ~27.3 minutes
- Saturday’s posted waits average ~28.4 minutes
- Wednesday’s posted waits average ~28.5 minutes
- Monday’s the day with the highest average posted waits, just under 29.0 minutes
It’s interesting that Sunday’s got the lowest average wait times. The Bureau of Labor Statistics says Sunday is the least busy day for leisure travel, so it’s not that people are headed to or from the parks. So there might be something going on with Sundays that merits more investigation. Monday kind of makes sense, since Monday is the most common day for federal holidays in the US.
It’s hard to read on those graphs, but each day of the week has confidence intervals for 80, 90, and 95% confidence levels. And they’re really tight, as you’d expect with that much data to look at.
Here’s the same data as a color-coded matrix. Read it row by row and left to right:
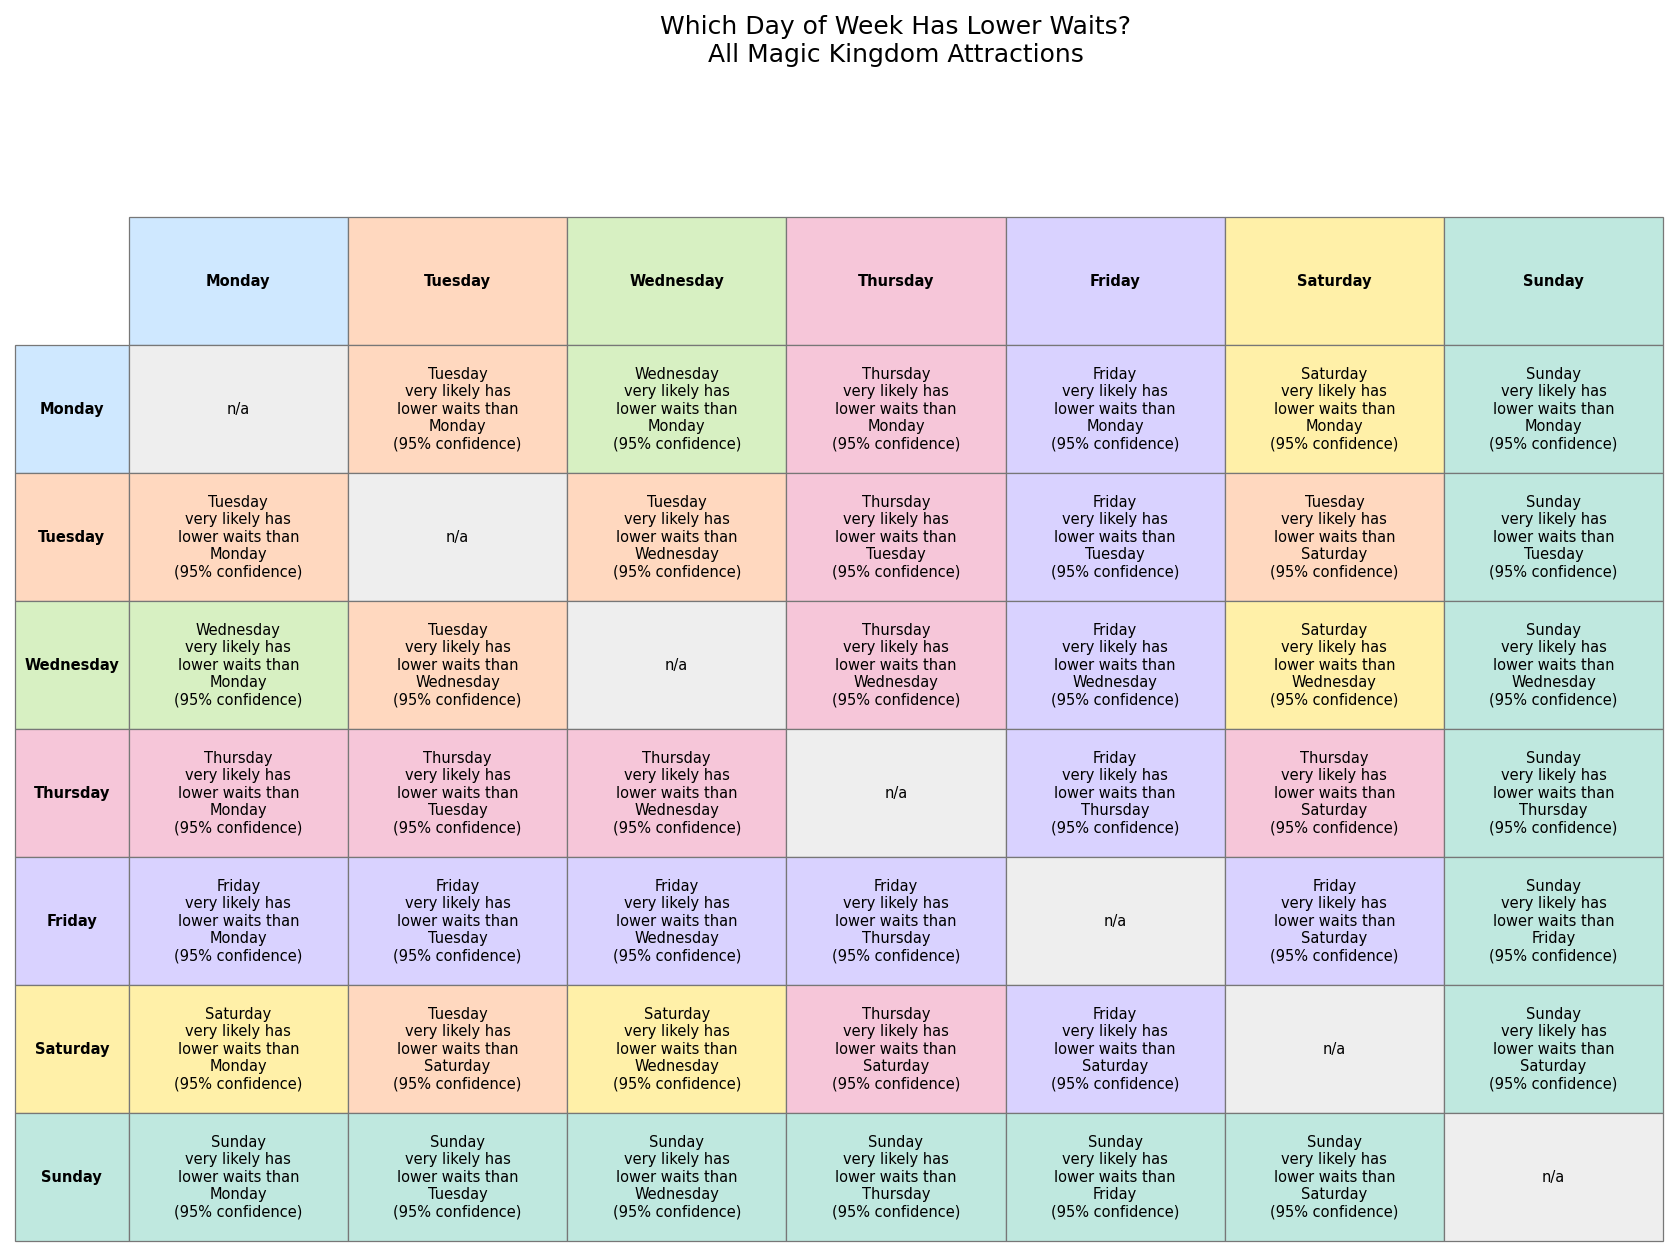
I mean, there’s just not a lot of difference between some of these days: average wait times for Friday and Thursday are separated by about 24 seconds, and Saturday and Wednesday by about 6 seconds. Even over 20 attractions that’s barely enough time to re-tie your shoes. Is there a way we can filter the data to see more separation? Let’s give it a shot.
Analysis #2: Only popular rides, all the time
Some less popular Magic Kingdom attractions have wait time signs, even though the posted wait times rarely change. The average posted wait at Swiss Family Treehouse, for example, is between 5 and 6 minutes over almost any time period you look at.
That means Swiss Family Treehouse doesn’t contribute much information about crowds – in fact, keeping Swiss Family Treehouse’s data tends to bring each day’s average waits closer together (and lower), making the differences between days harder to see.
Let’s re-do our analysis and remove all the attractions with near-constant posted wait times. This includes things like the Treehouse, Enchanted Tiki Room, Country Bear Jamboree, the Peoplemover, the Walt Disney World Railroad’s three stops, secondary character greetings, and the like. What’s left is the Magic Kingdom’s most popular rides.
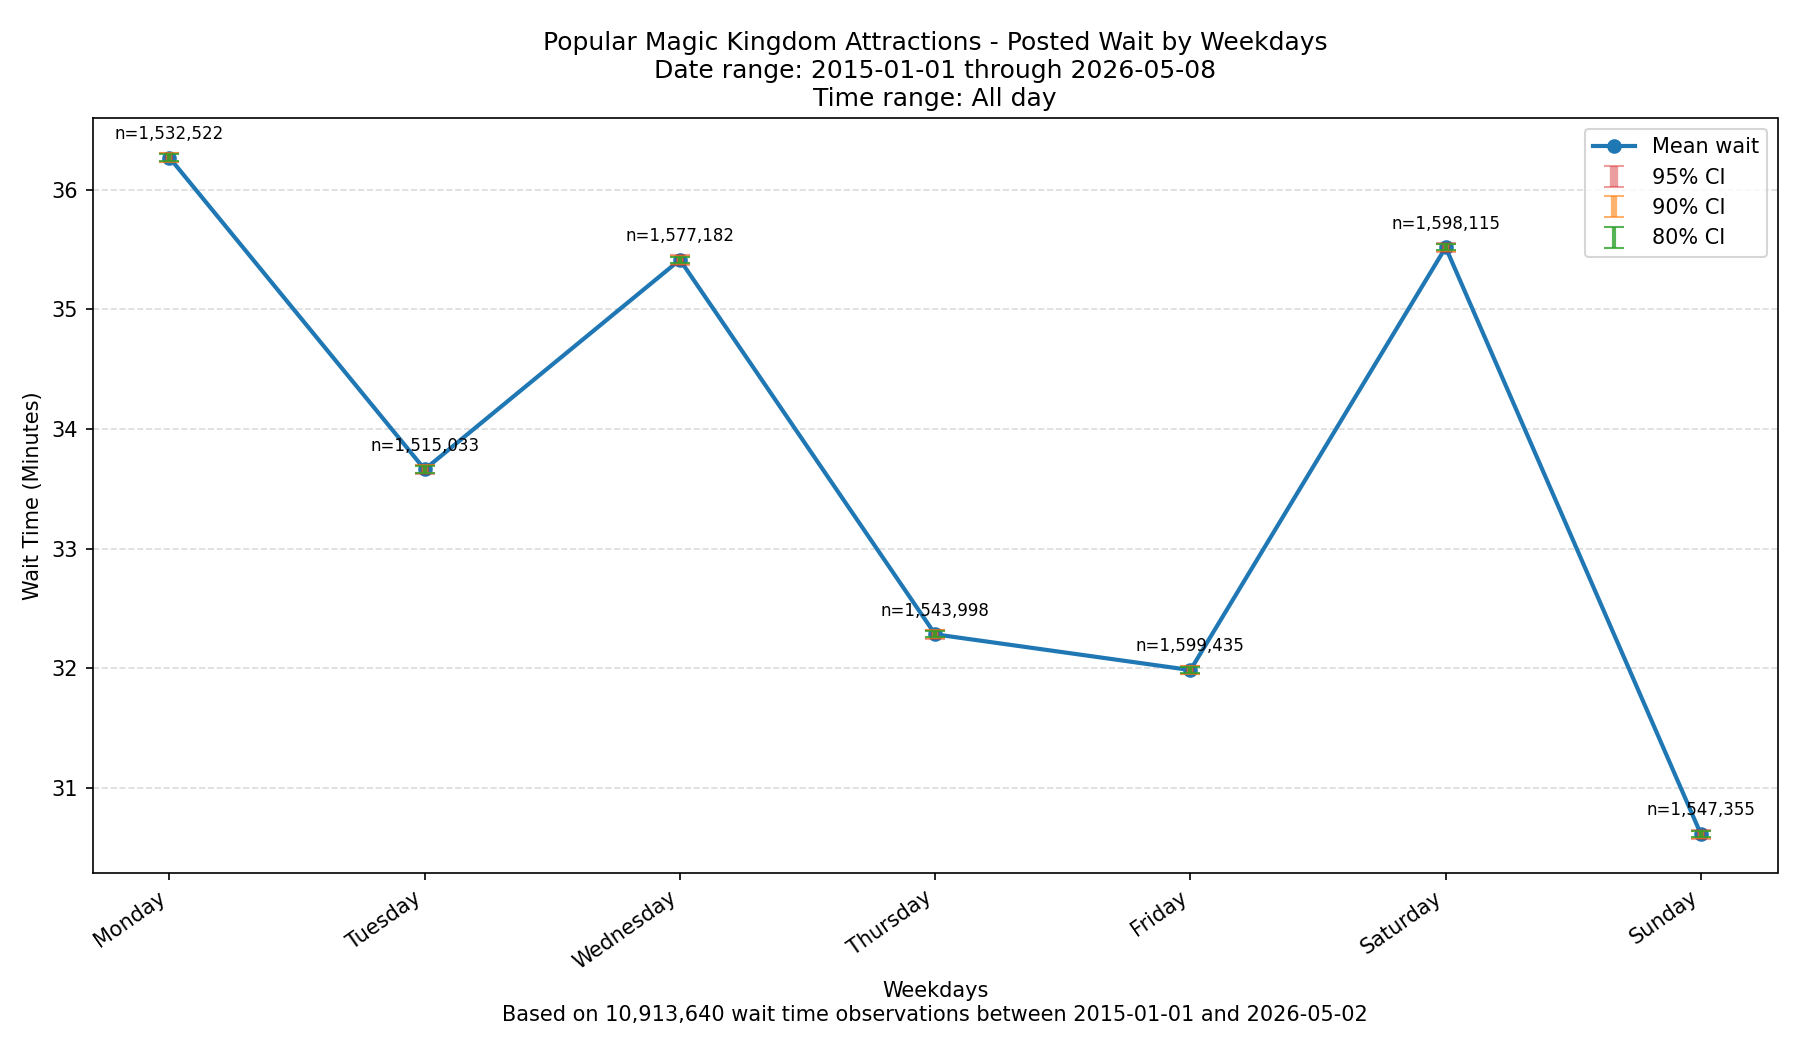
Here’s what the weekday wait times look like for just the Magic Kingdom’s most popular rides:
And here’s the matrix:
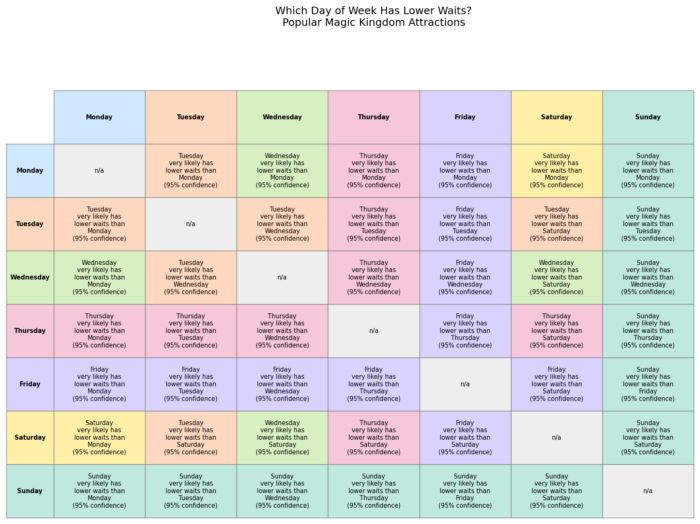
We get the exact same day-of-week rankings for this core group of attractions as we did for all Magic Kingdom attractions. That’s encouraging. But we still don’t have a lot of separation between some pairs of weekdays.
I mean, sure, Friday’s average posted wait is ~32.0 minutes and Thursday’s is like ~32.3 minutes. But would you tell someone to change the date of their visit over 18 seconds per ride? Probably not – there’s way more important things to consider, like needing a day of rest.
What else can we look at? I’m glad you asked.
Analysis #3: Only popular rides at peak hours
As hard as it is to believe, some folks like to sleep in on their Disney World vacation. It’s times like this when it’s helpful to remember that the Magic Kingdom’s dedication plaque has the words “to all who come to this happy place…”, not “to rope-droppers who come to this happy place…” Remind me to tell you about the time my twin sister Linda said before a day in EPCOT “Sleeping in culls the weak from the herd.” Linda’s the competitive one in the family.
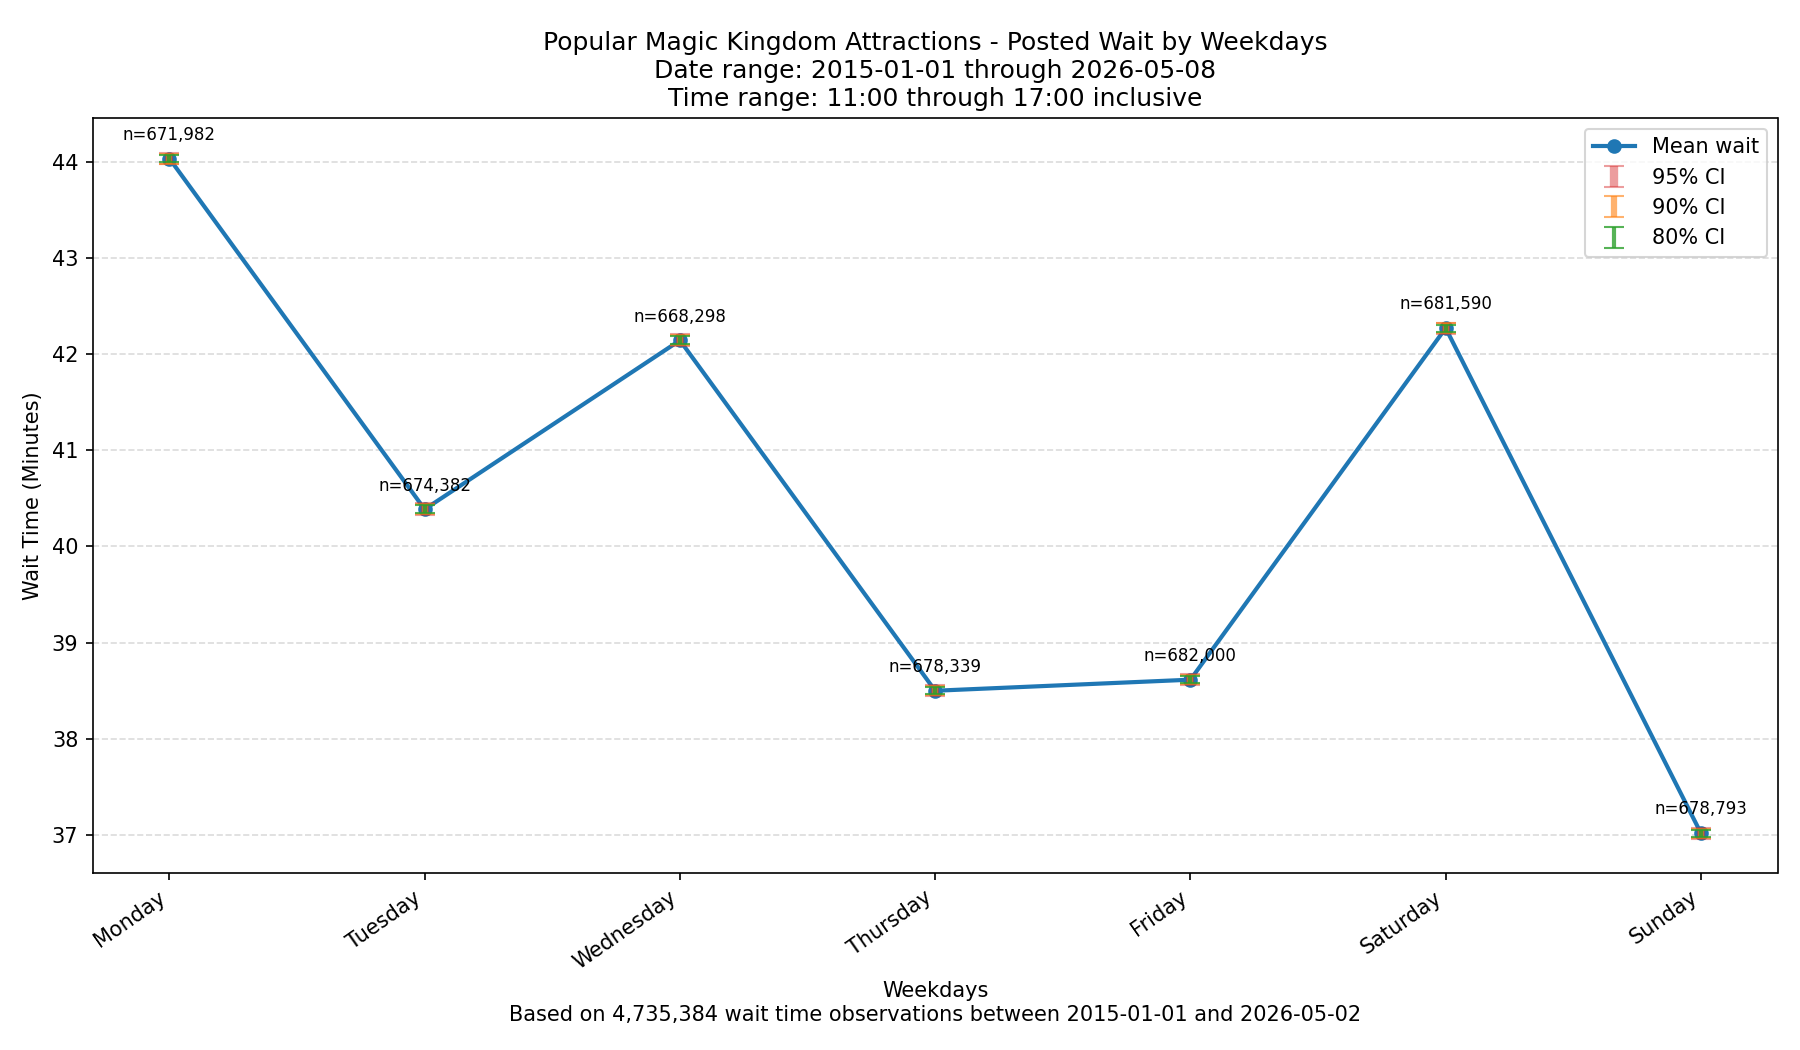
Peak crowds form at the Magic Kingdom between 11 am and 5 pm. After that is when lots of folks start to think about getting some rest, eating dinner and going to bed. Let’s restrict the data to the same set of Magic Kingdom popular rides, between 11 am and 5 pm, to see if there’s any difference between days of the week.
Here’s the chart:
and here’s the matrix:
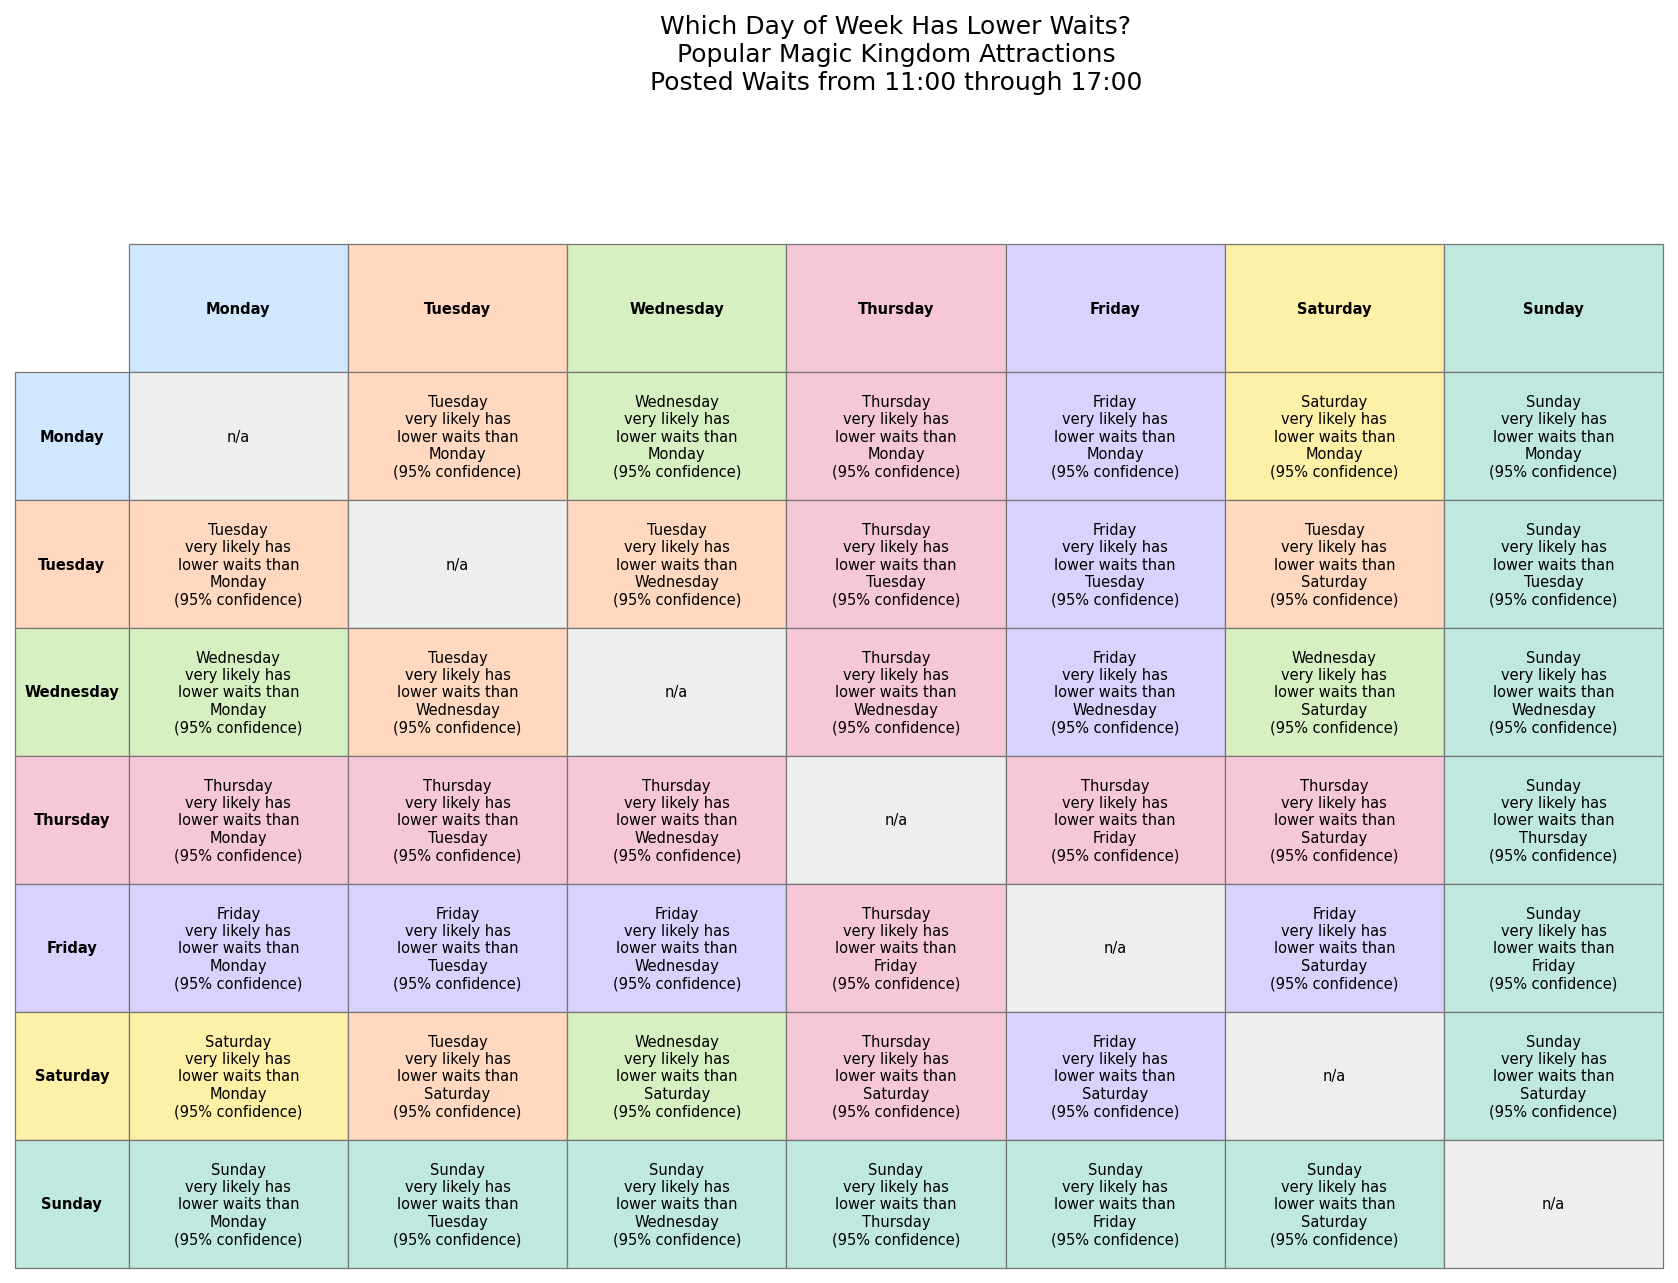
For the second time we get the exact same day-of-week rankings for this core group of attractions at mid-day as we did for all Magic Kingdom attractions and the core group over all day. That’s even more encouraging.
Are we done? Of course not!
I know what you’re thinking: “Len,” you say, “didn’t posted wait time averages change significantly when Disney updated its Disability Access Service (DAS) eligibility rules back in 2024?” And yes, they did – Disney World wait times for Christmas 2024 were 13-22% lower for Christmas 2024 as compared to Christmas 2023, with roughly the same number of people in the parks.
Do the DAS changes change our best-days-of-the-week recommendations? There’s one way to find out.
Analysis #4: Only popular rides at peak hours after DAS changes
Disney’s current DAS rules went into effect on May 24, 2024. Disney grandfathered in families who’d planned trips and signed up for DAS under the old system, even if their trips were after May 24. To account for that period where both systems were in place, TouringPlans uses July 1, 2024 as the start date for the current DAS rules.
We know from a 2012 Disney lawsuit that guests using the pre-DAS Guest Assistance Card (GAC) experienced popular attractions at a much higher rate than their numbers would suggest. The court transcript notes that around 3.3% of guests in the parks had a GAC and accounted for 11% of the rides on Space Mountain, 13% on Splash Mountain, and 30% on Toy Story Mania. So it’s worth checking if changing the DAS rules also changed the wait times at popular rides.
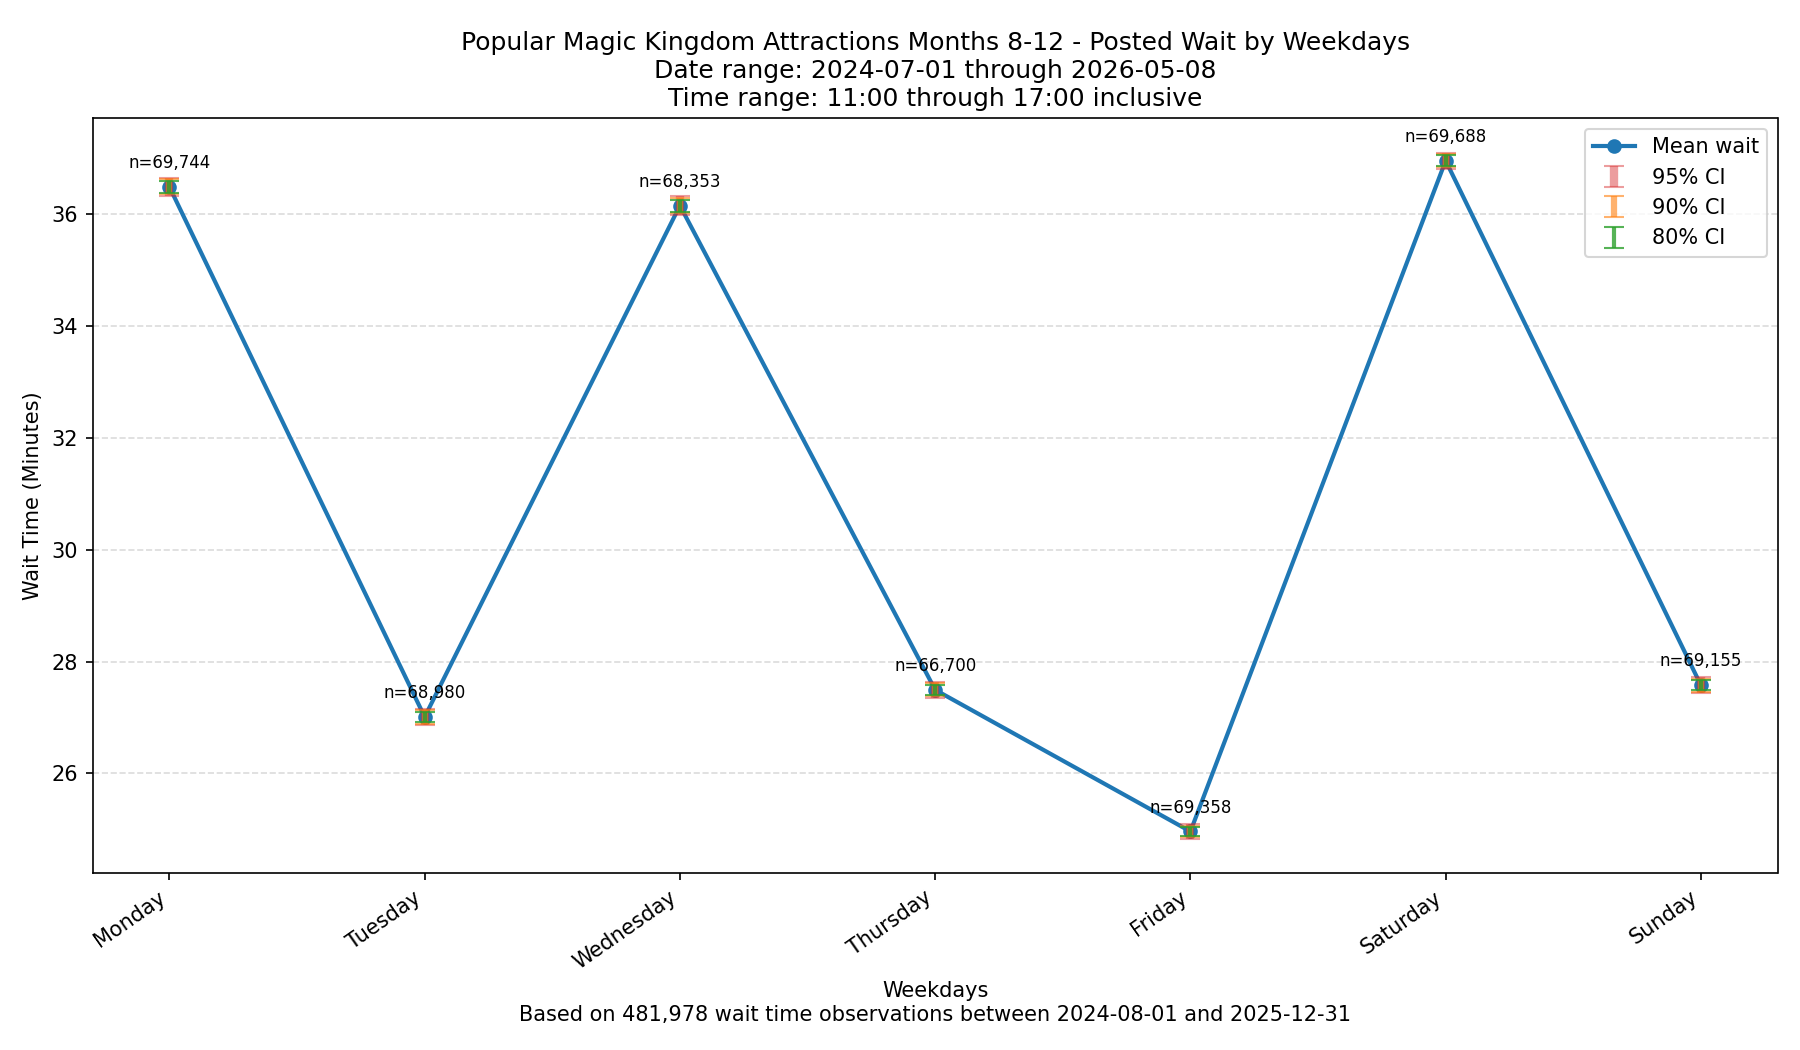
Here’s what the Magic Kingdom’s most popular attractions’ wait times look like between 11 am and 5 pm since July 1, 2024:
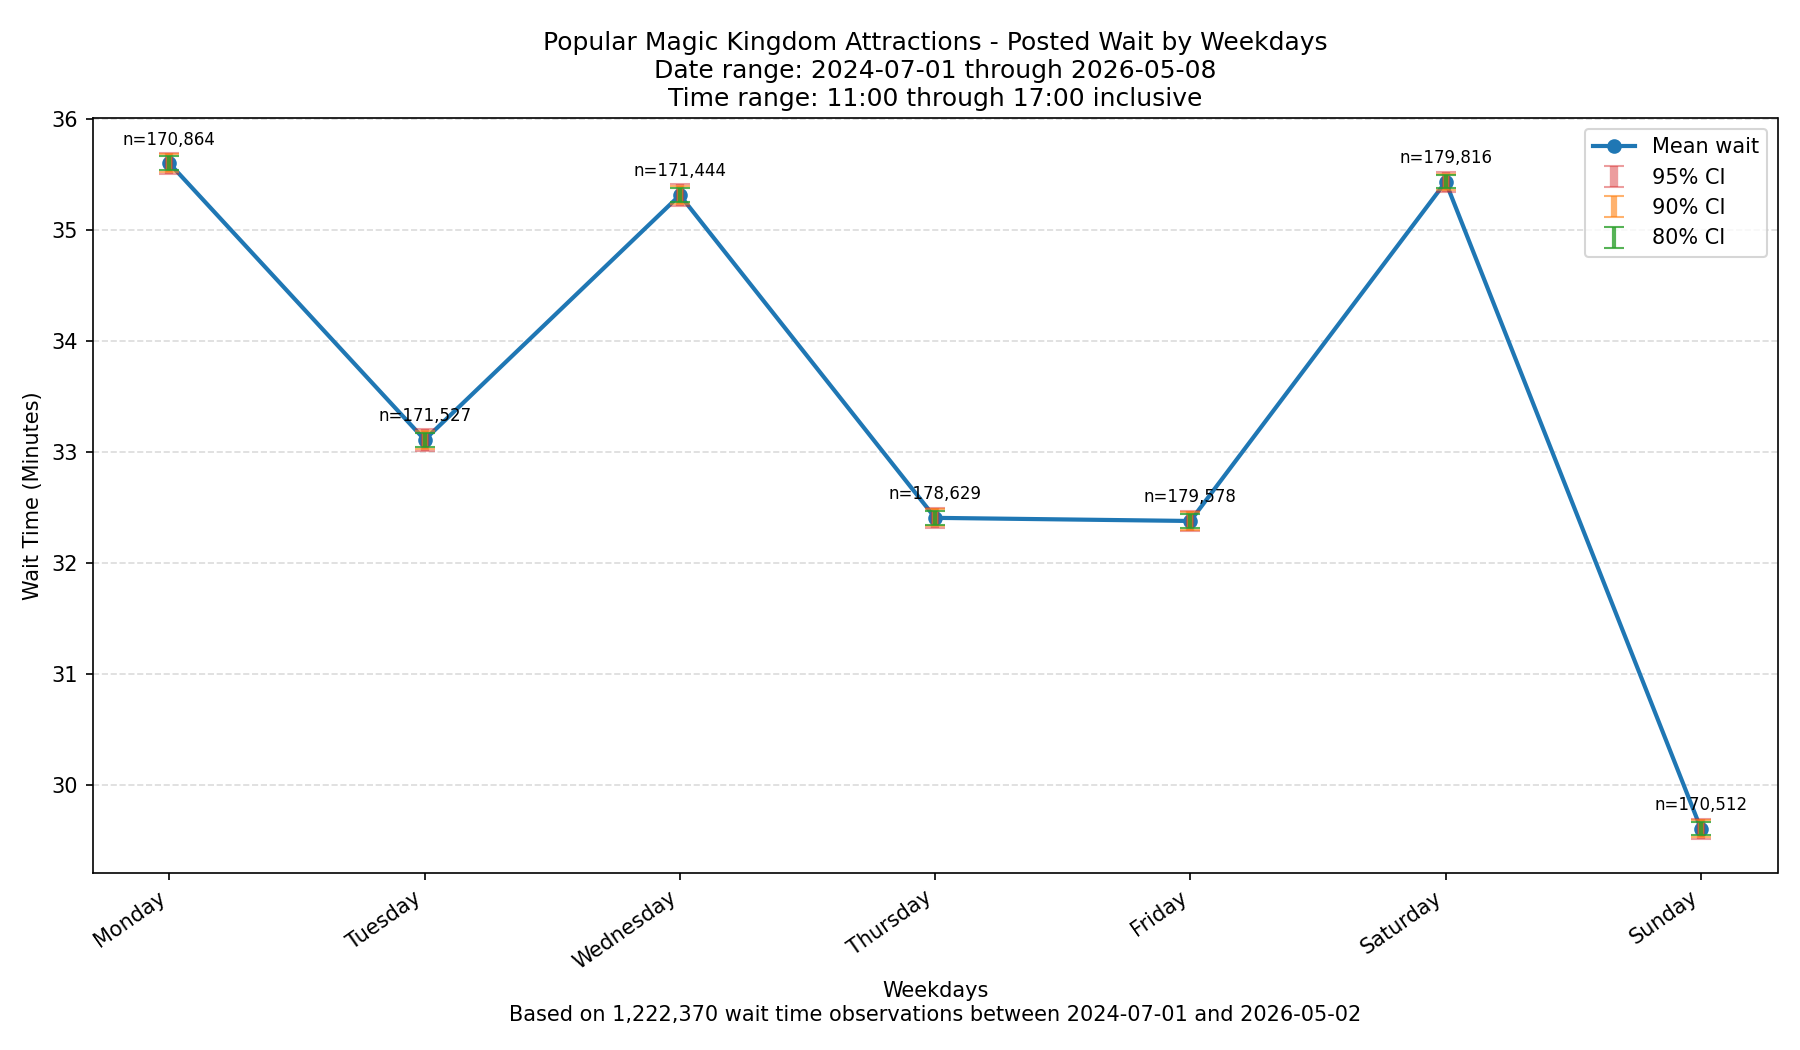
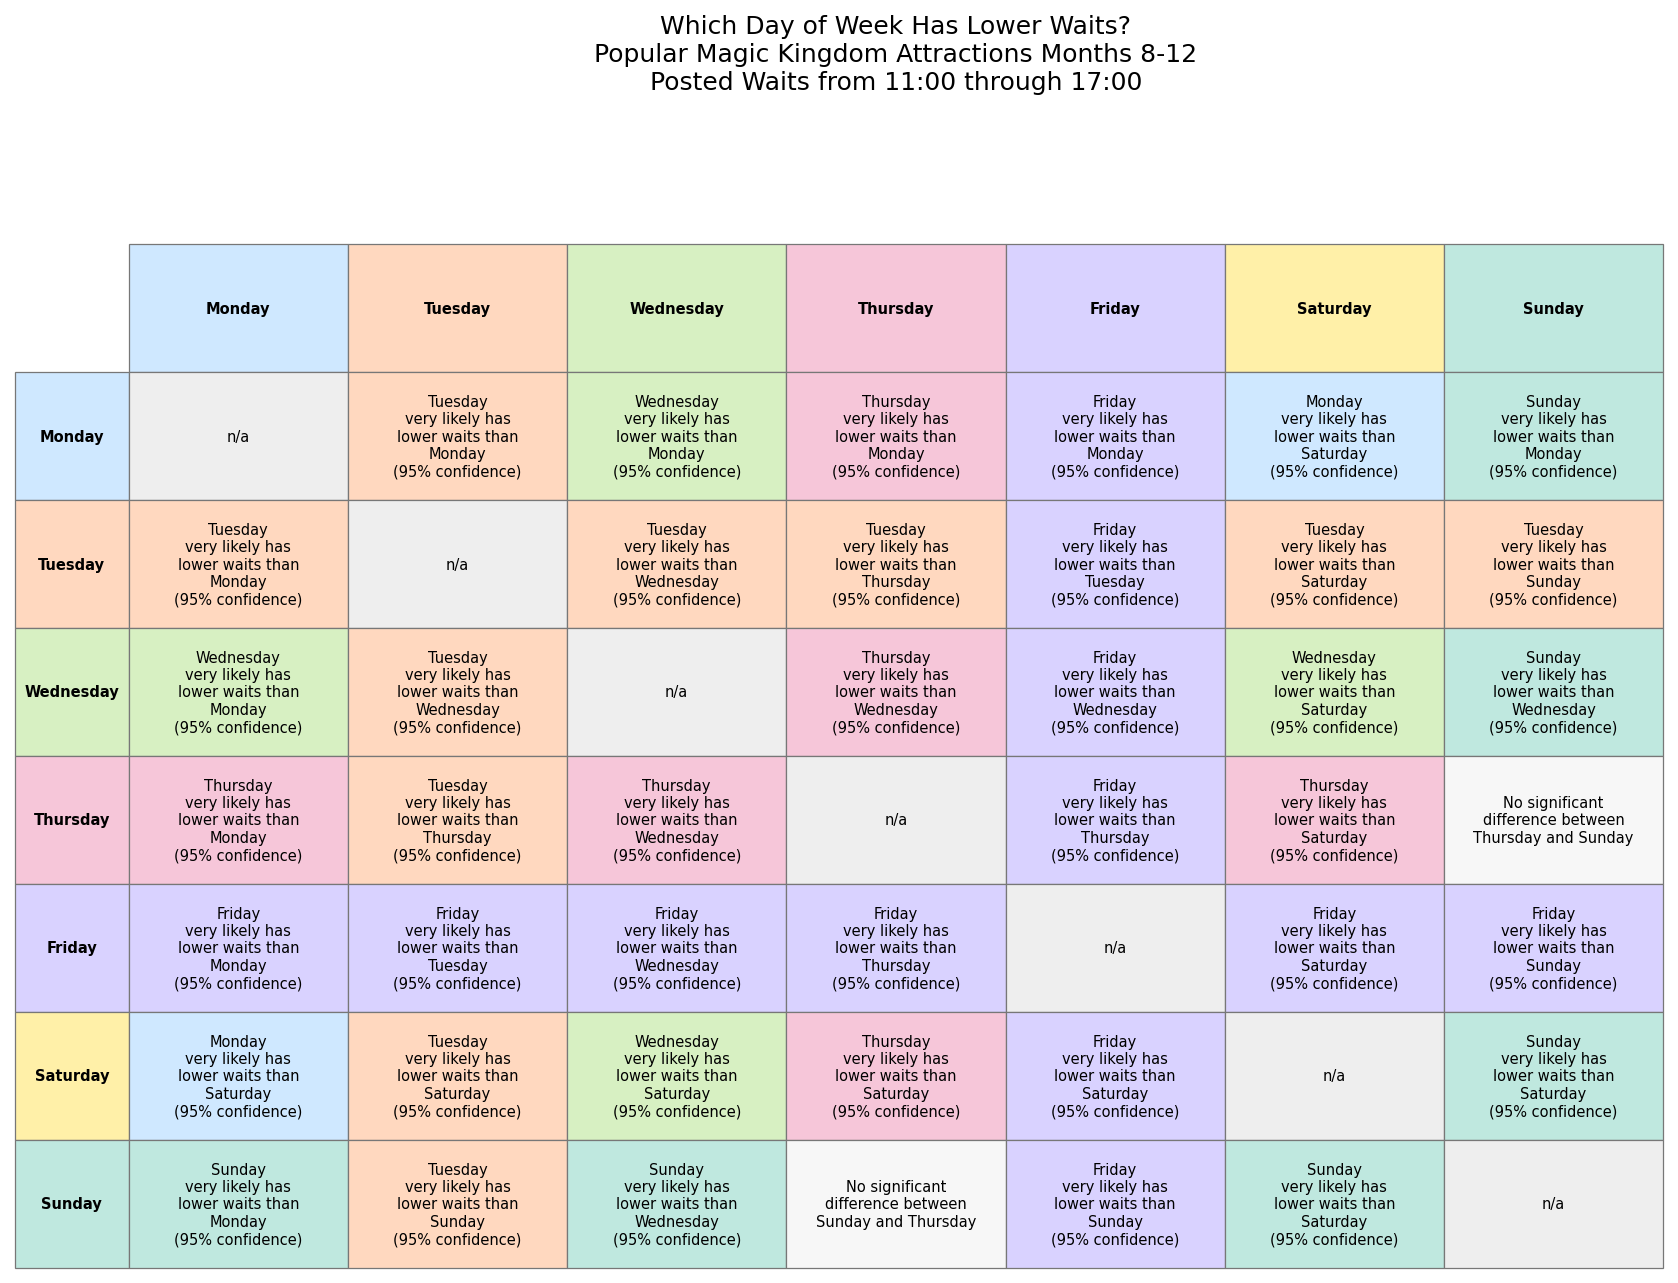
And here’s the matrix:
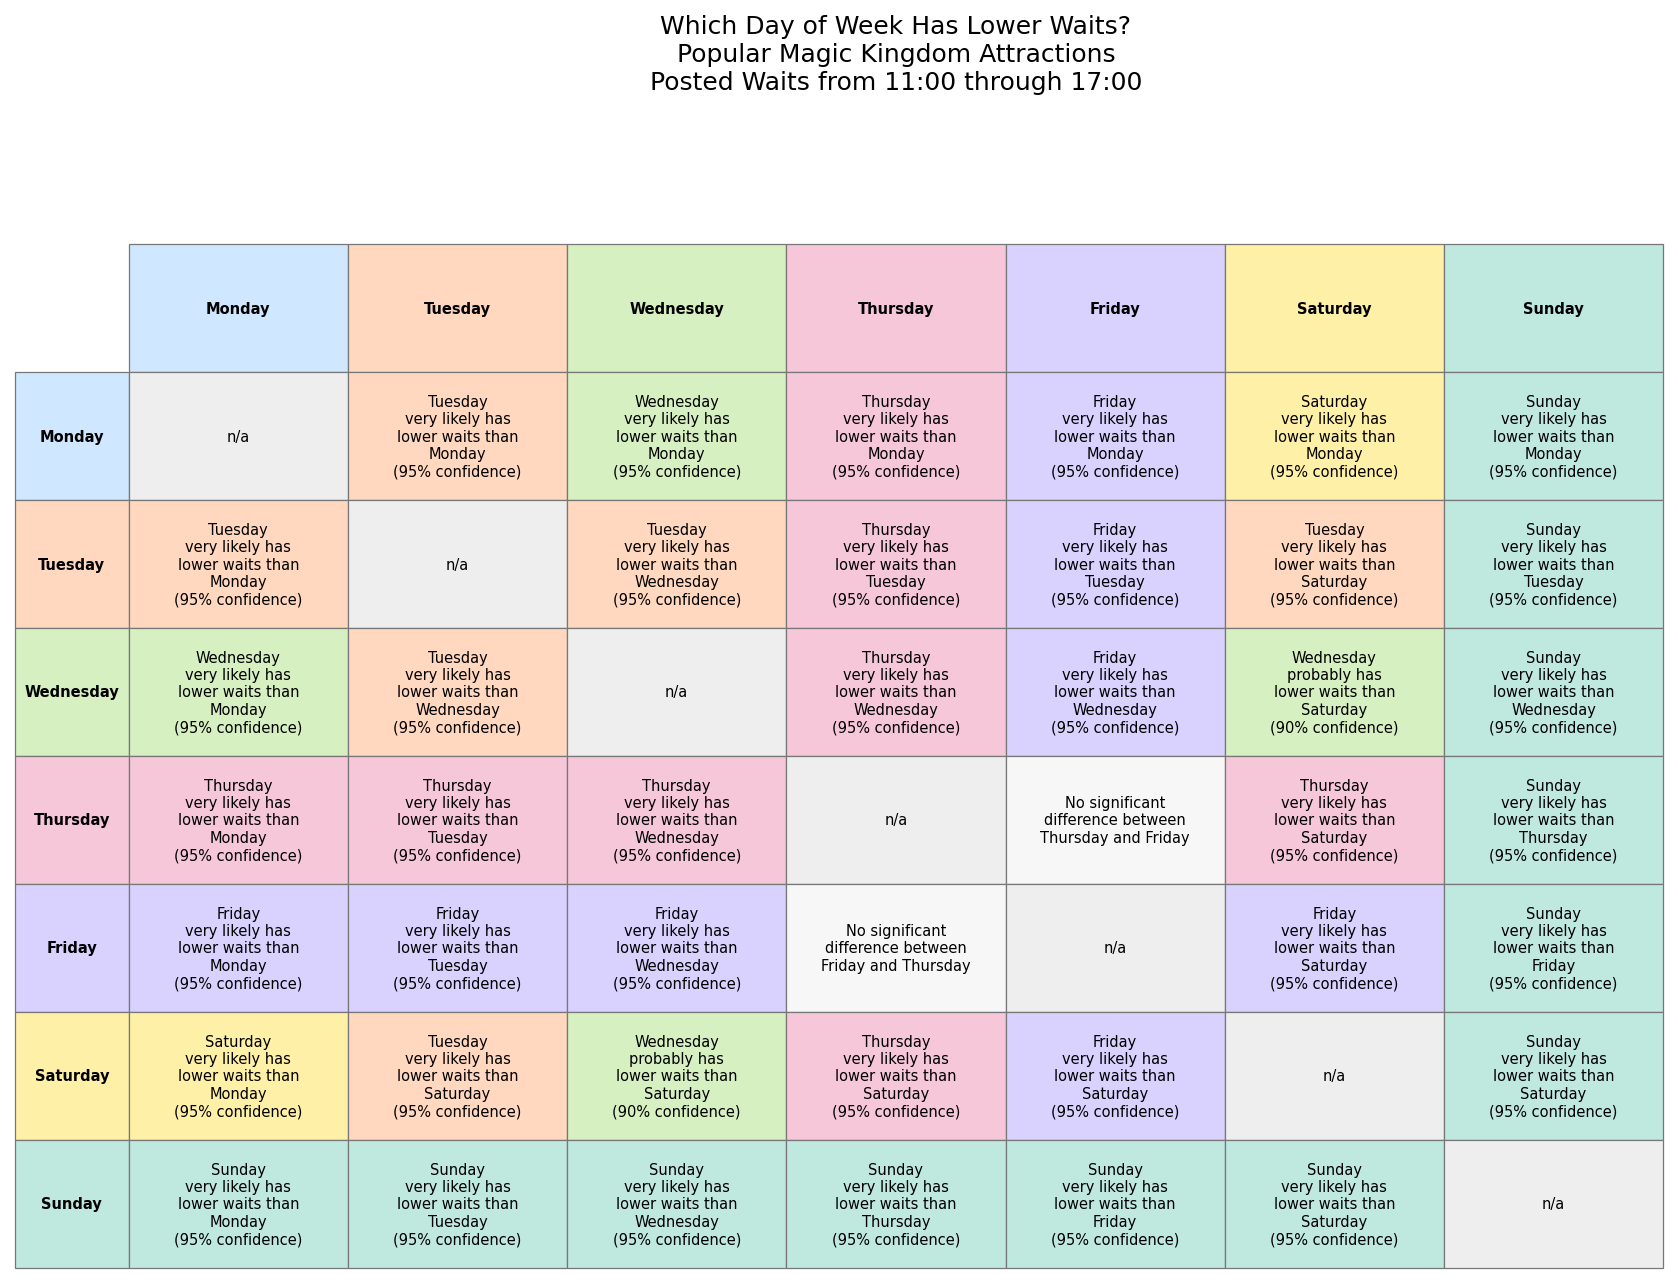
THOSE ARE DIFFERENT RESULTS! After the new DAS rules went into effect we saw the rankings change. Sunday’s still the day with the lowest waits and Monday’s still the highest, with the other days moving around quite a bit:
- Sunday (lowest waits) ~29 minutes
- Thursday and Friday (tie) ~32.4 minutes
- Tuesday ~33.2 minutes
- Wednesday ~35.4 minutes
- Saturday ~35.5 minutes
- Monday (highest waits) ~35.6 minutes
Also note that our confidence that Saturday and Wednesday are truly different has dropped from 95% to 90%. Ninety percent confidence is still solid – we all make decisions every day with information we’re less certain of. But it indicates there’s more going on in the Magic Kingdom that affects wait times by day of week.
One of those things is …
Analysis #5: Accounting for Magic Kingdom Halloween and Christmas Parties
The Magic Kingdom hosts dozens of Halloween and Christmas parties for five months of the year, from August through December. On days with these events, the park closes to regular guests at 6 pm instead of its normal 9 pm or 10 pm time. To make up for these shorter hours, Disney will often extend park hours on days without parties. A large number of families opt to visit the Magic Kingdom on non-party days to get better value out of their ticket purchases. In fact, it happens so often it’s easy to see in our Walt Disney World crowd calendar.
The Magic Kingdom’s special events generally happen on the same days of the week each year. For example, there are 38 Mickey’s Not So Scary Halloween Party events in 2026. We don’t yet have the 2026 schedule for Mickey’s Very Merry Christmas Party events, so we’ll use 2025’s schedule as a guide. There were 25 Christmas parties held in 2025, so let’s assume a total of 63 combined parties for this year.
Adding both parties we get these totals for day-of-week and events:
- Sunday: 13 events
- Monday: 1 event
- Tuesday: 17 events
- Wednesday: 1 event
- Thursday: 11 event
- Friday: 19 events
- Saturday: 1 (on Halloween)
Forty-nine of the 63 parties (78%) happen on just three days of the week (Friday, Tuesday, and Sunday), while just 3 events (5%) happen on Monday and Saturday.
The “party day/non-party day” effect on day-of-week wait times is so big that it affects the overall wait time averages for the entire year. So if you’re visiting from January through July – months without Halloween or Christmas parties – the data might show something entirely different. To quote public radio dreamboat Kai Ryssdal, let’s do the numbers!
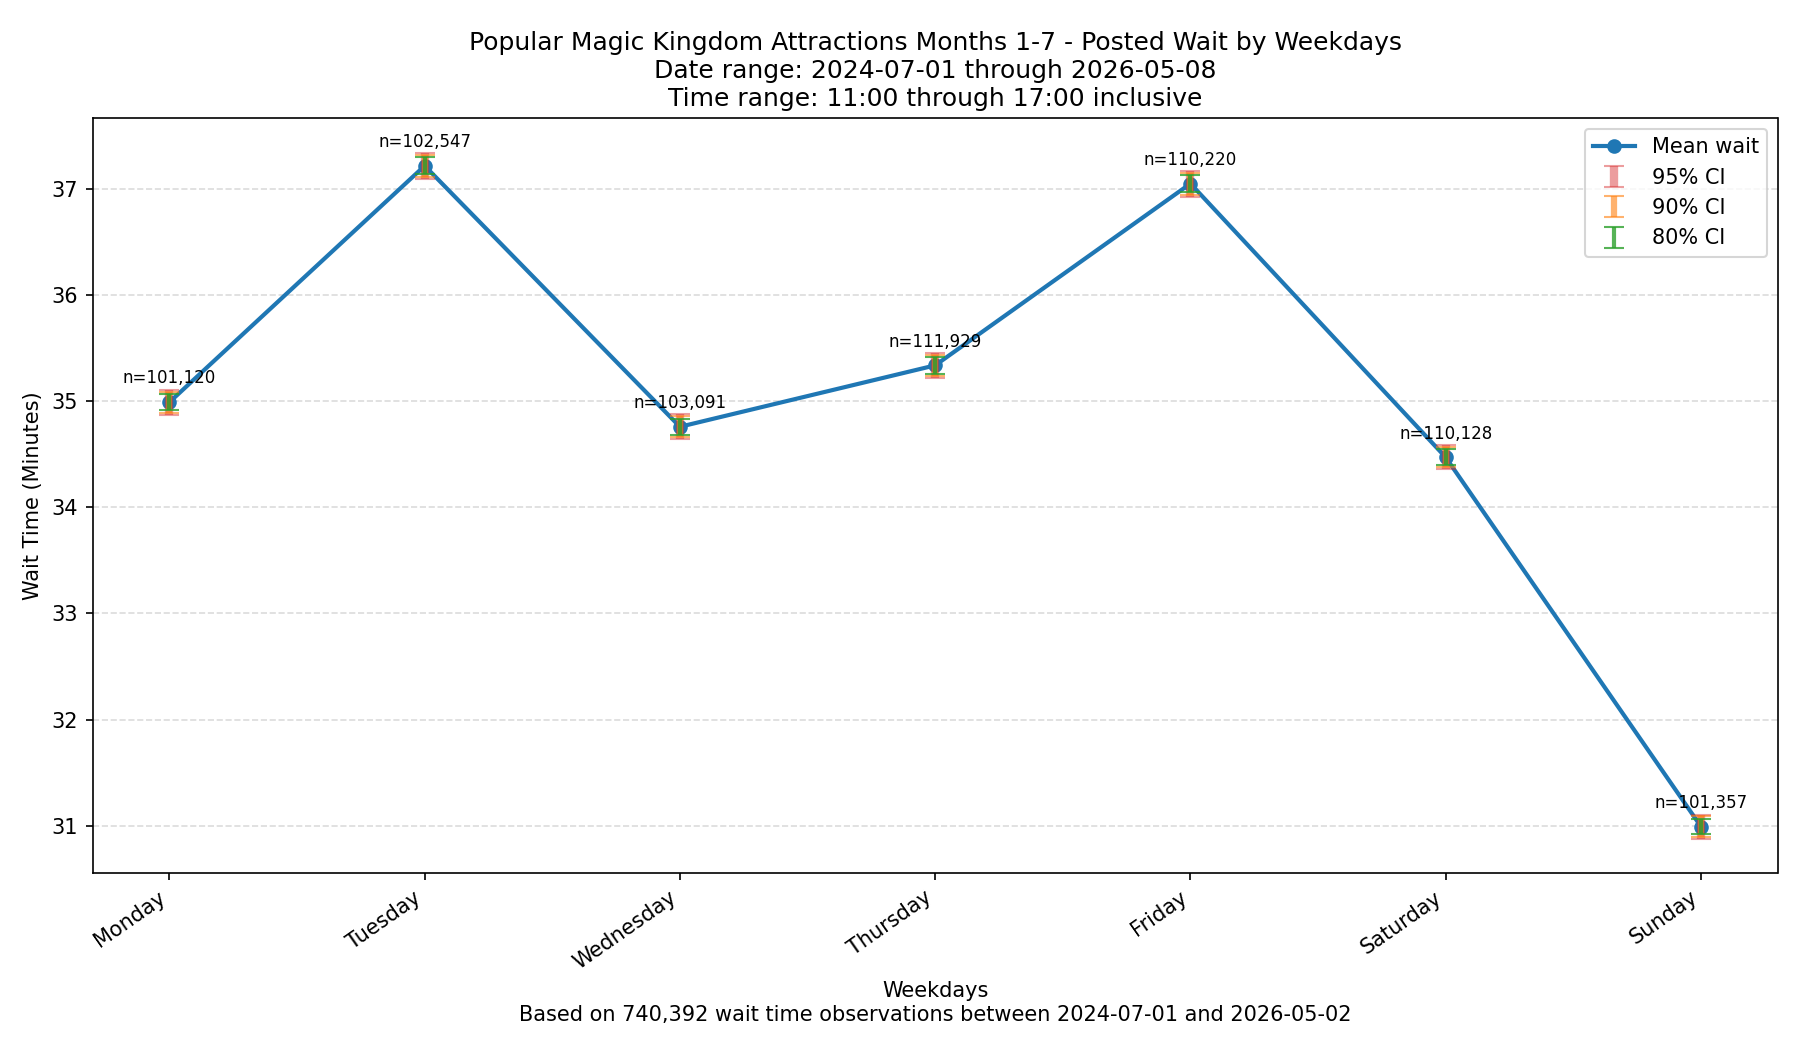
Here’s the chart for post-DAS changes, popular Magic Kingdom attractions during peak times of day, for January through May:
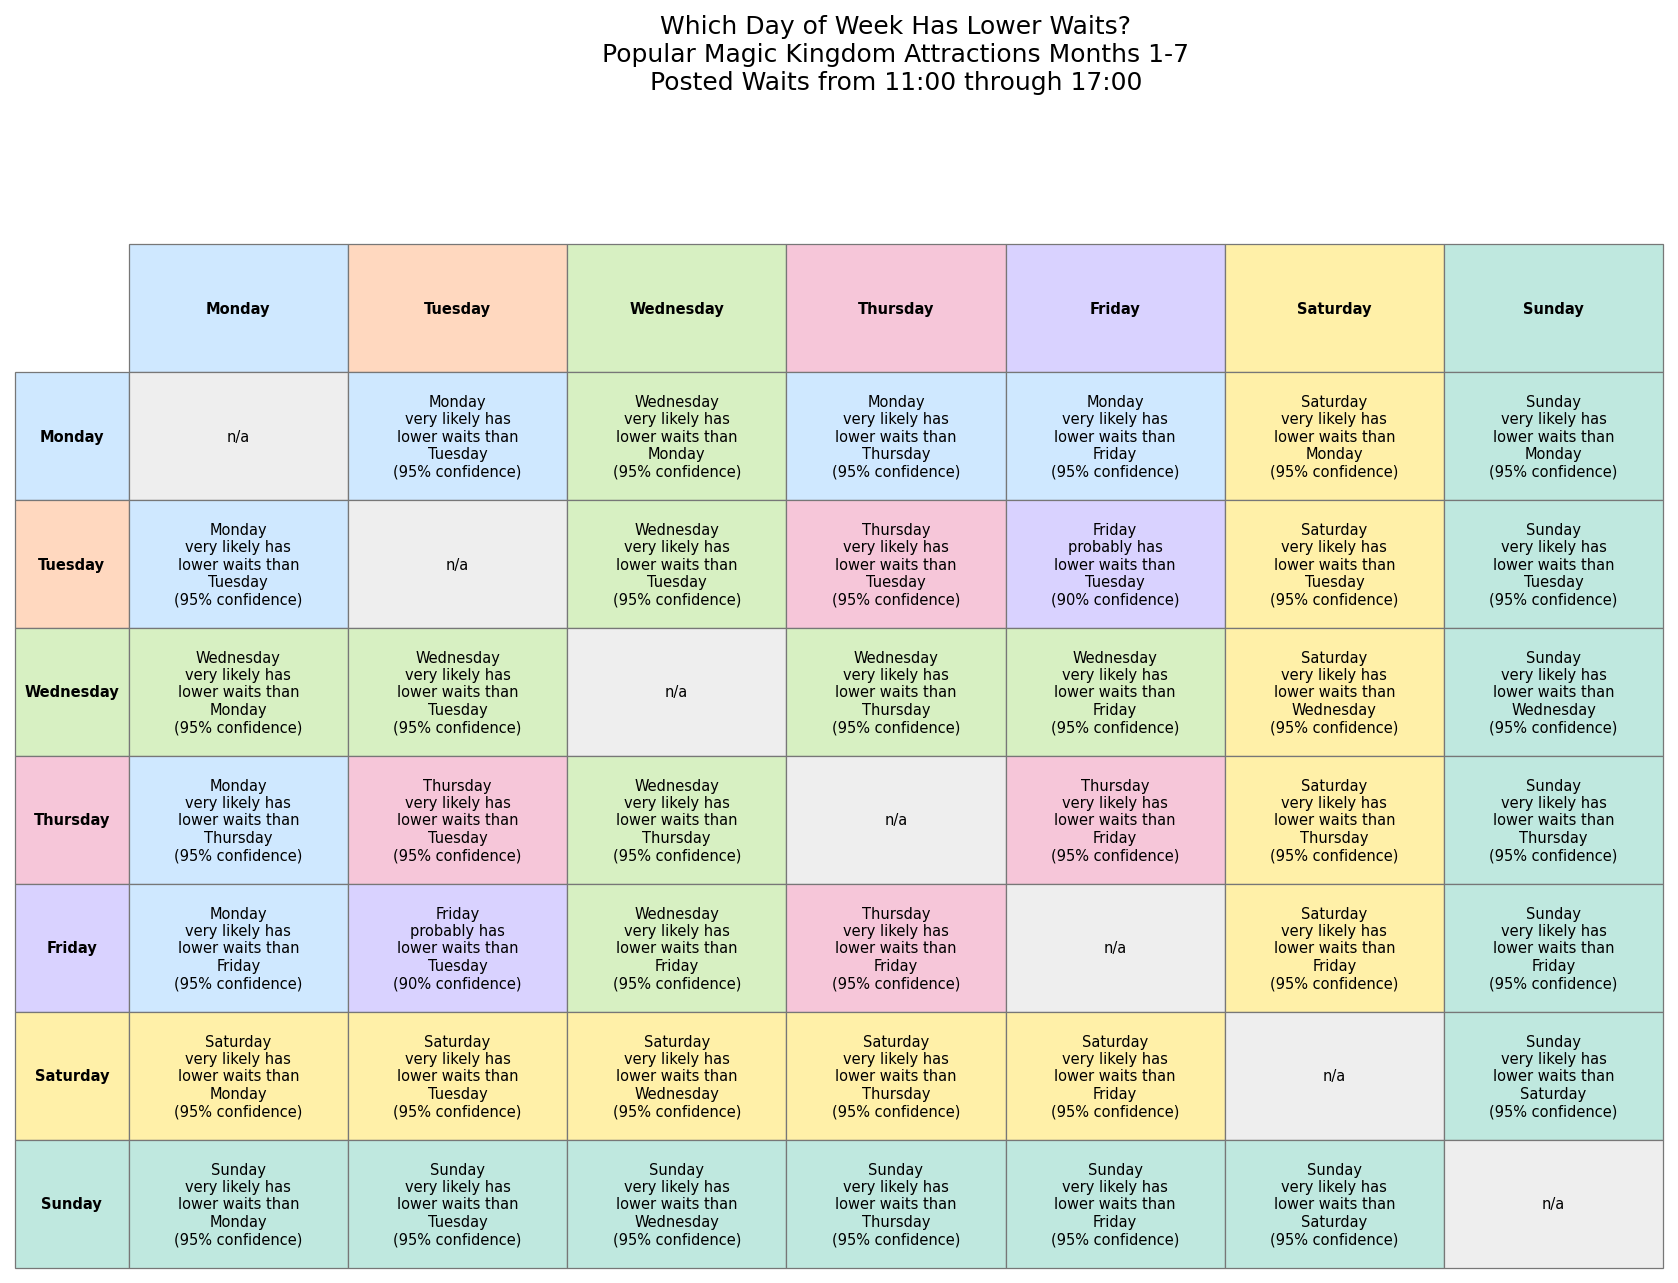
And here’s the matrix:
Here’s the day-of-week analysis for August through December:
And here’s the matrix:
THOSE ARE COMPLETELY DIFFERENT RESULTS!
Here’s a chart that summarizes everything we’ve discovered:
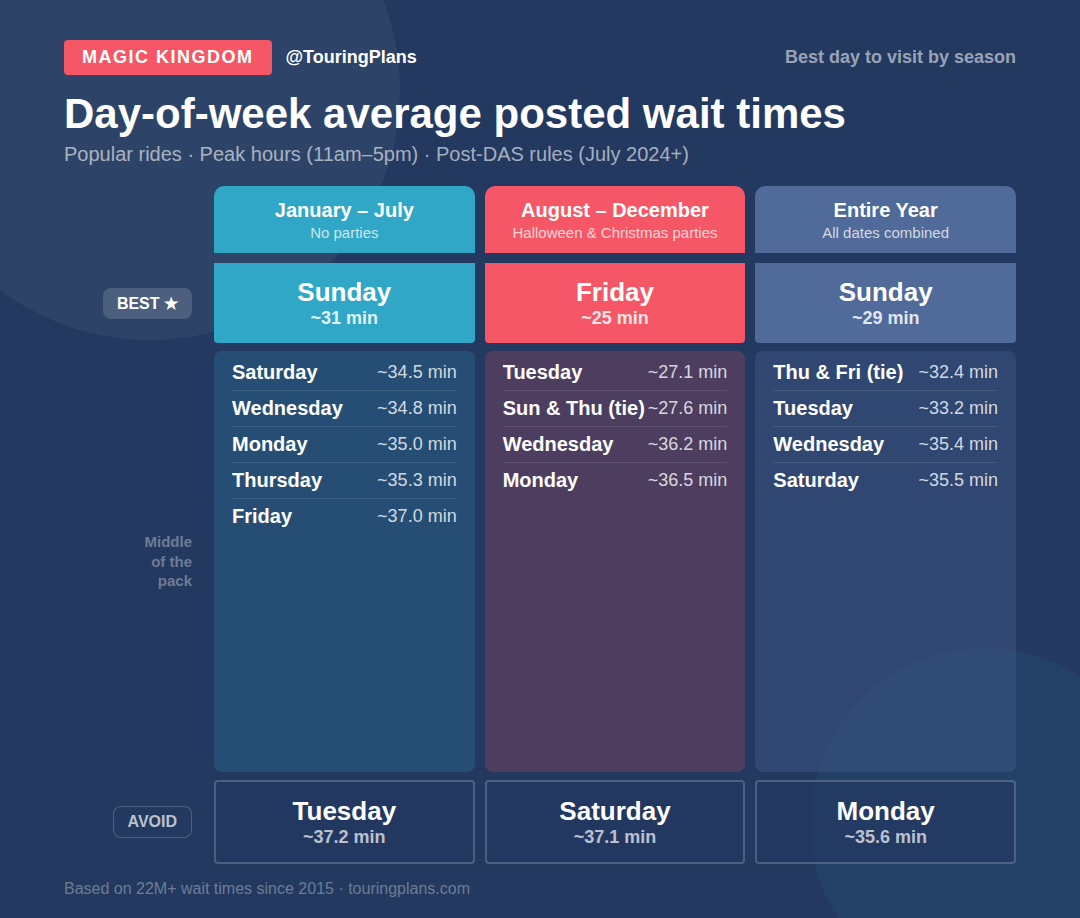
If you’re visiting between January and July, Sunday’s the day with the lowest average posted wait times and Tuesday’s got the highest. If you’re visiting from August through December, go on Friday (a typical party day) to get the lowest waits and avoid Saturday.
Conclusion
This seems like a reasonable place to end our analysis. We’ve considered everything from attraction popularity, the busiest times of the day, Disney’s post-DAS rules changes, and the effect of seasonal Halloween and Christmas parties for the Magic Kingdom. We found that there’s different “best days to visit the Magic Kingdom” depending on the time of year you’re visiting. And we ran a slew of statistical tests to feel good about those results.
Further Research
We can run the same analysis for the other Disney and Universal theme parks. I’m guessing Universal Orlando’s parks also see a seasonal day-of-week difference based on their popular Halloween Horror Nights events.
Also, this analysis looked at posted wait times, which are often different than your actual wait in line. What happens if we look at actual wait times to see which day of the week has truly lower waits?
Here’s a hint – actual wait times show something different:
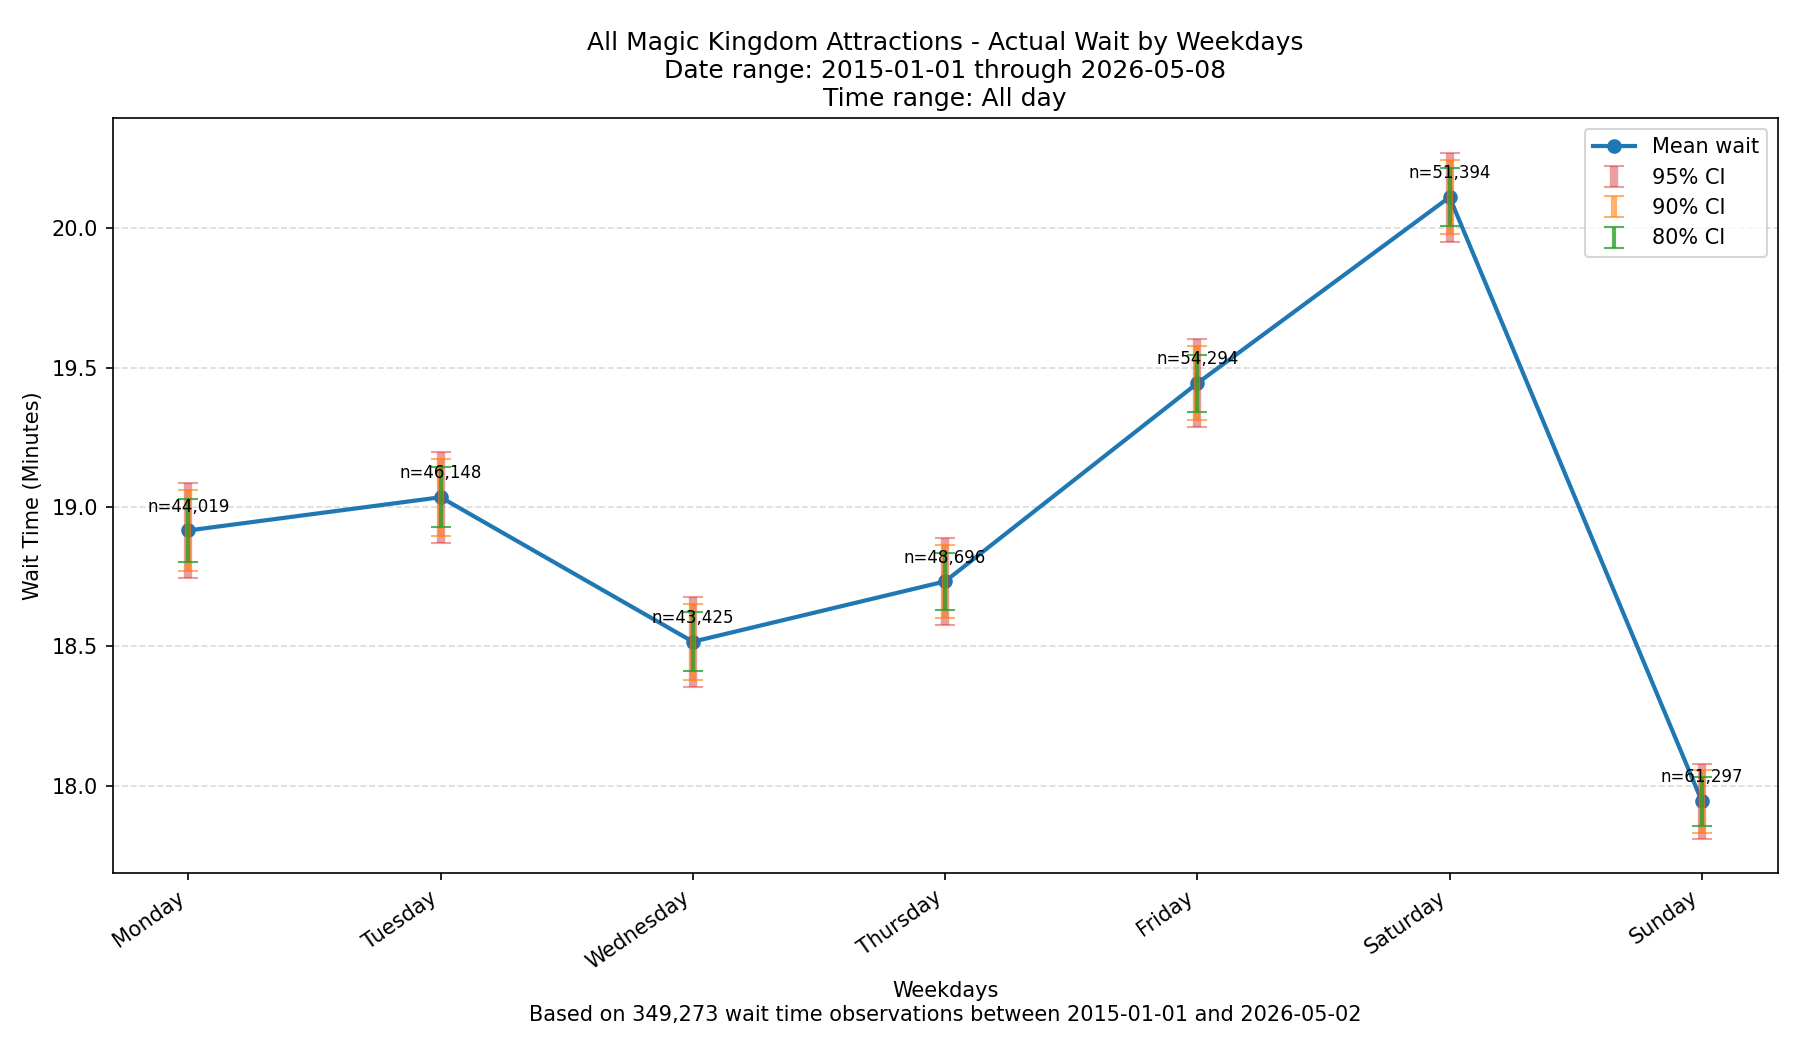
We’ll save that for another post.
Let us know in the comments below if you’d like to see more of this kind of thing. Thanks for reading!
You May Also Like...
-

Welcome to June, and to the first full week of Cool Kid Summer at Walt Disney World! With new deals in…
-

For the first time ever, this week’s Data Dump comes to you from the back porch of Jambo House, with giraffes…
This is awesome and interesting – thank you so much! Now, can you do Epcot, HS and AK please? 😉
Awesome analyses! Thanks for the info and explanations. Looking forward to the actual wait comparison.
This is terrific analysis! I’m sharing this article with my college quantitative methods class for a fun warm up discussion. I may follow up with you on their questions… 😉
Thank you, Jennifer. All of the data is public if you ever want to play around with it. Happy to share.