Disney Data Dump April 22 2026
If you’ve been waiting for a quiet spring window at Walt Disney World that waits until after the wild winter crowds, and sits out of Spring break Season, but also happens before the heat of summer … we made it! In past years, crowds would ease off gradually after Spring Break, stepping down week by week into lower levels. But this year, that pattern has completely shifted. Instead of a slow decline, we’re seeing a hard reset. One week was packed with peak crowds, and the next looks like a completely different season.
This past week is one of the clearest examples of that we’ve seen after recent holidays. Crowd levels nearly bottomed out, landing in territory we almost never see in mid-April. And when you pair that with shorter waits and relatively manageable downtime, it creates a version of the parks that feels very different from what we’ve been looking at for most of the past few months.
Observed Crowd Levels April 14 – 20
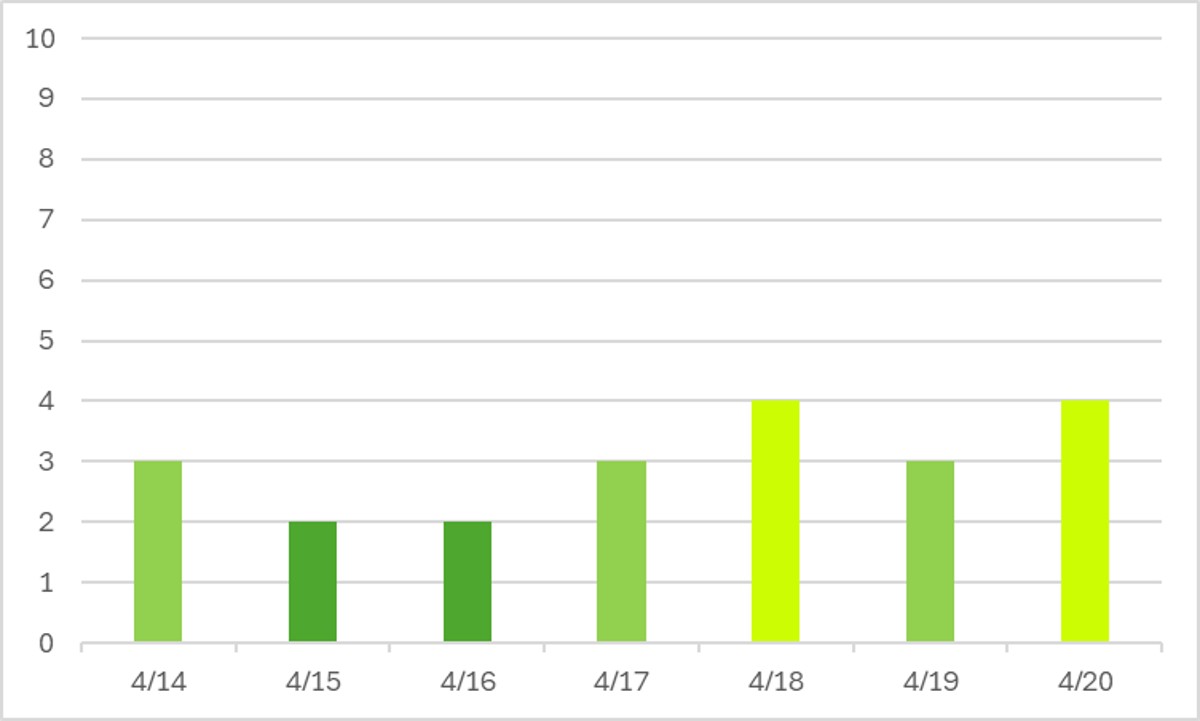
In the past, we’ve seen “shoulder seasons” where big holidays have passed, but crowds gradually decrease until true low seasons. But for about the past year, we’re seeing new behavior – very crowded school holidays and then almost immediately very uncrowded “shoulders.” All green here is remarkable, but the fact that there are two crowd level two days in prime spring not-surface-of-the-sun season is crazy.
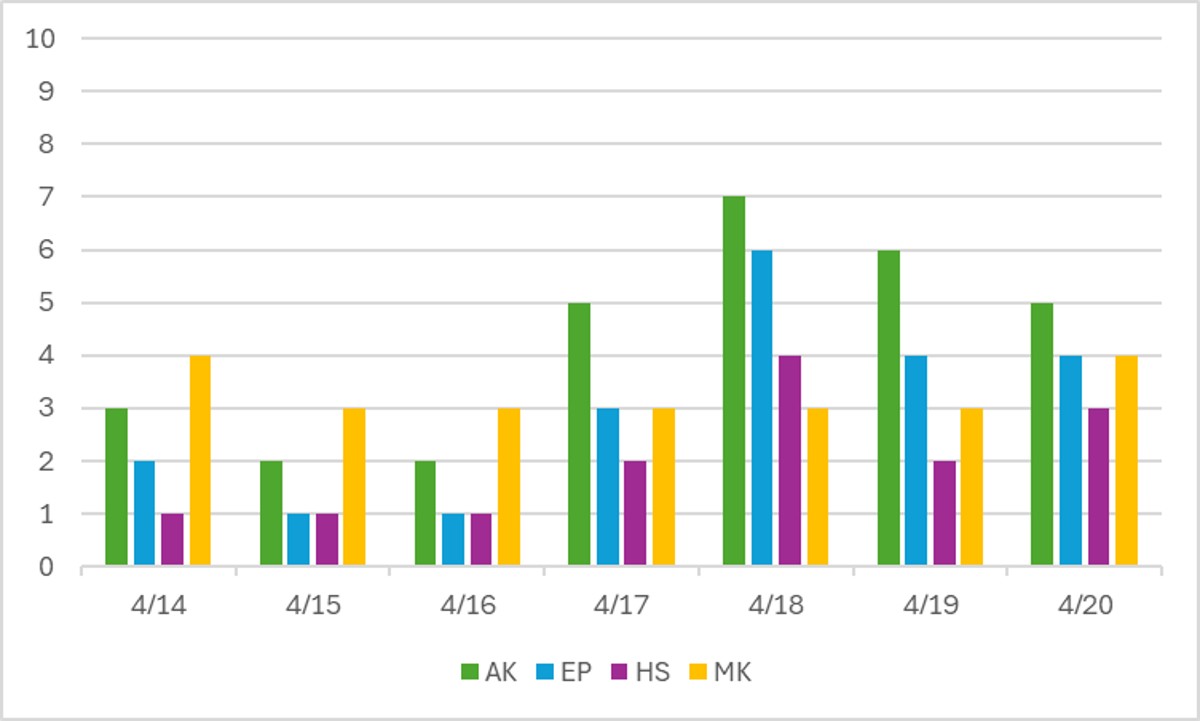
Magic Kingdom continues to show the most crowd stability. It’s a big draw always, but it handles minor shifts in crowds well. Animal Kingdom, on the other hand, is very prone to large wait time spikes any time some minor amount of crowds go to that park. I’m going to continue to call this out over the next month as we work toward Bluey and Bingo making their debut there. That will draw much larger numbers of people to the park, and the capacity of that area isn’t going to magically absorb all of them. I firmly believe we’re going to see a big stepwise shift in crowds at Animal Kingdom as a result, at least for a while. Unless Bluey and Bingo are magically not as popular now.
Performance of Crowd Level Predictions
Each week, I give you a very transparent look into how the TouringPlans crowd level predictions performed. Each day at each park is one data point, so each week we have 28 different crowd level predictions to evaluate. Any time a prediction is within one or two crowd levels, things won’t really “feel” much different than what was predicted. Being off by 3 or more crowd levels is where you might feel that difference in wait times throughout the day.
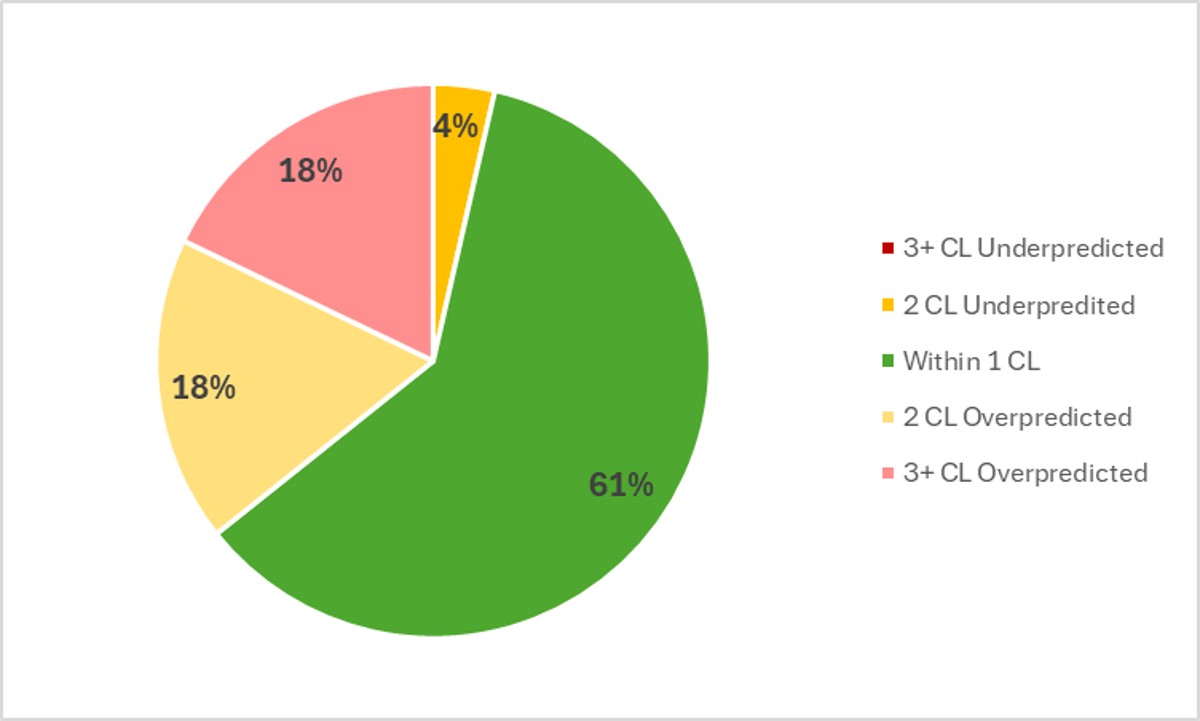
In the past week, Touring Plans predictions were either spot-on or within 1 crowd level 61% of the time, which is slightly up compared to last week. And then 82% of the time Touring Plans predictions were within 2 crowd levels, so that’s a B- for the predictions over the past week. Unlike the past two weeks, when most predictions were underpredictions (the parks were more crowded than expected), now we’ve swung back to almost all overpredictions. This goes further to show that the highs are swinging high this year, and the lows are swinging low, with almost no middle ground. The biggest miss of the week was an over-prediction by 4 crowd levels, which happened at EPCOT on the 16th, where the crowd level was predicted to be a 5 but came in at a 1!
Attraction Downtime April 14 – 20
If we average all of the capacity lost due to unexpected downtime over the past week, it comes out to 4.1% of attractions unexpectedly being down. That’s exactly the same as last week! In the past week, Magic Kingdom was once again the park with the most overall downtime, averaging 5.1% of its capacity lost to downtime. Thankfully, Magic Kingdom is the park that can “handle” the most downtime because of its larger slate of attractions.
The worst day for attraction downtime in the past week was on April 15th. On that day, 6% of all capacity at WDW was lost due to unexpected downtime. And the worst park-day of the was the nice, predictable combination of the worst overall day and worst park of the past week – at Magic Kingdom on April 15th, when 8% of that park’s capacity was lost due to unexpected downtime. Magic Kingdom was open for 13 hours on the 15th, so 8% downtime is the equivalent of the entire park shutting down for just over 62 minutes. Not great, but still plenty of time to explore the park with the most attractions at Walt Disney World.
Attraction Downtime Worst Offender
In the past week, Hall of Presidents was the WDW attraction with the worst overall downtime. I’m sure a great many people were very disappointed by that. It was unexpectedly down for 21% of the past week. Almost every day, it’s opening an hour late and closing two hours early. We’ll check if this is a new operational change that we need to reflect so that it doesn’t count as “unexpected” downtime.
Rope Drop Downtime
Here are problematic offenders from the past week, with the percentage of downtime during the first hour of the day in parentheses:
- Magic Kingdom: Hall of Presidents (85%), it’s a small world (28%), Haunted Mansion (20%), Seven Dwarfs Mine Train (15%), Space Mountain (15%), Country Bear Musical Jamboree (15%), Enchanted Tiki Room (14%), Monsters Inc Laugh Floor (14%), Dumbo (13%), Jungle Cruise (13%), Tron (11%)
- EPCOT: Test Track (22%), Cosmic Rewind (17%), Frozen Ever After (16%), Remy’s Ratatouille Adventure (13%)
- Hollywood Studios: Rise of the Resistance (26%)
- Animal Kingdom: Na’vi River Journey (15%)
Look, I’m not sure that it’s even productive to scold Magic Kingdom anymore. It’s always a long rope drop downtime list. And this week it’s got Seven Dwarfs AND Space Mountain AND Tron. No way. It’s why I always recommend starting at Peter Pan’s Flight if it’s something you want to ride. Reliable, long wait times, and a good rope drop choice.
EPCOT also had a rough week with four big headliners on the list. Thankfully, Hollywood Studios and Animal Kingdom are slightly more reliable.
Wait Times April 14 – 20
Attractions with the Highest Average Posted Wait at Each Park
- EPCOT: Cosmic Rewind, average posted wait of 72 minutes (was 91 minutes last week)
- Magic Kingdom: TRON, average posted wait time of 59 minutes (was 79 minutes last week)
- Hollywood Studios: Slinky Dog Dash, average posted wait of 59 minutes (was 88 minutes last week)
- Animal Kingdom: Flight of Passage, average posted wait time of 53 minutes (was 78 minutes last week)
Look at those wait time drops! Only two attractions had average posted wait times over an hour – Cosmic Rewind and Test Track, and both had some pretty decent downtime issues this week that caused those higher waits when they were open. Everything else was under an hour! Hooray for slow season!
Parks with the Highest and Lowest Average Wait
- Highest: Animal Kingdom, average park-wide posted wait of 32 minutes (was 43.5 minutes at Hollywood Studios last week)
- Lowest: Magic Kingdom, average park-wide posted wait of 20 minutes (was 26 minutes last week)
We. Were. So. Close. So close to all four parks being under that half-hour average posted wait time mark! Alas, Animal Kingdom still struggles with capacity issues, and Hollywood Studios was just over 30 minutes on average too. But, these are still huge drops overall in average posted wait across entire parks – it goes to show just how uncrowded this week was compared to last week.
Most Inflated Posted Wait Times
We all know that Disney inflates their posted wait times on purpose. They have many reasons for doing this. Some are totally understandable, and some are potentially more problematic. We can figure out how much posted wait times are being inflated by comparing submitted actual wait times from the Lines App and the posted wait time when the person timing their wait entered the line.
Over the past week, actual wait times in the Lines App averaged 71% of what was posted. That’s close to our historical average in the era of Lightning Lanes. Overall, if the posted wait time at a popular attraction was 60 minutes, you could’ve expected to wait less than 43 minutes instead.
But the worst inflation offender for the past week was Gran Fiesta Tour. At this one attraction, submitted actual wait times were only 38% of posted wait times in the past week. That means that if Gran Fiesta Tour had a 15 minute posted wait, you probably would have actually only waited less than 6 minutes instead. Less than half of what was posted! Remember to always check the Lines app for predicted actual waits instead of making decisions based on what is posted.

This Week’s Wait Time Rock Star
Between April 14th and 20th, we had just over 1200 timed actual waits submitted through the Lines app. The one person who recorded the most actual waits during that time was otg13, with 39 overall timed waits – 2 Lightning Lane waits, 32 standby waits, and 5 single rider waits. Thanks for all of that timing, otg13! It unfortunately does not compete with the the 97 timed waits in a single week from our current timing champion, preef.
Looking Ahead: April 21 – 27
I write this article on Tuesday evenings so that you all have the very freshest of data on Wednesdays. That means the 21st will already be in the past by the time you’ve read this, so we’ve conquered time travel!
More of the same 🙂 There’s no reason that crowds should see any major shifts over the next week. Expect overall crowd levels to stay in that 2-4 range.
And it looks like the weather is going to cooperate too! Ample sunshine and highs in the 80s. Overall, it should be a glorious week to be in Disney.
Were you in the parks this past week? Or are you headed to Orlando soon? Let me know in the comments below!
You May Also Like...
-

What we saw this past week is a really good reminder that Spring Break season isn’t one clean spike. It’s a…
-

If you were hoping for an April Fools’ joke where I tell you Spring Break crowds suddenly disappeared… I regret to…