Disney Data Dump March 1 2023
Happy March! We made it through Festival of the Arts, Valentine’s Day and President’s Day, and all of those Mardi Gras crowds. It’s now the month of Flower and Garden, and St. Patricks Day, as well as the arrival of the first Spring Break crowds. But most of that is in the future. So for now we’ll review the crazy end of February while we look forward to a more relaxed early March.
Observed Crowd Levels 2/21 – 2/27

Congratulations! We made it through the week of doom! It’s a little disappointing that the week of doom was split between two weeks of Disney Data Dump, but I’ll take solace in the fact that this graph is so pretty and shows off that dissipation of crowds. February 21st was Mardi Gras as well as the day after President’s Day. We knew it was going to be very crowded. And then we get all of the way to the 26th, which was the day of the Princess Half Marathon RunDisney event. This event soaks up a lot of the crowds, and it also makes some of the parks almost inaccessible for the morning. That drives down wait times, as we see by that lone green bar.

This graph really shows the impact of that RunDisney event. Magic Kingdom still opened “officially” at 9 am on the 26th, but the road closures and transportation issues due to the half marathon running that morning meant crowds were really delayed in getting to the park. And a lot of people know about the transportation issues and just opt to avoid the park entirely. Still, if you’re staying at a resort on the monorail loop, or you can … parachute into the park or something … it was a great day to be in Magic Kingdom.

On the other hand, Hollywood Studios tends to not see the same extent of crowd thinning thanks to the half marathon. You can still get to the park with relative ease, so it doesn’t get a nice green day. Still lower than any of the surrounding days, but not by much.
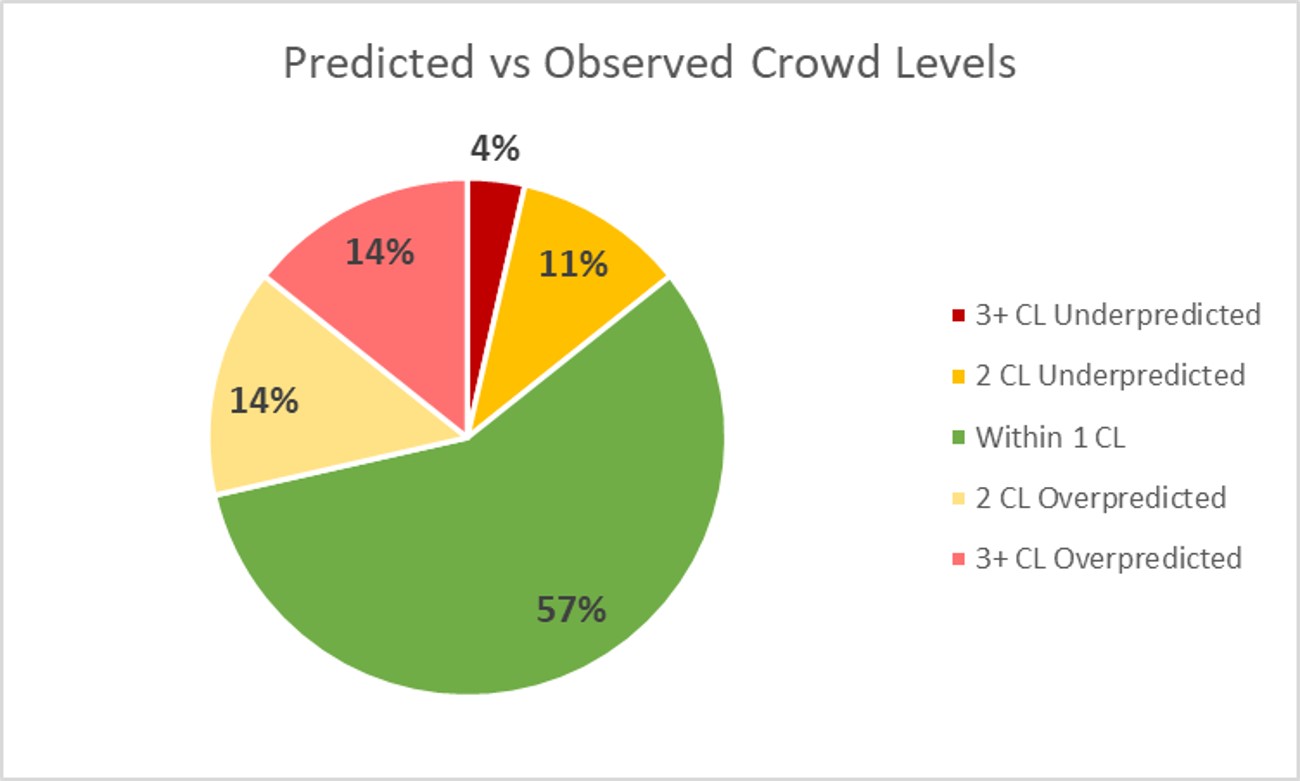
Each week, I’m giving you a very transparent look into how our crowd level predictions performed. Each day at each park is one data point, so we have 28 different crowd level predictions to evaluate each week. Any time a prediction is within one or two crowd levels, things won’t really “feel” much different than what we predicted. Being off by 3 or more crowd levels is where we’d like to be more accurate because you might feel that difference in wait times throughout the day.
In the past week, Touring Plans predictions were either spot-on or within 1 crowd level 57% of the time. This is a slight increase from last week, but still well below the historical average. 82% of the time Touring Plans predictions were within 2 crowd levels, and that means we earn a B- for our predictions this past week. This, too, is a little below average. The biggest miss of the week was on February 26th. On that day, crowds at Magic Kingdom were 5 levels lower than expected. Magic Kingdom has “won” this unpredictable slot for 4 weeks running now. This time it’s thanks to the Half Marathon keeping the crowds away from the park.
Attraction Downtime 2/21 – 2/27
If we average out all of the capacity lost due to unexpected downtime over the past two weeks, it comes out to 3.1% of attractions unexpectedly being down. Once again, crowds are going down a bit and downtime is going back up. The park with the biggest issues was EPCOT, with 4.3% of its capacity lost due to unexpected downtime. This may be one of the first times EPCOT has had the most downtime issues of any WDW park.
The worst day for attraction downtime in the past week was on February 26th. On that day, 5% of all capacity at WDW was lost due to unexpected downtime. The worst park-day of the week was at EPCOT, also on the 26th. On that day, 13% of the the capacity at that park was lost due to unexpected downtime. EPCOT was only open for 11 hours on that day thanks to the half marathon, so 13% downtime is the equivalent of the whole park being down for over 85 minutes – almost an hour and a half of downtime for the whole park on an already-short day. Thankfully, this did not appear to significantly impact crowd levels, since the park came in at a crowd level 4 instead of the predicted 6.
Attraction Downtime
The worst offender this week was … wait for it … Journey Into Imagination with Figment, which was unexpectedly down for approximately 21% of the week. The worst day for my favorite purple dragon was February 26h, when it was down for 99% of the day – but it was also down for 43% of the day on the 27th. I guess Figment needed a break after all of the hard work he put into Festival of the Arts.

Rope Drop Downtime
Here are this week’s problematic offenders:
- Magic Kingdom: Haunted Mansion (unavailable for 28% of its first hour of the day)
- EPCOT: Journey Into Imagination with Figment (unavailable for 26% of its first hour of the day), Test Track (unavailable for 17% of its first hour of the day)
- Hollywood Studios: Rise of the Resistance (unavailable for 42% of its first hour of the day), Slinky Dog Dash (unavailable for 30% of its first hour of the day), Runaway Railway (unavailable for 19% of its first hour of the day)
- Animal Kingdom: DINOSAUR (unavailable for 20% of its first hour of the day)
What a terrible week for rope drop at Hollywood Studios! Rise of the Resistance being down almost half of the time during the first hour of the day really throws a wrench in all of the plans. Usually my back-up recommendation is Slinky, which was also down about a third of the time. Add Runaway Railway to the mix and that’s just mean.
Wait Times 2/21 – 2/27
Attractions with the Highest Average Posted Wait at each park
- Hollywood Studios: Slinky Dog Dash, average posted wait of 106 minutes (98 minutes last week)
- Animal Kingdom: Flight of Passage, average posted wait time of 109 minutes (123 minutes last week)
- EPCOT: Remy’s Ratatouille Adventure, average posted wait time of 79 minutes (83 minutes last week)
- Magic Kingdom: Seven Dwarfs Mine Train, average posted wait time of 84 minutes (83 minutes last week)
The only somewhat surprising result here is Slinky Dog Dash having such a big increase in posted wait times when most of the other headliners saw slight decreases instead. Slinky did have some early morning operational issues, and so perhaps that backed things up enough. We’re also seeing some of the initial impact of Rock’n’Roller Coaster being down for refurbishment, which will increase wait times at other Hollywood Studios attractions.
Parks with the Highest and Lowest Average Wait
These parks likely won’t change week-to-week unless something ridiculous happens, but these data points will give us a high-level view of how wait times are trending from week to week.
- Highest: Hollywood Studios, average park-wide posted wait of 46 minutes (last week 48 minutes)
- Lowest: Magic Kingdom, average park-wide posted wait of 28 minutes (last week 27 minutes at EPCOT)
Magic Kingdom and EPCOT are really fighting it out for the lowest posted wait times! Magic Kingdom dethrones EPCOT after its two week run. EPCOT did have the highest downtime of any park overall for the past week, so that could have been enough to push up its wait times into 3rd place instead of last place.
Most Inflated Posted Wait Times
We all know that Disney inflates their posted wait times on purpose. They have many reasons for doing this. Some are totally understandable, and some are potentially more problematic. We can figure out how much posted wait times are being inflated by comparing submitted actual wait times from the Lines App and the posted wait time when the person timing their wait entered the line.
Over the past week, actual wait times in the Lines App averaged 66% of what was posted. This is ever-so-slightly above our historical average, and a couple of percentage points above what we’ve seen the past two weeks. If the posted wait time was 20 minutes, you could’ve expected to wait just over 13 minutes instead.
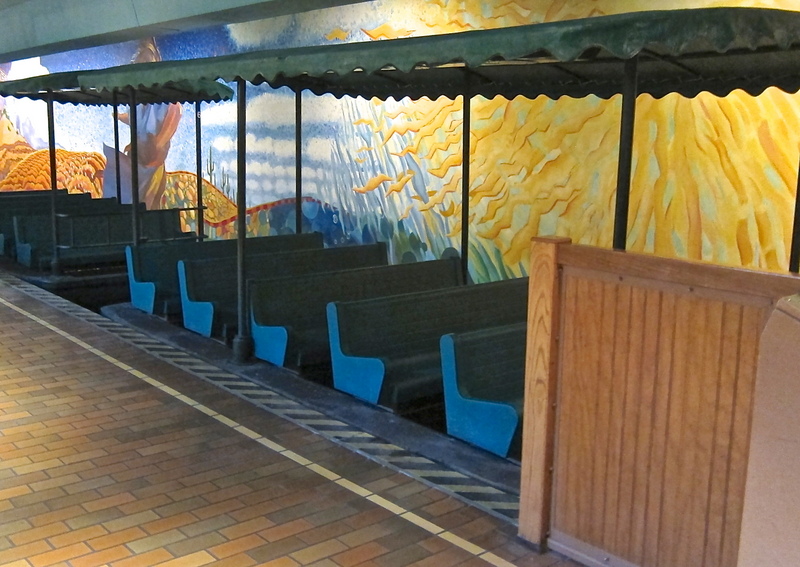
But the worst offender for the past week Living with the Land. It thankfully dethrones Peter Pan’s Flight after that attraction had the most inflated posted wait time for four out of the past five weeks. At this one attraction, submitted actual wait times were only 42% of posted wait times, which means that if Living with the Land had a 30 minute posted wait, you probably would’ve waited less than 13 minutes. Less than half of what was posted. Remember to always check the Lines app for predicted actual waits instead of believing what is posted.
Actual Wait Time Rock Star
The Actual Wait Time Rock Star for this past week was … mbcollins, a repeat rock star, who submitted 25 actual wait times through the Lines App over the last 7 days! This includes 10 Lightning Lane waits, 12 Standby waits, 1 Single Rider wait, and 1 Virtual Queue waits. Thanks for your hard work, mbcollins! But you didn’t reclaim that all-time record, which is still held by shop.kgb, with 50 recorded wait times in a single week.
In the next week, we could still use lightning lane wait times for characters. We still have very small sample sizes for those at this point. Thanks!
Looking Ahead: February 28th through March 6th
We’ve made it through the worst. For now. Early March should see continuing light-ish to middling crowds, since we’re past those winter holidays, and a couple of weeks away from Spring Break season. Some of those Spring Breaks do happen in late March (my kids are one of those), including several large school districts in Florida. But Easter isn’t until April 9th, so some school districts that use that as an anchor for their Spring Break will be a little later. That helps spread out some of the crowds. Regardless, this next week should be pleasantly un-chaotic.
Flower and Garden Festival kicks off on March 1st, which will once again make EPCOT feel more crowded than what the wait times suggest. Otherwise there are no major disruptions to normal operating hours. And the weather this week looks warm, but not incredibly rainy other than maybe a day or two.
You May Also Like...
-

Happy February! This last week of January may eventually look, in hindsight, like the calm between the storms for several reasons.…
-

Welcome to 2023, Disney data friends! A time for setting goals and dreaming big dreams. A time for reviewing where we've…
-

And we're back! It's been two whole weeks since you've gotten your dose of Disney data, and I know you've all…
-

Happy February, Disney Data fans! I have to start out this special February 8 post by giving a shout-out to my…
Hi Becky – thanks for another super interesting post. I’m one of the people gearing up for the Spring Break crowds and trying to pick my couple days in the park carefully while fully realizing it will still be some version of crowded. Just curious, have you all done any work in comparing Genie Plus prices with crowd levels. In other words, something like $20 tends to translate to crowds in the 6-7 range, while $29 is more like 9-10. I’m just wondering if I can look at the Genie price at midnight the night before and extrapolate anything in terms of which days to go to the parks based on its price.