
Disney Data Dump February 22 2023
The time is finally here! The week of doom that I have been foretelling for the past month. Warning everyone to stay away from parks that were almost certainly going to be overcrowded. And thankfully (or un-thankfully if you were in the parks) the crowds proved me right. Remarkably, Genie+ sold out. Park reservations were ungettable. Wait times were absurd. The data makes it look even more crowded than Christmas. So you heard it here first – President’s Day is the new Christmas.
Observed Crowd Levels 2/14 – 2/20

You know those crazy late-February crowds I warned you about starting with President’s Day Weekend? They’re heeeeeeeeeere! The 16th and 17th acted as a sort of slow ramp-up to the crazy crowds of the 18th, 19th, and 20th. Good on you if you were visiting in mid-February and mad your escape after the 15th instead. Let’s go one level deeper to try to root out what these crowds look like at a couple of the parks.
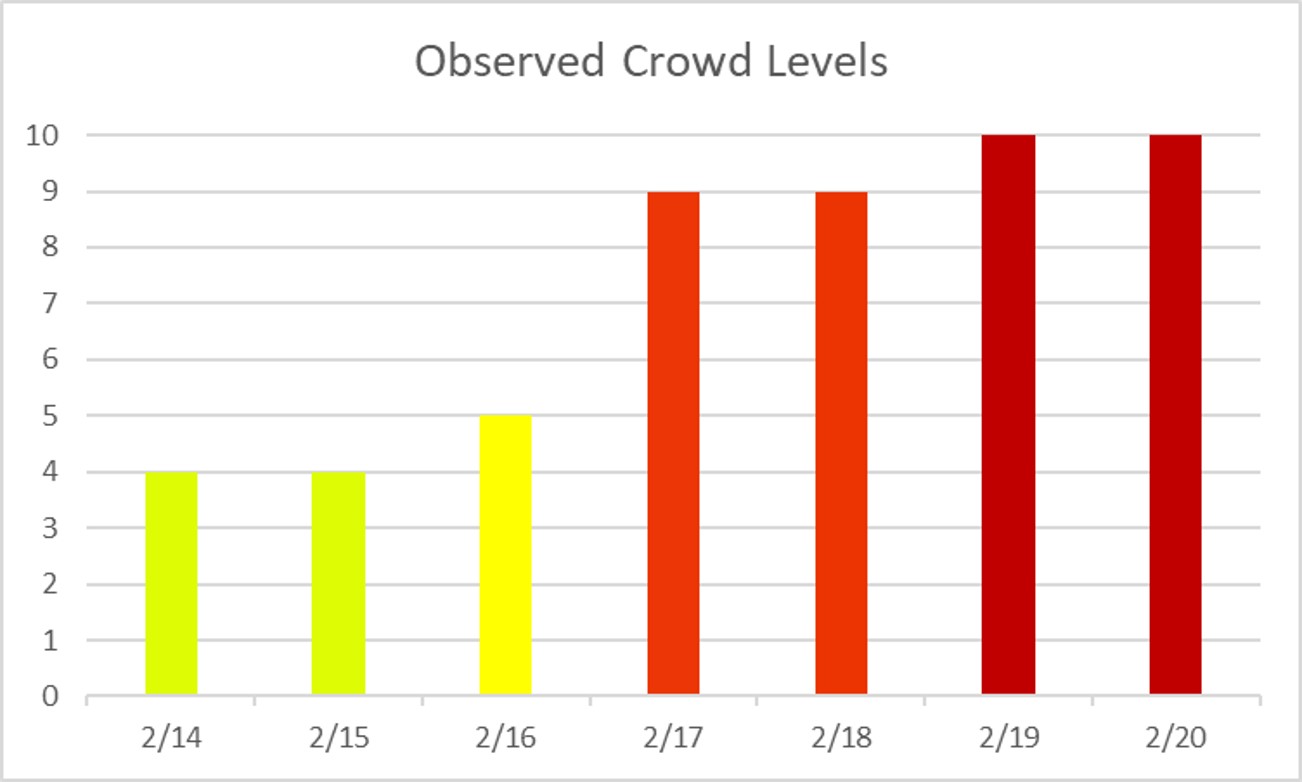
We’re going to talk a little more about Animal Kingdom when we go over the difference between TouringPlans predictions and observed crowd levels, but this graph shows the clearest difference between pre-holiday and holiday crowds. Animal Kingdom doesn’t hold its crowds well, and it is the only park to actually hit crowd level 10 any time during the week. The others have managed to hold at 8 or 9 instead.

Let’s compared that to a park that does its crowds well – Magic Kingdom. We’ve been seeing some weird spiky-ness from MK crowds over the past several weeks, but when the crowds descend and park reservations are totally sold out … things have been topping out at crowd level 8. There’s good news and bad news there. There are enough things to do in Magic Kingdom that you don’t see the bonkers crowd level 10 behavior that you do at Animal Kingdom. Instead, you get lots and lots and lots of attractions with pretty-high-but-not-crazy wait times. You can’t wander around looking at animals and avoiding all posted waits. It’s a high tide everywhere in Magic Kingdom.
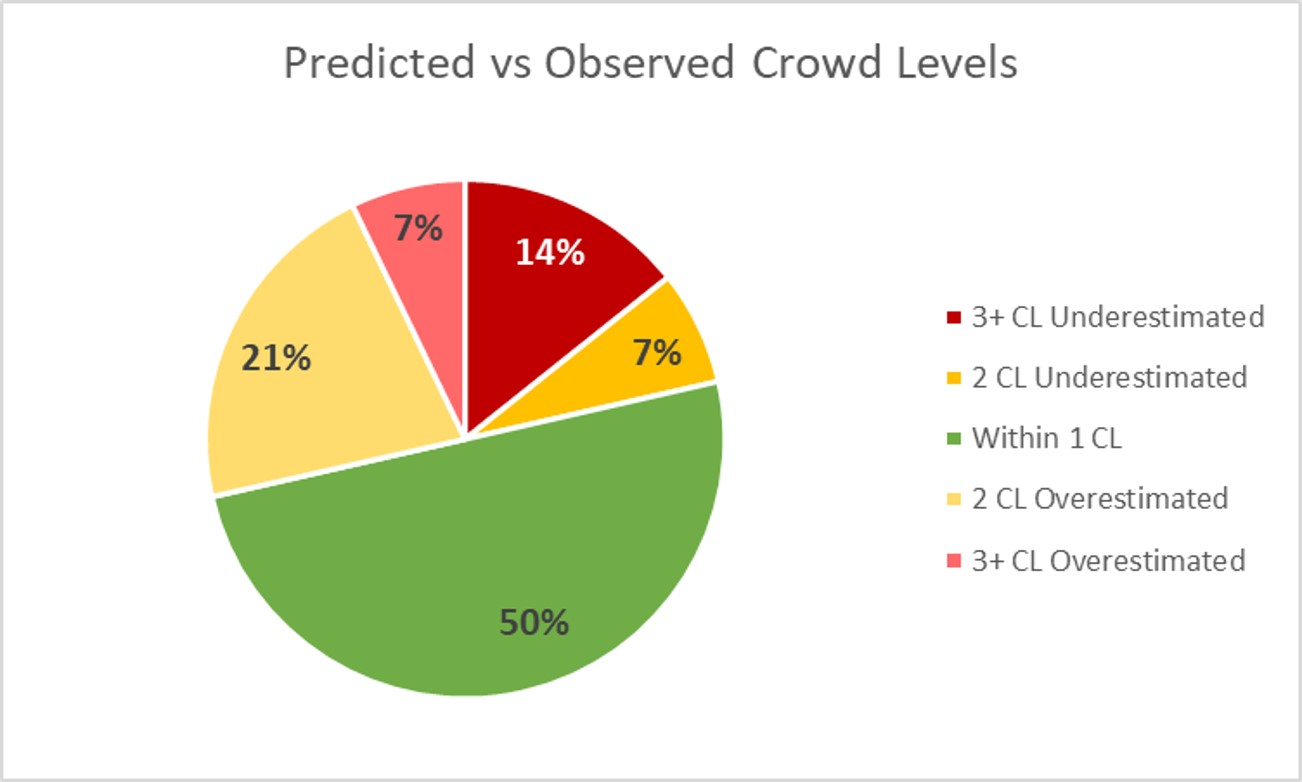
Each week, I’m giving you a very transparent look into how our crowd level predictions performed. Each day at each park is one data point, so we have 28 different crowd level predictions to evaluate each week. Any time a prediction is within one or two crowd levels, things won’t really “feel” much different than what we predicted. Being off by 3 or more crowd levels is where we’d like to be more accurate because you might feel that difference in wait times throughout the day.
In the past week, Touring Plans predictions were either spot-on or within 1 crowd level 50% of the time. This is the worst performance since I started this series – and that even includes some weeks with freak hurricanes. 78% of the time Touring Plans predictions were within 2 crowd levels, and that means we earn a C+ for our predictions this past week. This, too, is below average. The biggest miss of the week was on February 14th. On that day, crowds at Magic Kingdom were 4 levels higher than expected. The past two weeks, Magic Kingdom misses have been overpredictions, and now we’ve got a big underprediction. Magic Kingdom continues to be the most unpredictable park.
Attraction Downtime 2/14 – 2/20
If we average out all of the capacity lost due to unexpected downtime over the past two weeks, it comes out to 2.6% of attractions unexpectedly being down. Interestingly, as the crowds increase, the downtime goes back down – similar to what we saw during the holidays. The park with the biggest issues was easily Hollywood Studios, with 4.7% of its capacity lost due to unexpected downtime. This is, again, significantly lower than last week and other times with lower crowds.
The worst day for attraction downtime in the past week was on February 17th. On that day, almost 4% of all capacity at WDW was lost due to unexpected downtime. The worst park-day of the week was at Hollywood Studios, also on the 17th. On that day, 11% of the the capacity at that park was lost due to unexpected downtime. Hollywood Studios was open for 12.5 hours on those days, so 11% downtime is the equivalent of the whole park being down for almost 83 minutes each day – well over an hour of downtime for the whole park. Thankfully, this did not appear to significantly impact crowd levels, since the park came in at just one crowd level above what was expected: a 9 instead of an 8.
Attraction Downtime
The worst offender was the Rise of the Resistance, which was unexpectedly down for approximately 15% of the week. We’ve finally broken the streak of the “winner” of this category having 20% or more downtime. It’s been a while since we The worst day for the coaster was February 17th, when it was down for 33% of the day – but it was also down for 20% of the day on the 14th and 18th. This is a lot of unreliability for a popular headliner that has been – as of late – performing better than this.
Rope Drop Downtime
Here are this week’s problematic offenders:
- Magic Kingdom: Haunted Mansion (unavailable for 15% of its first hour of the day)
- EPCOT: Remy’s Ratatouille Adventure (unavailable for 25% of its first hour of the day)
- Hollywood Studios: Rock’n’Roller Coaster (unavailable for 25% of its first hour of the day), Slinky Dog Dash (unavailable for 21% of its first hour of the day), Rise of the Resistance (unavailable for 20% of its first hour of the day)
- Animal Kingdom: No rope drop downtime issues!
Like last week, Hollywood Studios continues to have the most rope drop problems. This is especially problematic at a park that has so many high-wait attractions, because rope drop is a key way to avoid some of those waits. Rock’n’Roller Coaster seems to be overdue for its refurbishment with its operational issues, and the Rise + Slinky combo should be the rope drop combo dreams are made of. The other potentially bad entry on this list is Remy, which is normally the perfect rope drop choice for folks entering from the International Gateway.
Wait Times 2/14 – 2/20
Attractions with the Highest Average Posted Wait at each park
- Hollywood Studios: Slinky Dog Dash, average posted wait of 98 minutes (89 minutes last week)
- Animal Kingdom: Flight of Passage, average posted wait time of 123 minutes (113 minutes last week)
- EPCOT: Remy’s Ratatouille Adventure, average posted wait time of 83 minutes (68 minutes last week)
- Magic Kingdom: Seven Dwarfs Mine Train, average posted wait time of 83 minutes (72 minutes last week)
Oooooooh, even with 3 days of relatively low wait times averaging things out, the highest average posted wait times are way up compared to last week. Flight of Passage was up over two hours, and Seven Dwarfs Mine Train and Remy saw 15% and 22% increases in average posted wait times, respectively.
In other big news, Tower of Terror is officially off this list. In fact, it only had the 11th-highest average posted wait time in WDW this past week, and the 5th-highest at Hollywood Studios. I think we can say pretty definitively that its stealth refurbishment has wrapped up. Hooray!
Parks with the Highest and Lowest Average Wait
These parks likely won’t change week-to-week unless something ridiculous happens, but these data points will give us a high-level view of how wait times are trending from week to week.
- Highest: Hollywood Studios, average park-wide posted wait of 48 minutes (last week 44 minutes)
- Lowest: EPCOT, average park-wide posted wait of 29 minutes (last week 24 minutes)
EPCOT retains its crown as the park with the lowest wait times overall … just barely. Technically EPCOT only beat out Magic Kingdom by half a minute. But even half a minute makes a difference. Still, Magic Kingdom is holding its crowds well, with its string of crowd level 8 days and still almost ties for the lowest average wait time.
Most Inflated Posted Wait Times
We all know that Disney inflates their posted wait times on purpose. They have many reasons for doing this. Some are totally understandable, and some are potentially more problematic. We can figure out how much posted wait times are being inflated by comparing submitted actual wait times from the Lines App and the posted wait time when the person timing their wait entered the line.
Over the past week, actual wait times in the Lines App averaged 66% of what was posted. This is ever-so-slightly above our historical average, and a couple of percentage points above what we’ve seen the past two weeks. If the posted wait time was 20 minutes, you could’ve expected to wait just over 13 minutes instead.
But the worst offender for the past week was … any guesses? Peter Pan’s Flight! It won this category three weeks in a row, took a one-week break, and now has come roaring back on a two-week tear! At this one attraction, submitted actual wait times were only 42% of posted wait times, which means that if Peter Pan’s Flight had a 60 minute posted wait, you probably would’ve waited just over 25 minutes. Less than half of what was posted. Not quite as bad as the 38% we saw last week, but still pretty terrible. Remember to always check the Lines app for predicted actual waits instead of believing what is posted.
Actual Wait Time Rock Star
The Actual Wait Time Rock Star for this past week was … Arlynn, who submitted 36 actual wait times through the Lines App over the last 7 days! This includes 16 Lightning Lane waits, 19 Standby waits, and 1 Virtual Queue wait. Thanks for your hard work, Arlynn! But you didn’t reclaim that all-time record, which is still held by shop.kgb, with 50 recorded wait times in a single week.
In the next week, we could especially use lightning lane wait times for characters. We still have very small sample sizes for those at this point. Thanks!
Looking Ahead: February 21st through February 27th
Quick reminder that I have to have time to crunch the numbers and write all of these words before you get to read them. So this will post on the 22nd when the 21st is in the past. But I’m staying as close to real-time as possible.
Now is not the time to be complacent. The worst is (hopefully) behind us with President’s Day Weekend, but the 21st is Mardi Gras and then next weekend is the Princess Half Marathon. So some families may just be arriving to enjoy the parks before the race weekend. Park reservations continue to be sold out at Magic Kingdom through Friday and at Hollywood Studios through Thursday, so you know that lots of people are planning to be in the parks.
The weather is also supposed to be hot and sunny. Like most of the rest of the country not being buried in snow, Florida is seeing an early thaw. Or as we like to call it in Missouri, false spring. It’s that tricky spring before you go back to the cold gray for a few more weeks or months. Except Orlando gets something more like false summer where you go to WDW in February expecting lovely temperatures, and instead you run a half marathon in 90-degree heat. Seriously – hydrate and rest, y’all.
You May Also Like...
-

Happy February, Disney Data fans! I have to start out this special February 8 post by giving a shout-out to my…
-

Happy February! This last week of January may eventually look, in hindsight, like the calm between the storms for several reasons.…
-

We made it past Valentines Day! I hope your day was full of chocolate and love and data. What? Not enough…
-

And we're back! It's been two whole weeks since you've gotten your dose of Disney data, and I know you've all…
Great content Becky! I plan to be in Disney for the 2nd week of March which I expect to be high crowd days and have a couple questions I was hoping to get your insights on:
1. Looking at the data, does lack of reservation availability tend to map to a particular crowd level. i.e. sold out Magic Kingdom tend to be a minimum 8 crowd level. Just wondering if I should cancel a park reservation if I see that it sells out.
2. Assuming you have hopper + Genie and it’s a high crowd day, which park would you start at and which would you hop to in order to maximize the day? If it’s helpful, assume you have young kids that aren’t great at waiting in lines that are longer than 20-30 mins. Thanks!
1. Short answer is no. I _think_ (but haven’t gone back to check the data) that a sold out day has never been lower than a 6, but it also doesn’t guarantee an 8. That being said, those 6s and 7s were back when things were more restricted. But I also don’t think it’s necessarily worth cancelling a park reservation over. You can still have a successful park day at a crowd level 8.
2. Hopper + Genie on a high crowd day with young kids. Either EPCOT or Animal Kingdom, hopping to Hollywood Studios. There are no good ways to kill a bunch of time at Hollywood Studios with young kids and without waiting a long time. So you should stack up those Genie+ reservations there. Then, do EPCOT or Animal Kingdom in the morning, just doing non-wait-y things, or otherwise avoiding the waits via rope drop or some such strategic fun.
Glad that it appears Disney got ToT back to full capacity before taking down RnRC for reburbishment. Can you imagine how much worse HS would have gotten otherwise?
So what is the Touring Plans crew speculating about Genie+’s price going forward since there was a sellout? It was going for $29 this weekend, so is $39 just around the corner?
Ehhhh … I don’t speak on behalf of the TouringPlans crew, but the Becky speculation is that they can’t keep increasing the price forever, especially with availability also not getting better.