
Disney Data Dump Oct 19 2022
What a week at Walt Disney World! We had some absolutely insane wait times (I see you, 420 minutes at Rise of the Resistance), Genie+ pricing becoming totally unpredictable (but predictably higher than $15), and a bonus storm that knocked out power at Magic Kingdom for a while. How does all of the crazy impact downtime and wait times? Let’s get into our quick review of timely Disney Data and find out! And then, we can take a look forward at things you need to know for the upcoming week if you have a trip planned.

Observed Crowd Levels 10/11 – 10/17

Continuing our trend from last week of all fall colors! The crowd levels are actually remarkably similar to what we saw last week, with one more 6 and one more 8. This is the first week we’ve seen multiple 8s, and the second week in a row with no crowd level 5 or below. We’re above-average crowds only!

Once again, Magic Kingdom is the only park that saw any crowd levels below 5 over the past week. And those were on … (say it with me) … party days! We’re not seeing crowd level one on those party days. BUT. The difference between a crowd level 8 (on, say, October 12th) and a crowd level 4 (on, say, October 13th) is over 4.5 hours of wait time during peak hours just for a selection of 11 popular attractions. That a big difference. Magic Kingdom is spiking even harder on non-party days than it has been in the past. The 17th was our first crowd level 9 for any park since we started this series. Avoid Magic Kingdom on non-party days! From now until the end of the year.

Each week, I’m giving you a very transparent look into how our crowd level predictions performed. Each day at each park is one data point, so we have 28 different crowd level predictions to evaluate each week. Any time a prediction is within one or two crowd levels, things won’t really “feel” much different than what we predicted. Being off by 3 or more crowd levels is where we’d like to be more accurate because you might feel that difference in wait times throughout the day.
In the past week, our predictions were either spot-on or within 1 crowd level 54% of the time. This is about 10% lower than it’s been for the past few weeks. Something is getting a little off. And 78% of the time we were within 2 crowd levels. That means this week we earn an C+ for our predictions this week. This is the lowest score we’ve gotten so far. On 5 different park days, we underestimated crowds by 3 crowd levels. All of those happened at EPCOT or Animal Kingdom, and on October 12th, 13th or 17th.
Looking forward to the next week, at least keep those Magic Kingdom party dates in mind. Expect high crowds there October 19th, 22nd, and 24th. And I would expect to keep seeing elevated crowds at EPCOT and Animal Kingdom too, since things are already trending that way.
Attraction Downtime 10/11 – 10/17
If we average out all of the capacity lost due to unexpected downtime over the past week, it comes out to 3.6% of attractions unexpectedly being down. This is roughly equivalent to last week, and is similar to what we saw in mid September (3.1%). The park with the biggest issues was Hollywood Studios (4.0% of capacity lost), which is different than last week! Magic Kingdom finally gets a break from being the least reliable park.
The single worst day for attraction downtime in the past week was October 17th. On that day, 9% of all capacity at WDW was lost due to unexpected downtime. That’s really high, and close to the post-hurricane reopening days! But there’s an explanation. REALLY bad storms that even knocked out some power to a lot of Magic Kingdom. And the single worst park-day of the park week was also a result of this – Magic Kingdom on October 17th. On that day, 15% of the park’s capacity was lost due to unexpected downtime. That is a huge number. Magic Kingdom had a 14-hour operating day yesterday (regular park hours). 15% downtime is the same as the entire park being down for over 2 hours. All of that downtime almost certainly had a big impact on wait times (Magic Kingdom was predicted to be a 7 and ended up a 9 – ouch!
Attraction Downtime
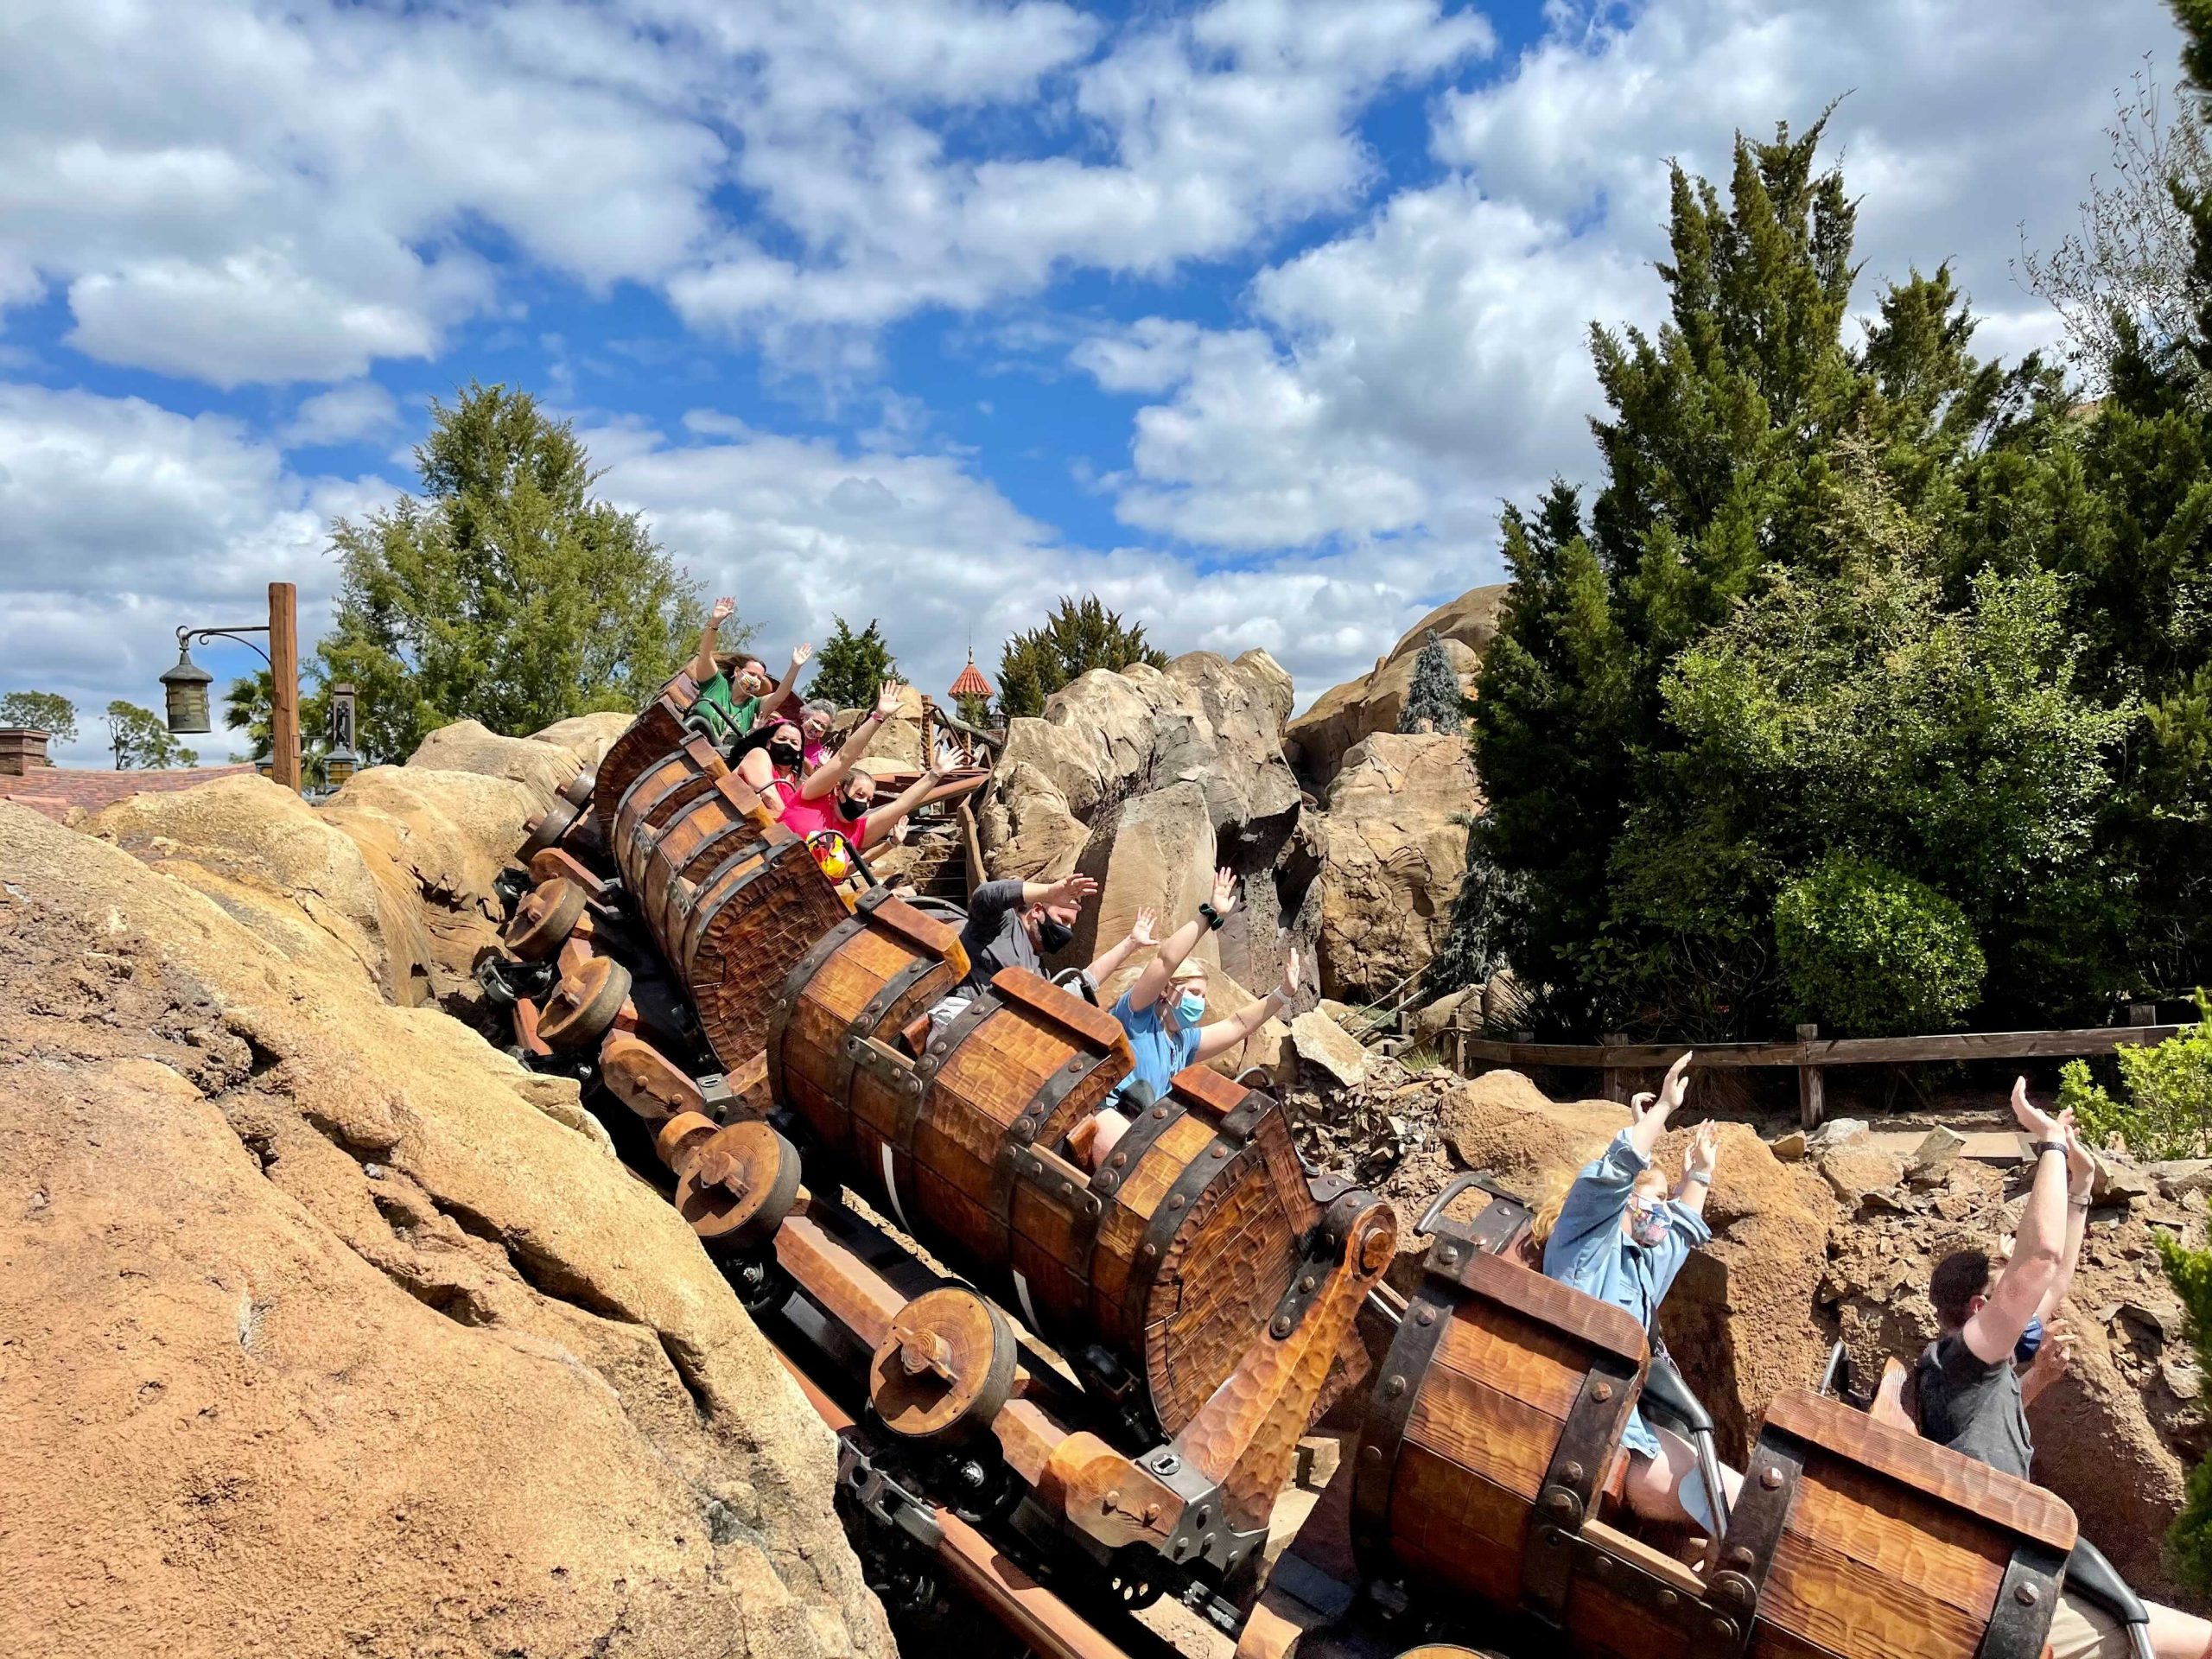
The worst offender was Seven Dwarfs Mine Train, which was unexpectedly down for over 11.5% of the week, including being down 64% of the day on October 17th. It was down in the morning, and then went down again in the storms and never came back online. Not to over-state the obvious, but that’s a not-great look for one of the biggest headliners at the most popular park. Not far behind was Test Track, which was offline for almost 10% of the week. On its worst day – October 16th, it lost 22% of its capacity. The most famous “unreliable” attraction, Rise of the Resistance, didn’t have a terrible week, and “only” lost 8% of its capacity to unexpected downtime.
Rope Drop Downtime
Here are this week’s problematic offenders:
- Magic Kingdom: Splash Mountain (unavailable for 25% of its first hour of the day), and PeopleMover (unavailable for 14% of its first hour of the day)
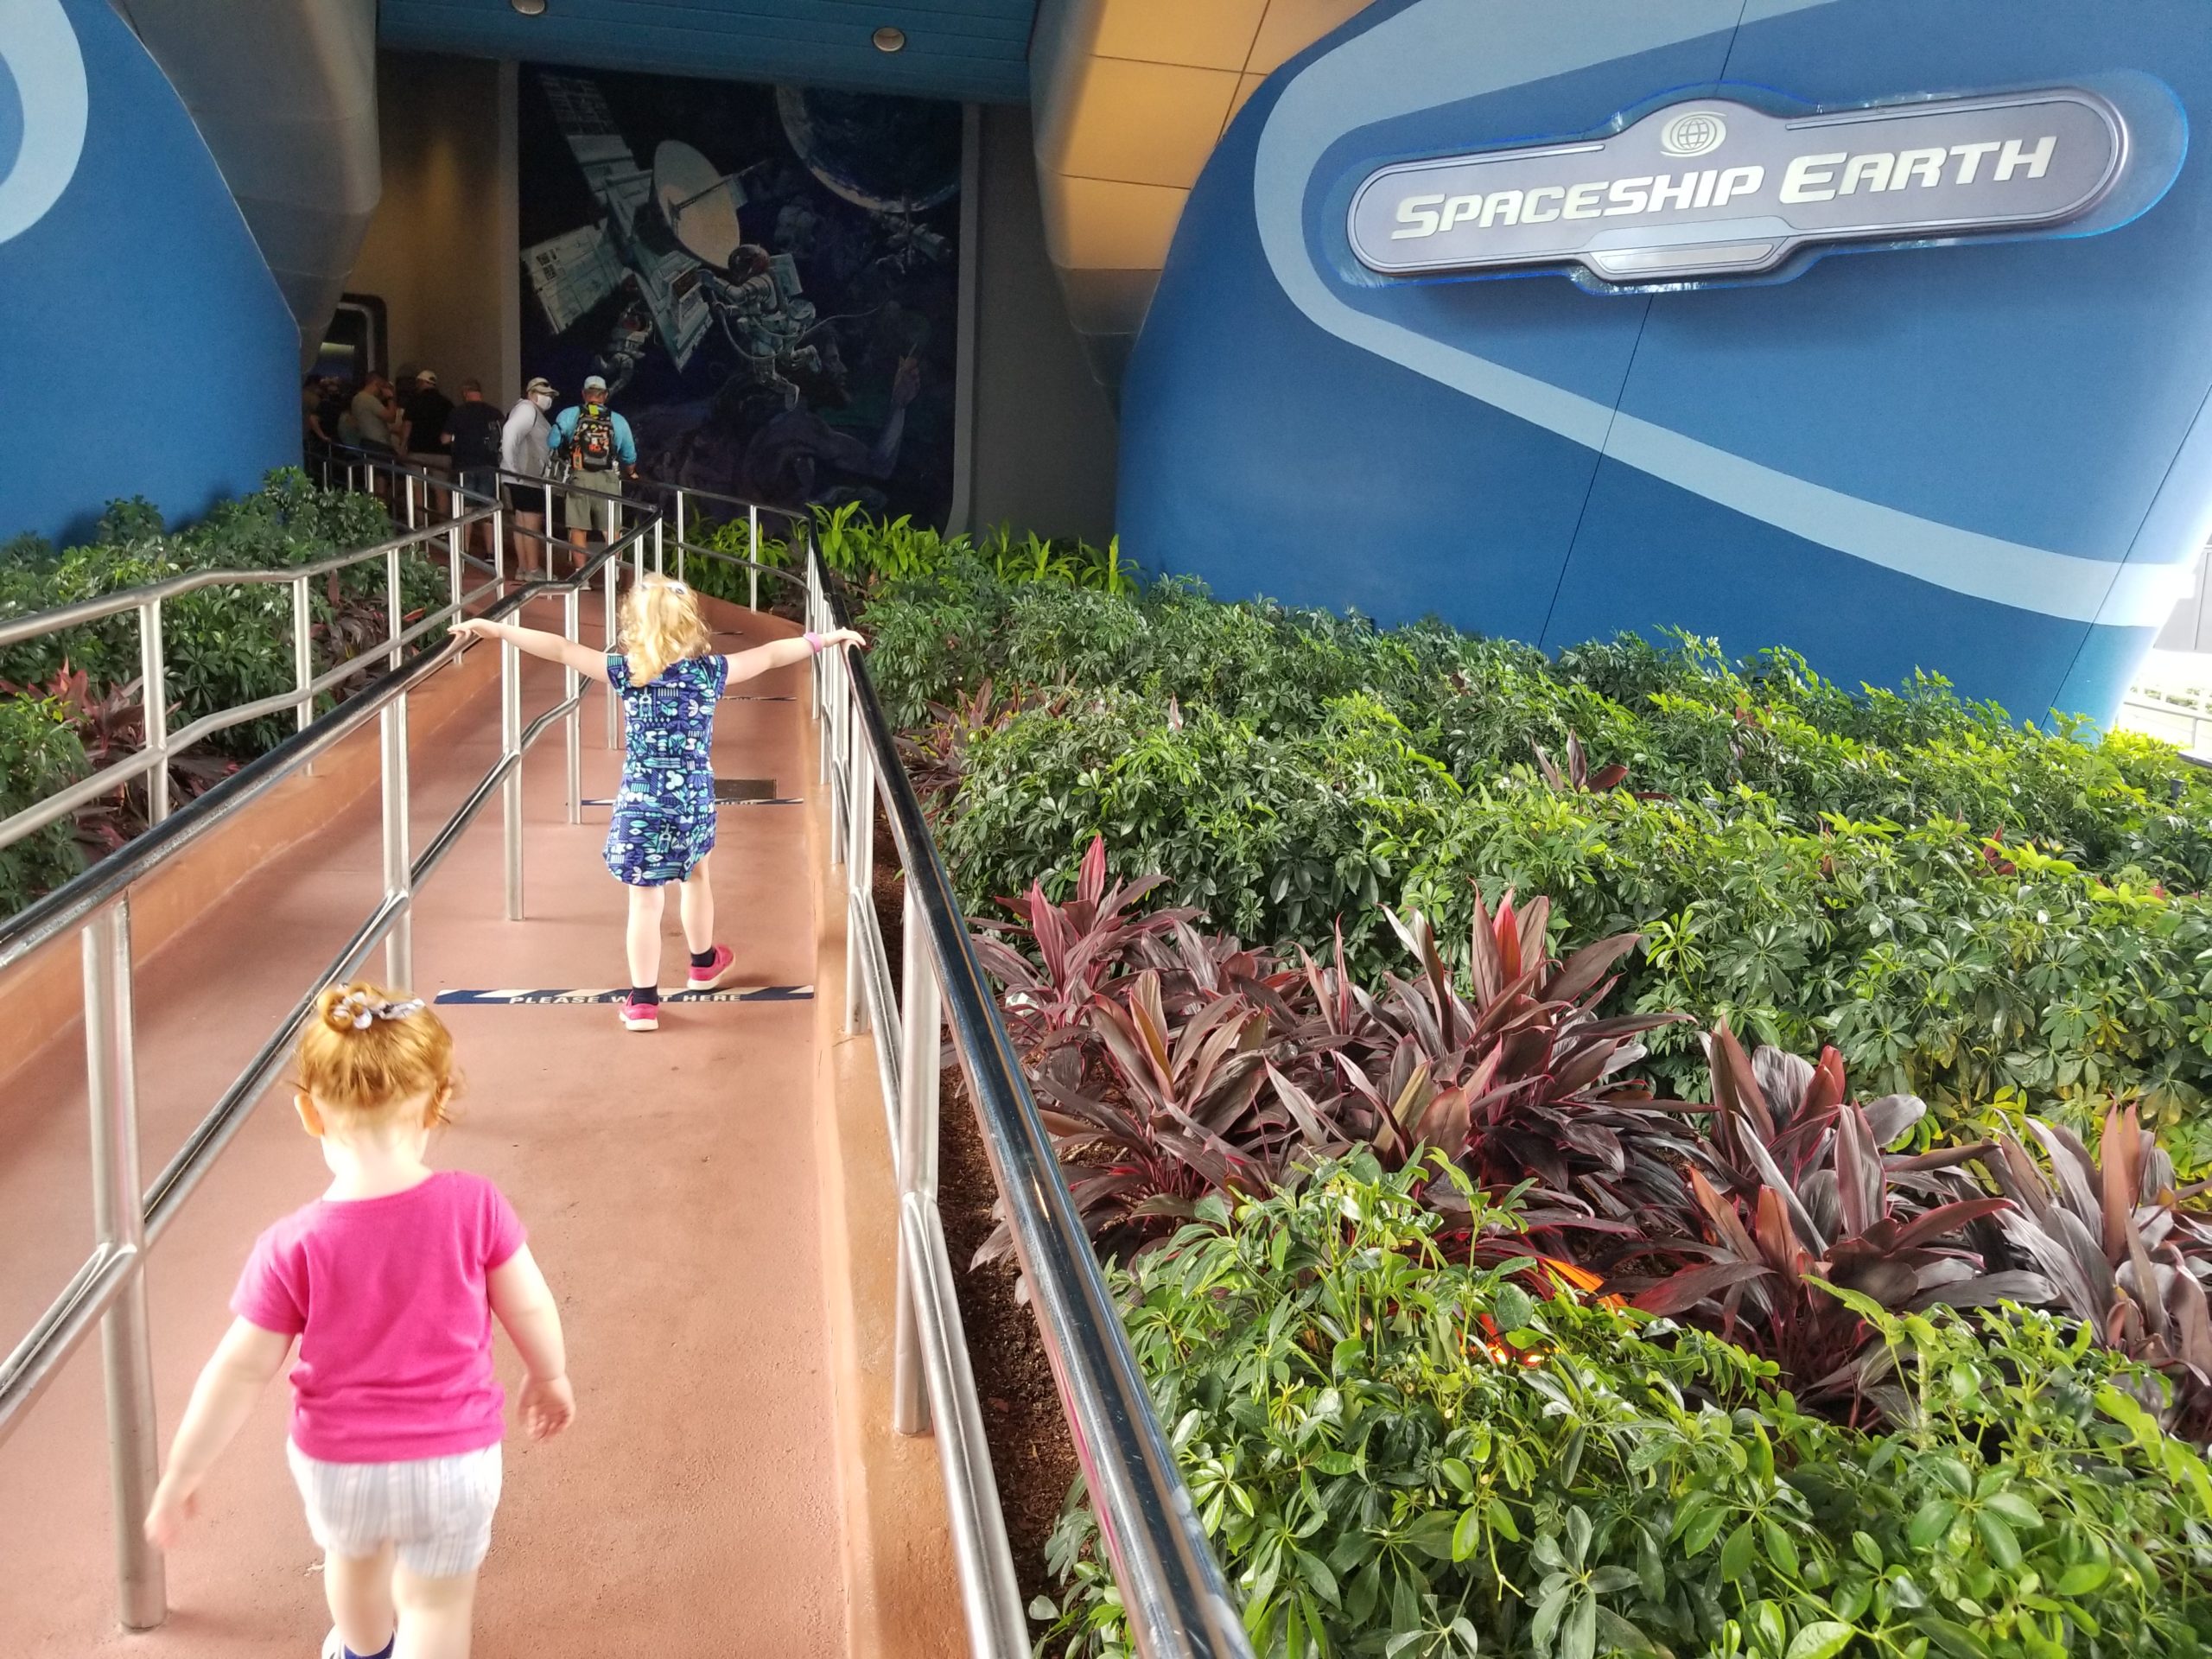
- EPCOT: Spaceship Earth (unavailable for 32% of its first hour of the day), and Gran Fiesta Tour (unavailable for 29% of its first hour of the day)
- Hollywood Studios: Runaway Railway (unavailable for 27% of its first hour of the day), and Rock’n’Roller Coaster (unavailable for 23% of its first hour of the day)
- Animal Kingdom: Expedition Everest (unavailable for 29% of its first hour of the day)
This is actually a much, much nicer picture than we’ve had the past couple of weeks. The attractions that we recommend rope-dropping are having more reliable opening hours than they have been. It’s probably not a huge deal to avoid any of these unreliable attractions first thing in the day. Instead, head to Peter Pan’s Flight and Seven Dwarfs Mine Train at Magic Kingdom. Try Remy, Frozen Ever After, or Test Track at EPCOT. Go for Rise of the Resistance and Slinky Dog Dash at Hollywood Studios, and Flight of Passage, Na’vi River Journey and Kilimanjaro Safaris at Animal Kingdom.
Wait Times 10/11 – 10/17
Attractions with the Highest Average Wait at each park
- Hollywood Studios: Slinky Dog Dash, average posted wait time of 96 minutes (93 for last week at Rise of the Resistance)
- Animal Kingdom: Flight of Passage, average posted wait time of 111 minutes (102 last week)
- EPCOT: Remy’s Ratatouille Adventure, average posted wait time of 87 minutes (77 last week at Frozen Ever After)
- Magic Kingdom: Seven Dwarfs Mine Train, average posted wait time of 68 minutes (71 last week)
After huge wait time increases last week, we’re still seeing wait times going up at most parks. The only exception is Magic Kingdom, since it has all of the party days bringing its average down. For the first time in a long time, posted wait times at Slinky Dog Dash beat those at Rise of the Resistance. And Remy took back its long-wait crown from Frozen Ever After for this week.
Parks with the Highest and Lowest Average Wait
These parks likely won’t change week-to-week unless something ridiculous happens, but these data points will give us a high-level view of how wait times are trending from week to week.
- Highest: Hollywood Studios, average park-wide posted wait of 47.5 minutes (last week 47 minutes)
- Lowest: Magic Kingdom, average park-wide posted wait of 26.5 minutes (last week 28 minutes)
Thanks to those lower-crowd party days, Magic Kingdom continues to have the lowest average wait times. And an abundance of parties this week helped bring the average even lower. And an average posted wait for every attraction at Hollywood Studios up over 45 minutes is pretty remarkable. That’s a lot of waiting.
Most Inflated Posted Wait Times
We all know that Disney inflates their posted wait times on purpose. They have many reasons for doing this. Some are totally understandable, and some are potentially more problematic. We can figure out how much posted wait times are being inflated by comparing submitted actual wait times from the Lines App and the posted wait time when the person timing their wait entered the line.
From October 11th through 17th, actual wait times in the Lines App averaged 67% of what was posted. So if the posted wait time was 20 minutes, you could’ve expected to wait just over 13 minutes instead.
But the worst offender for the week was Na’vi River Journey. At this one attraction, submitted actual wait times were 48% of posted wait times. That means if Na’vi River Journey had a 30 minute posted wait, you probably would’ve waited less than 14.5 minutes. Under half of what was posted. Remember to always check the Lines app for predicted actual waits instead of believing what is posted.

Looking Ahead: October 18th through October 25th
Since it takes time to pull data and write a post, you’ll be reading this on the 19th when the 18th is already in the past. But we’re staying as close to real-time as possible.
Last week I predicted that the crowds would level off. That didn’t really happen – wait times continued to increase. So I’ll say this week, look out for higher-than expected crowds at EPCOT and Animal Kingdom. And keep in mind that party days at the Magic Kingdom should still be at least a 7 or and 8. Hopefully not a 9 unless another storm knocks out power.
The weather this week looks pretty ideal – not a drop of rain (as of now), and really pleasant temperatures during the day. This could draw out some locals looking to enjoy the beautiful Florida version of fall. But it will also hopefully mean less attraction downtime.
You May Also Like...
-

How did park closures and airport shakeups impact crowds in the parks in the past week? And what can we expect…
-

New blog series, who dis? We know that you come to TouringPlans because of all of our data. And other than…
-

Holy crowds, Batman! Spiderman? Fall is here, and so are the beginnings of October crowds, ramping up into the holiday seasons…
-

Well, this is a fun and weird week for our second-ever Disney Data Dump! We'll see next week how Hurricane Ian…
Becky!!
Your data/analysis is the BOMB!! I fully entrusted my family’s 1st visit to WDW on 10/9/10-15 entirely to Touring Plans. We hit every single headliner at all 4 parks, a total of 49 of our top attractions (many twice) without ever waiting longer than ~15min for any single attraction (exception Magic Carpets on 10/10 actual wait 22 min vs Lines app est 12 min and posted wait 15min). I am so glad we put the effort into understanding your research and utilizing it to our advantage. My family and I are more greatful to you and your efforts for a memorable first (and last!) WDW trip. Thank you!
Tim
Love getting this feedback, Tim! Thank you for sharing, and I’m so glad that you had a great trip 🙂
The 420 wait at Rise on the 14th is really bugging me. I find it hard to believe many persons will accept a 4-6 hour wait and get on a line. I took a look at that the data from thrill data and really think there is an anomaly there where it almost feels like someone posted a standby time at Disney that included an estimated downtime for the ride. From 10:20 to 10:40 it jumped 200 minutes and then 5 minutes later another 40 minutes to get to that scary 420. The rate of people getting on a line that was already showing 180 minute wait that would have to get on to make it go to 380 just does not make sense to me.
Anyway, thanks for the stats…I am so looking forward to my next visit with my niece and her 6 year old where we purposely picked two days rated at a 2 for MK. We are going to hit EVERYTHING and do multiples.
Yeah, that was absolutely some weird fluke, It came back down to a reasonable number very quickly.
And it sounds like your next trip is going to be wonderful!
We’re planning Magic Kingdom for Wednesday, Oct 26. I picked that day since the crowd forecast has that day as a 2, even though it isn’t a party day. Why would this one Wednesday be forecast to be such an anomaly?
Love your posts! Are you keeping track of LL and ILL waits? If I see a posted wait of 70 min I can estimate my standby wait at 49 minutes. (70%). Is there a similar guideline for LL/ILL wait?
Yes-ish, but it’s less predictable. I’ve got enough data to talk about average wait savings at each attraction (updated data for that will be posting in just a couple of hours, actually). But we’ve seen FP waits from 0 minutes up to 30+ minutes (though those are more rare). I’ll see if I’ve got enough information to come up with something more helpful than that.
That’s very helpful just to know the range and I look forward to that new blog post. Thanks!
If anyone asks, “Who is doing the Peoplemover in the first hour of park opening!?”: I absolutely did that on 10/10. My wife and I did a rider swap for 7DMT and, while she waited, I took the 5 y/o and we did the Peoplemover… during Early Entry no less! So, here’s living proof that it *does* happen.
Well how about that! We, too, have done PeopleMover as our first attraction of the day once. But it was on a trip where we had morning plans and entered the park around 11.
The Touring Plans estimates were rather reliable last week, except for one notable exception. A 67 minute estimate for Slinky Dog on Friday morning turned into just under two hours. (Disney’s guess was also off, posted at 90 at the time.) By Saturday, my family was complimenting me that the time I was spending on Lines was worth the effort…
Oof, sounds like something was definitely off.
As you point out, even if/when our crowd level estimates are off, the real-time data that we gather from the parks corrects for it pretty quickly and real-time estimates tends to be more accurate. But I apologize for that awful Slinky wait!