Disney World Crowd Calendar Updates Pending
Last week we reported that the Disney World Crowd Calendar will see some crowd levels updated in the coming days. We have reviewed the first run of updates but feel that some of Disney’s park hours in December are likely to change so we are re-running our crowd level predictions with projected park hours rather than those currently listed. Crowd levels in November and December will likely see an average rise of one crowd level, especially at Magic Kingdom. There are some dates in 2016 that may see some crowd level reductions as well.
We also reported today that Disney Park attendance was up an unprecedented 15% last quarter. This report sheds some light on the remarkable spikes in wait times that we have seen this fall. Whether these increases will continue during the rest of 2015 and into the new year is yet to be seen. Interestingly, this week’s wait times are showing much more similarity to what we saw during the same week in 2014 than what we have seen in the last few months. Here is an early preview of this week’s Disney World Crowd Report.
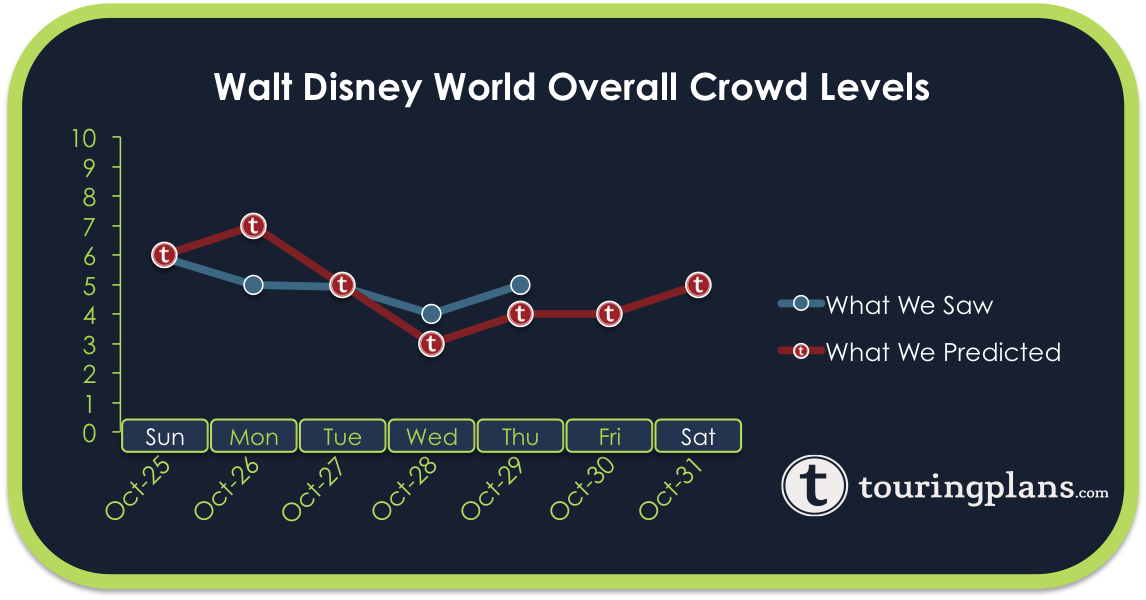
Wait times so far this week are flat compared to what we have seen during the same week in years passed. Jersey Week continues this weekend so it will be interesting to see if wait times spike or remain within range of what the calendar predicted.
You May Also Like...
-

The April Crowd Calendar update only has minor changes. We are halfway through spring break, and crowd levels have been in-line…
-
We have been holding off on doing any big Crowd Calendar updates until we saw how the crowds were in 2021.…
-

We have had a few weeks to observe the wait times at Universal Orlando Resort since the parks reopened in June.…
-
The February 2020 Crowd Calendar update is now live. So far 2020 is showing increased crowds at Walt Disney World. We…
It seems to me that much of the wailing and gnashing of teeth by Crowd Calendar users recently could be due to a casual understanding of what kind of waits the calendar actually represents. Even though you clearly cite those charts on your website, when we see a ’10’ in October, that seems ‘wonky’ to most of us ‘laypeople’ because we don’t look to see what a ’10’ means.
Plus, I don’t think we always recognize that not all ’10’s’ are created equal. All of the rides see ’10’s’ in excess of a certain time threshold. So an October ’10’ may be on the low side of that threshold, whereas a December ’10’ may see a wait time much greater than the low point of ’10’. As you’ve explained, part of what you’re determining is whether the early fall was a strange anomaly, whether time thresholds need to be adjusted, or whether we’re seeing a new reality for attendance overall at WDW at certain times of year.
I’m going in late January, another typically low time like the fall is or used to be, so I’m very interested to see what you find!
We went to WDW between last week of Jan & first week of Feb for 2004, 2005 and 2015. 2015 was much busier, but still mild crowds.
Adding +1 across the board for each park daily over the next year would help push the estimates in the right direction? Half joking, because I realize more info goes in than just attendance.
I’m also wondering since so many WDW tip sites advise against going on EMH days, will we start seeing the numbers actually drop at those parks? Some days look that way to me *unsure*
I’ve said it before and I’ll say it again. Until the Crowd Calendar can predict actual crowds, instead of crowds based on wait times, it will have little usefulness for us. When we first started using the Crowd Calendar several years ago, there seemed to be a good correlation between wait times and number of people in the parks. Based on our solely anecdotal experience, that correlation has now fallen apart.
Case in point: First and second Saturdays of Food & Wine this fall. Real crowds were much larger than the predicted “crowds” based on wait time data. We also experienced larger than predicted crowds at MK.
Thanks for your feedback, Lee. As you can see, we’re always open to suggestions on how to improve the calendar’s accuracy. If you have a sec, send me an email with ideas on how to measure and verify actual crowds: len@touringplans.com. Thanks again!
Not sure how you would measure and verify actual crowds, short of somehow getting WDW’s gate numbers or installing surreptitious electronic people counters at the gates yourselves :).
One thing you might consider, in order to avoid future confusion over what exactly the “crowd” calendar actually measures, would be to rename it the “wait time” calendar.
It makes sense that the TP crew would want to present the most accurate numbers for December, but it makes it very nerve-wracking for those of us who are about to go on a Disney trip to know that we’re working with less than accurate touring plans. Is there no way to update November’s calendar while you are working on revising crowd levels for December?
Don’t worry Nathan, just because we are working on an update doesn’t mean that the current calendar is less accurate. In fact, you may find that your touring plans don’t change that much after the update. The touring plans choose the order of attractions based on each attraction’s relative wait time. Even though a day might be more crowded the wait times tend to relate to each other the same way.
We leave in 5 days – any chance there will be updates by Friday? Wondering if my current touring plans will be accuate and would like to update before we are in the parks, if possible. Thanks!
We should have updates out within 24 hours – just checking on DHS and AK. We’re doing a day-by-day check of the new predictions, and some of those look wonky, possibly because of Tower of Terror and other issues. Adjusting shouldn’t take too long.
Great – thanks!
Is there an issue with Tower of Terror that I have missed?
So not to be Spinal Tap snarky, but does TP need a higher number level for the really bad times, e.g., last two weeks of the year?
I feel like a 10, especially with a newer system, doesn’t really convey the crowd levels at certain times if a 10 will be used for other times as well.
Jane, I agree. We experienced an unexpected 10 at MK in August (predicted to be a 9). I have never been to WDW on Christmas Day, New Year’s, etc., but I’ve seen pictures of the crowded walkways and so forth on those days. I have a very hard time believing that the 10 we experienced was anything like the 10s on those kinds of days.
We are not changing the definition of the scale, just updating predictions based on the latest trends.
I have asked before and was told that they account for these events, but I think this year, more than ever people took advantage of this Free Dining promo and the surge of attendance can largely be placed on this event. The day that the promo went live it shut down the Disney call center. Some people including travel agents were on the phones for several hours getting the promo added to existing reservations or helping new clients. This translated into almost impossible to get ADR’s for these time periods. I also think that more and more people are doing comprehensive research, using sites like this, and have heeded advice that they have heard about these once “slow” seasons and have taken there trips during these time periods that would never have thought to have done so before. Could this have been foreseen? Maybe not. But there is just too much to support what happened this fall and a tweak should have been made to the forecast months ago.
Thanks Eli but what you are describing for Free Dining has happened for many years without the corresponding spike in wait times. To be convinced that Free Dining was the culprit I would need to see evidence that this year was significantly different. For example, a new mass marketing campaign or a change in the program that favors the customer.
We have hundreds of thousands of subscribers and track our numbers daily. If more than the usual number of people we researching their trips we would notice a change. We also don’t see anything from google analytics that would suggest more than the usual traffic for Disney vacation research.
There must be other factors at play here.
If anything the free dining promotion should have had less of an impact this year compared to prior years. It was a limited promotion this year with many fewer rooms qualifying for free dining. The phone lines are a disaster every first day of a new promotion so that is nothing new.
Actually it seems the inventory released for free dining is getting to be less and less, as are the room only discounts and percentage offered, which says to me more people are already booked and they have little need to offer discounted rooms. By the time they got to passholder discounts this fall, they were practically non existent.
More and more people are booking months ahead of time ‘expecting’ to be able to add the promotions later, but if the rooms are all booked, Disney will have no reason to give discounted rates.
We were in WDW at the start if the crazy fall season in early Sept and I don’t think there was a way to predict the madness that followed. Outside of the lack of dining reservations and the difficulty to get and change FPs, there wasn’t much historical data to support the spike. I look forward to the updates, fear what the next few weeks of November will look like, and will look to the future! I’m curious if this is the new norm or a fluke year! October has seemed to be trending up the last few years but the 2015 spike seems astrinomical!
The 15% increase is a bit overstated as there is an extra week in Disney’s fourth quarter. Adjusting for the extra week the increase is still material, but at 7%. Additionally, Disney stated that Disneyland’s 60th Anniversary was a driver for this increase. Thus, I would assume Magic Kingdom would see a larger increase than Len’s previously speculated 2%, but doesn’t look to be the sole reason for the 12% increase in waits in Sept & Oct vs. previous year. Still looking forward for the results of the analysis…
Agreed. Be honest don’t try to shoe horn what was said to fit your agenda. I am a customer of yours. I understand that things change and that predictive models are not perfect but your crowd calendar is broken. You should not try to make the news fit your agenda. I am not upset with you I appreciate all your hard work and believe there is value to my money with your site. Just don’t insult my intelligence.
I am really looking forward to seeing the updates soon. Our trip for the beginning of December is quickly approaching and the times projected on my customized touring plans seem a bit off compared to what I’ve been seeing. It will be great to get more accurate predictions so that I can work on finalizing our itinerary.