Disney World Crowd Report – October 19 to 25, 2014
A good week for predictions at Walt Disney World with our only misses coming at parks where we saw lesser crowds than expected. The schedule for Mickey’s Not-So-Scary Halloween Parties continues to drive crowds in and out of the Magic Kingdom depending on the day. We saw some low wait times last week, particularly at Disney Hollywood Studios and Animal Kingdom.
Let’s look at how the crowd levels stacked up each day last week on the Touringplans.com Disney World Crowd Report:
| WHAT WE THOUGHT |
WHAT WE SAW |
ANALYSIS | |
|---|---|---|---|
| Magic Kingdom |
4
|
4
|
Mickey’s Not-So-Scary Halloween Party at Magic Kingdom kept wait times low enough during the day to make that park Sunday’s best park, as predicted. We saw high waits at Disney Hollywood Studios including a 24-minute average posted time at Great Movie Ride (predicted 11). |
| Epcot |
6
|
5
|
|
| Hollywood Studios |
6
|
8
|
|
| Animal Kingdom |
6
|
6
|
|
| WHAT WE THOUGHT |
WHAT WE SAW |
ANALYSIS | |
| Magic Kingdom |
7
|
8
|
The Studios and Magic Kingdom switched places on Monday with the former hitting higher waits like 54 minutes at Peter Pan’s Flight (predicted 49) while the Great Movie Ride averaged 17 minutes (predicted 21). |
| Epcot |
5
|
5
|
|
| Hollywood Studios |
7
|
5
|
|
| Animal Kingdom |
6
|
4
|
|
| WHAT WE THOUGHT |
WHAT WE SAW |
ANALYSIS | |
| Magic Kingdom |
3
|
1
|
A big drop in average wait times across most attractions on Tuesday compared to the first two days of the week, as predicted. The two Kingdoms had particularly low wait times like 17-minute averages at Space Mountain (predicted 25) and Kilimanjaro Safaris (predicted 29). |
| Epcot |
6
|
5
|
|
| Hollywood Studios |
5
|
4
|
|
| Animal Kingdom |
5
|
2
|
|
| WHAT WE THOUGHT |
WHAT WE SAW |
ANALYSIS | |
| Magic Kingdom |
6
|
6
|
On Wednesday, low waits at The Studios and Animal Kingdom pushed the resort wide crowd level two levels lower than predicted. The biggest surprises were a 12-minute wait at Great Movie Ride (predicted 17) and a 12-minute wait at Kilimanjaro Safaris (predicted 34). |
| Epcot |
4
|
5
|
|
| Hollywood Studios |
6
|
2
|
|
| Animal Kingdom |
4
|
1
|
|
| WHAT WE THOUGHT |
WHAT WE SAW |
ANALYSIS | |
| Magic Kingdom |
3
|
2
|
We correctly predicted that Epcot would be the most crowded park on Thursday however the difference between park crowd levels wasn’t as large as expected. We were also correct that Magic Kingdom would have the lowest level. |
| Epcot |
7
|
5
|
|
| Hollywood Studios |
6
|
4
|
|
| Animal Kingdom |
5
|
4
|
|
| WHAT WE THOUGHT |
WHAT WE SAW |
ANALYSIS | |
| Magic Kingdom |
4
|
4
|
Good predictions at all four parks on Friday. Jungle Cruise was 31 minutes (predicted 29), Test Track was 63 minutes (predicted 73), Rock ‘n’ Roller Coaster 51 (predicted 58) and Expedition Everest was 24 minutes (predicted 27). |
| Epcot |
5
|
6
|
|
| Hollywood Studios |
7
|
7
|
|
| Animal Kingdom |
6
|
5
|
|
| WHAT WE THOUGHT |
WHAT WE SAW |
ANALYSIS | |
| Magic Kingdom |
6
|
7
|
Another good day of predictions on Saturday. It was the busiest day at Magic Kingdom since Monday with average wait times like 55 minutes at Peter Pan’s Flight (predicted 47) and 42 at Space Mountain (predicted 48). |
| Epcot |
5
|
5
|
|
| Hollywood Studios |
7
|
8
|
|
| Animal Kingdom |
7
|
6
|
|
| October 26 to November 1, 2014 |
|---|
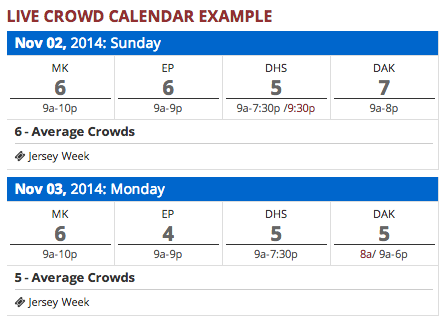
In the next few weeks we can expect the Halloween festivities to peak and then fade, leading into the moderately crowded November season. Watch out for Jersey Week and Thanksgiving but otherwise enjoy the cooler temperatures and the manageable crowds.
To see Walt Disney World Crowd predictions for the days of your vacation, check the Crowd Calendar.![]()
To get details about our predictions of future crowds or details about crowds in the past check out the Crowd Calendar and select “Jump to Date” on the left margin.
You May Also Like...
-

This weekend will have the longest park hours since Walt Disney World re-opened in July. Extended park hours are a signal…
-
The April Crowd Calendar update only has minor changes. We are halfway through spring break, and crowd levels have been in-line…
-
We have been holding off on doing any big Crowd Calendar updates until we saw how the crowds were in 2021.…
-

The February 2020 Crowd Calendar update is now live. So far 2020 is showing increased crowds at Walt Disney World. We…