Disneyland Resort Crowd Report – October 19 to 25, 2014
Crowds remained low all week then spiked significantly on Saturday. We saw wait times well below average most days mixed in with a few attractions that saw some variation in wait times. Disney California Adventure had a string of days from Monday through Friday at a level ‘2’ on our scale.
Let’s look at how the crowd levels stacked up each day last week on the TouringPlans.com Disneyland Resort Crowd Report:
| WHAT WE THOUGHT |
WHAT WE SAW |
ANALYSIS | |
|---|---|---|---|
| Disneyland Park |
6
|
6
|
Disney California Adventure saw wait times lower than usual on Sunday, including an average posted time of 29 minutes at Soarin’ Over California (predicted 35) and 68 minutes at Radiator Springs Racers (predicted 96). |
| Disney California Adventure |
6
|
4
|
|
| WHAT WE THOUGHT |
WHAT WE SAW |
ANALYSIS | |
| Disneyland Park |
5
|
4
|
Low crowds at both parks on Monday. We saw average wait times such as 32 minutes at Indiana Jones Adventure (predicted 34) and 18 minutes at Tower of Terror (predicted 24). |
| Disney California Adventure |
5
|
2
|
|
| WHAT WE THOUGHT |
WHAT WE SAW |
ANALYSIS | |
| Disneyland Park |
3
|
5
|
We predicted ‘3’s at both parks on Tuesday and weren’t far off. Disneyland came in two steps higher with waits like 19 minutes at Big Thunder Mountain (predicted 14) while Disney California Adventure came in one step lower with waits like 18 minutes at Soarin’ Over California (predicted 20). |
| Disney California Adventure |
3
|
2
|
|
| WHAT WE THOUGHT |
WHAT WE SAW |
ANALYSIS | |
| Disneyland Park |
3
|
3
|
The lowest combined crowd of the week happened on Wednesday. Astro Orbitor averaged a 13-minute posted time (predicted 14), Matterhorn Bobsleds 13 (predicted 23) and Toy Story Midway Mania 23 (predicted 33). |
| Disney California Adventure |
3
|
2
|
|
| WHAT WE THOUGHT |
WHAT WE SAW |
ANALYSIS | |
| Disneyland Park |
3
|
5
|
Thursday’s crowd at Disneyland park was slightly higher but not the highest of the week. Disney California Adventure saw wait times at a level ‘2’ on our scale for the third day in a row. |
| Disney California Adventure |
2
|
2
|
|
| WHAT WE THOUGHT |
WHAT WE SAW |
ANALYSIS | |
| Disneyland Park |
4
|
4
|
We correctly predicted that Friday’s crowd at Disneyland Park would be a ‘4’ on our scale. Disney California Adventure’s wait times were a couple steps lower. Mr Toad’s Wild Ride averaged a 13 minute posted wait (predicted 14) and Soarin’ Over California averaged 21 minutes (predicted 28). |
| Disney California Adventure |
4
|
2
|
|
| WHAT WE THOUGHT |
WHAT WE SAW |
ANALYSIS | |
| Disneyland Park |
7
|
9
|
Wait times spiked significantly at Disneyland Park on Saturday. We saw average posted wait times like 45 minutes at Alice in Wonderland, 50 at Finding Nemo Submarine Voyage and 23 at Buzz Lightyear Astro Blasters, all of which translate to a ’10’ out of ’10’ on our scale. |
| Disney California Adventure |
5
|
5
|
|
| October 26 to November 1, 2014 |
|---|
Halloween crowds will peak, then fade and moderate November crowds will take their place.
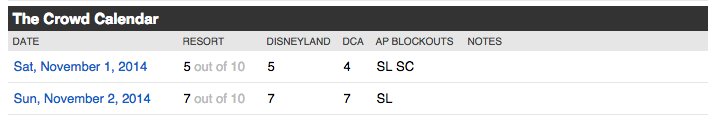
To see Disneyland Resort Crowd predictions for the days of your vacation, check the Crowd Calendar.![]()
To get details about our predictions of future crowds or details about crowds in the past check out the Crowd Calendar and select “Jump to Date” on the left margin.
You May Also Like...
-

It is time for an update to the Disneyland Resort Crowd Calendar. Crowds Since Galaxy's Edge Opened Crowd levels have been…
-

Disneyland is Opening! On April 30, 2021, Disneyland will reopen to Californians for the first time since March 13, 2020. The…
-
Since September 1, 2019, crowds at Disneyland Resort and Universal Orlando Resort have been down compared to the same time in…
-

Today we are pushing a quick update to Crowd Calendar forecasts for Disneyland Resort. These are to reflect the lower weekend…