New Charts! Restaurant Satisfaction Over Time
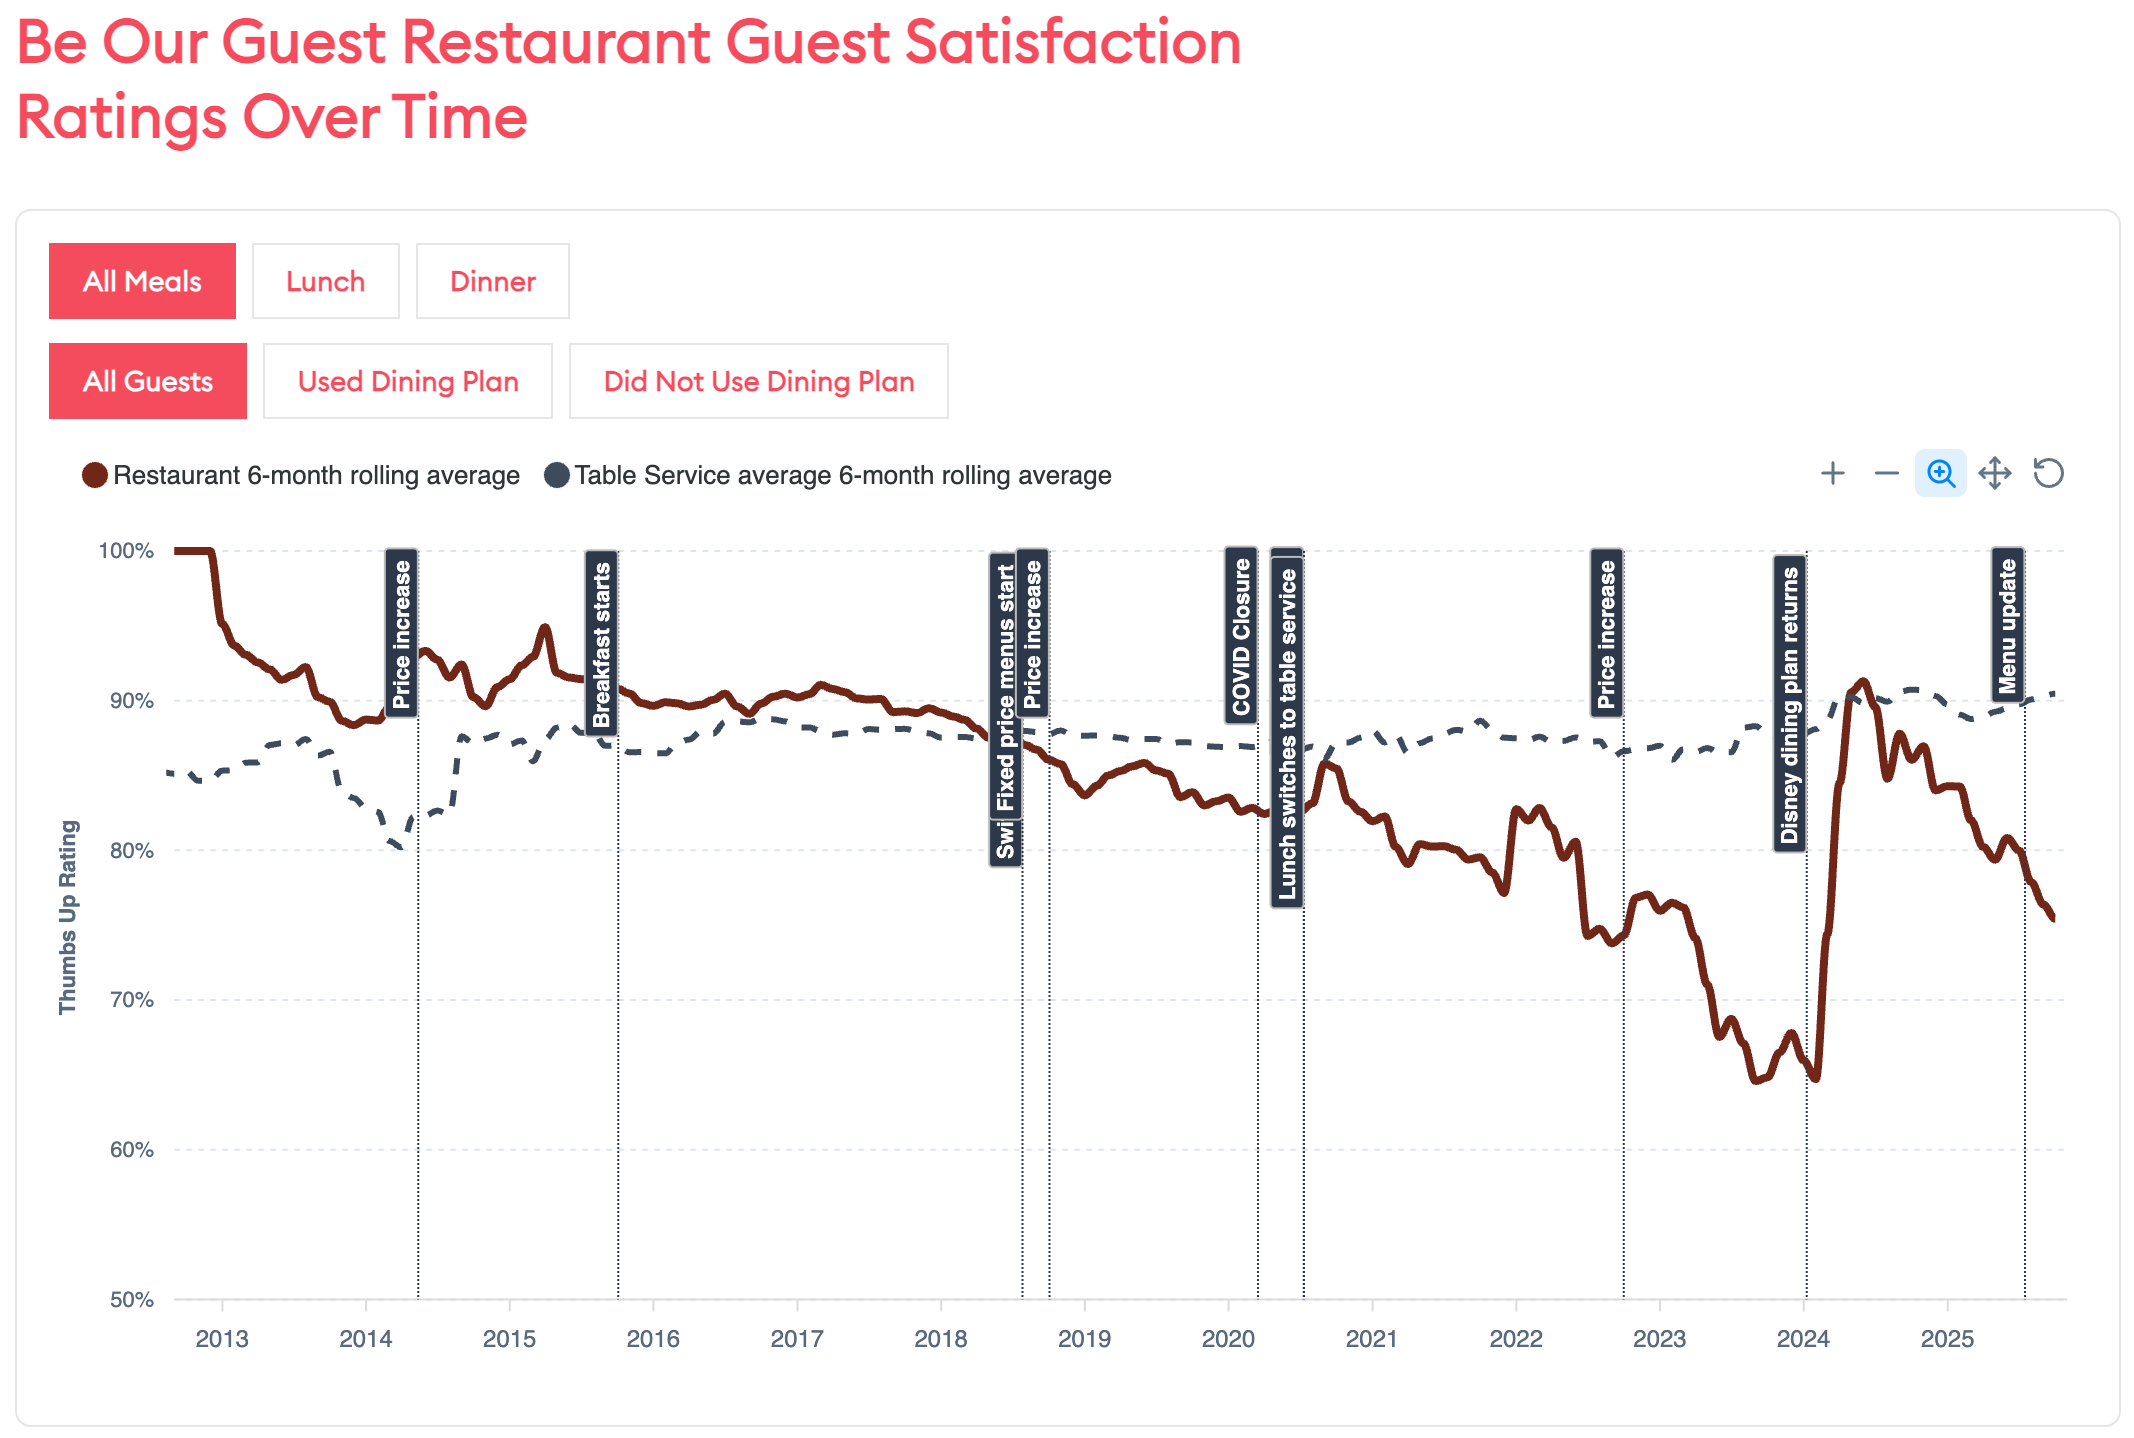
Today we’ve released new charts showing each Disney and Universal’s restaurant survey ratings over time. Here’s an example for the Magic Kingdom’s Be Our Guest restaurant in Fantasyland:
These charts have a number of options for you to use:
- Filter by Meal Type Shows the survey results we’ve got for different meals the restaurant serves
- Filter by Dining Plan Use Shows the survey results for guests who say they used the Disney Dining Plan and those who did not
The charts also contain the usual zoom in/out, pan, and reset controls in the upper right corner.
Timeline Events That Affect Restaurant Satisfaction
You’ll notice that Be Our Guest’s chart has labeled, vertical lines at specific dates in time. Those represent major events in a restaurant’s history that may affect guest satisfaction. For example, there’s a huge jump in guest satisfaction immediately after the Disney Dining Plan was reintroduced in 2024.
We’ve captured hundreds of these events for Disney and Universal restaurants for our new charts. We think this will help you understand why a restaurant’s ratings change over time. Significant events that we’re tracking include:
- Menu updates affecting 4 or more items
- Price changes
- Meal service changes, such as adding or removing breakfast service
And we’ve captured one-off events like Victoria & Albert’s Michelin star awards as well. Let us know in the comments below if there’s a specific kind of event you’d like to see watched.
Further Chart Adventures
We’ve recently added charts showing typical Lightning Lane distribution times, by crowd level, for both “day-of” and 1 to 21 days in advance, along with data on day-of Lightning Lane drops. Those charts include customizable controls allowing you to see odds that Lightning Lanes will run out at any specific time of day.
We’re also adding “best days to visit” charts to each park, based on time of year and events like Mickey’s Not So Scary Halloween Party. And we’re adding hotel satisfaction charts that’ll show key events affecting guest satisfaction as well.
Let us know in the comments below if there’s anything else you’d like to see with these data!
You May Also Like...
-

As we're adding charts to the site that show a restaurant's satisfaction ratings over time, I noticed that satisfaction numbers for…
-

Arguably the best Easter egg creation in the history of Walt Disney World is currently on display at the Contemporary Resort.…