
2021 Universal Orlando Crowd Calendar Retrospective
As January comes to a close, it’s time to finish up our series on the 2021 performance of our Crowd Calendars. We’ve spent the last three weeks digging into Disney’s Parks, and today we’ll turn our eyes towards Universal Orlando Resort. For Disney’s parks we’ve been seeing On Target accuracy of about 55-65%. Will we see the same thing at UOR? Let’s look into the numbers and find out!
January, February, March
Since we’re going to see one for each month of the year, I’ll take a minute to introduce the visuals. The chart for each month below contains 6 calendars: each of Universal Orlando’s two parks has a set of heatmaps showing the predicted and observed crowd levels, and the error. On Target predictions (+/- 1 of prediction) are not colored in the error heatmaps, but to avoid giving the idea that errors in one direction are “good” these charts are colored in orange and purple. Of course, for quality control purposes all error is bad, but the reality is that most people would very much prefer to find an overprediction, where crowds are lighter than expected. So underpredictions are represented as negative numbers here, matching our expectation that visitors will think about them negatively.
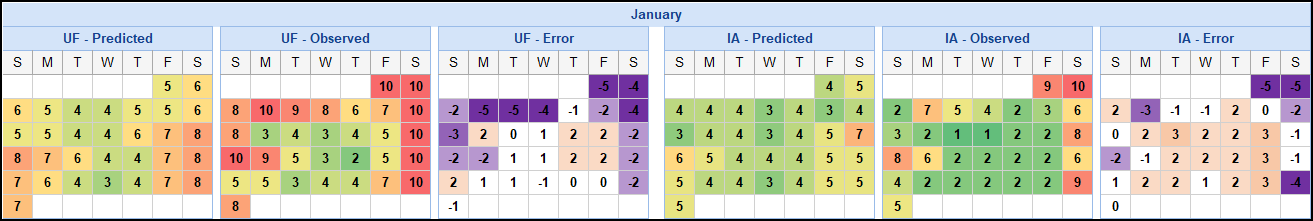


Ouch. It’s true that partly colored charts like these error heatmaps tend to give a biased impression, making any error really pop out. But those do not look good. To be fair to us, we knew — we released crowd calendar updates in January, where we said we would continue to make frequent smaller updates, and then March, and March again. In the second March update, after failing to bring our forecasts in line despite repeatedly raising them, we said this:
Never in our near-20 year history of predicting crowds have we seen a resort post 17 days in a row with one or more parks at a level ’10’ … So, today we are posting another update to the Universal Crowd Calendar. There just isn’t any good reason to predict a crowd level less than a ‘9’ for the foreseeable future – at least through mid April.
It’s only speculation, but there are a few things that I can think of that might have been helping to drive those massive crowds. To get the proper context we need to go back to 2020, when Universal released a very popular Florida Resident ticket promotion in the fall: a single-day ticket with unlimited returns through Dec. 24, 2020. During that time we saw high crowds at UOR during weekends and much lower crowds on weekdays.
That pattern continues in January, and in fact if you look across both parks you can see that we are consistently underpredicting on weekends (even with the jump in weekend predictions that we put in place mid-month!) and overpredicting on weekdays. Across town at Disney World we see the opposite: lower than expected crowds on weekends, based on Disney’s ticket pricing. Recall also that while Disney was still allowing renewals of Annual Passes, they had not been selling them since the parks’ reopening and had angered some Florida resident passholders by not automatically stopping monthly payments when the parks shut down.
It’s important to remember that our crowd levels forecast wait times and not attendance, so these high numbers are partly reflecting reduced attraction capacity. But it’s not hard to draw a picture where locals who may have let their Disney World APs lapse took advantage of the fall ticket promotion and then switched their patronage to Universal instead, buying UOR APs when the ticket promotion ran out and continuing to swell the weekend crowds at Universal Studios and Islands of Adventure. The case for this kind of thinking gets even stronger when you remember that UOR did not have a reservation system for entry. Although access wasn’t really an issue in January and February, there’s no question that needing to make a Park Pass just feels like an extra barrier.
As we head into February we start to see crowds mid-week as well, and by March crowds are hitting 9 or 10 almost every day of the week. At this point it’s not just annoyance with Disney’s reservation system playing a role, as Park Passes are sold out at all four Disney parks during most of the spring break period in March. It seems certain that these record numbers are partly due to a large number of guests who might have gone to Disney World in other years, but simply can’t get in at this time in 2021.
April, May
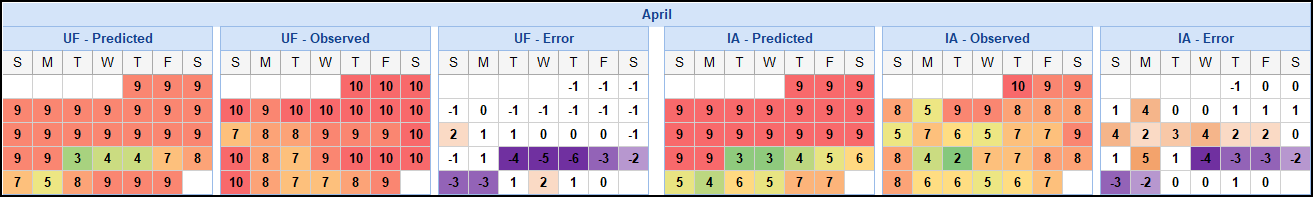
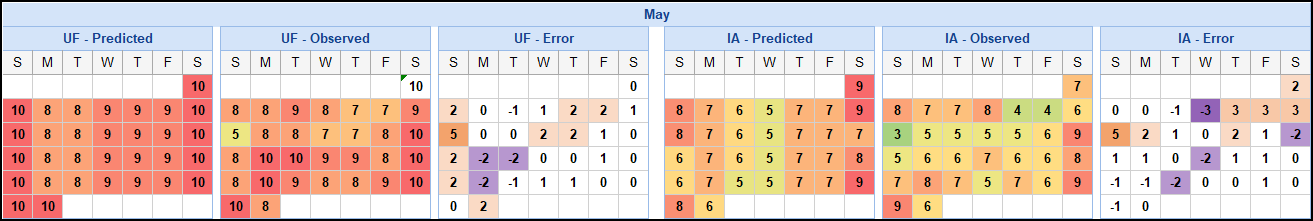
In the beginning of April everything looks good; when you forecast a 9 every day and the scale only goes to 10, it does tend to cut down on underpredictions. Hey, surrendering our position that “this can’t keep going on forever” turned out to be a smart move! Can you see the last date that those mid-March updates applied to in April? I can, although in the previous week it actually did look like crowds might be starting to drop some. Only a few days later we released another update, changing the forecasts to be in line with March numbers through the end of June.
June

Park Passes are still unavailable most days at Disney World as we move into June and schools begin to let out, and we can see levels at Islands of Adventure starting to hit 9 and 10 with regularity as well as they soak up the excess demand. Some of the rise at IoA may also be driven by the opening of the Jurassic Park Velocicoaster on June 10; the opening of a new attraction can initially present a forecasting challenge even if it’s not the middle of a pandemic.
It’s actually quite interesting to compare wait time patterns between Disney and Universal in June. In late May and early June, both resorts began removing or easing social distancing measures and increasing attraction capacity. At Disney, this actually led to lower crowd levels because there weren’t matching increases in park capacity; wait times shrank because lines moved faster. In contrast, Universal went to full capacity in mid-June, and crowd levels held steady.
July

Our mid-April update only bumped everything to the max at Universal Studios through the end of June. At the end of the first week in July, we released an update that extended these high forecasts through June and raised predicted levels for Islands of Adventure as well. Apparently we did not raise them enough at IoA as this park continues pegging the meter with the high crowds that we first saw in June.
August, September
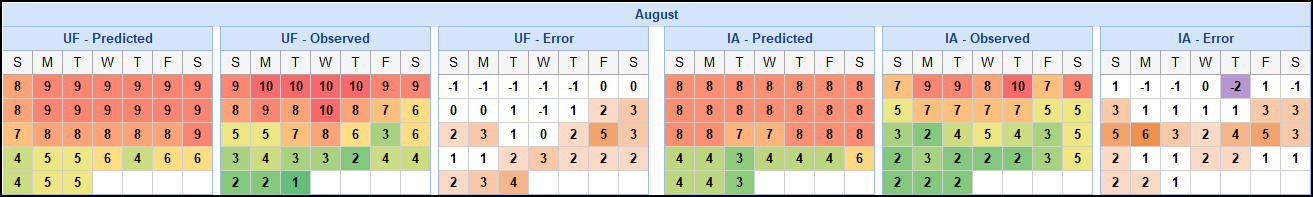
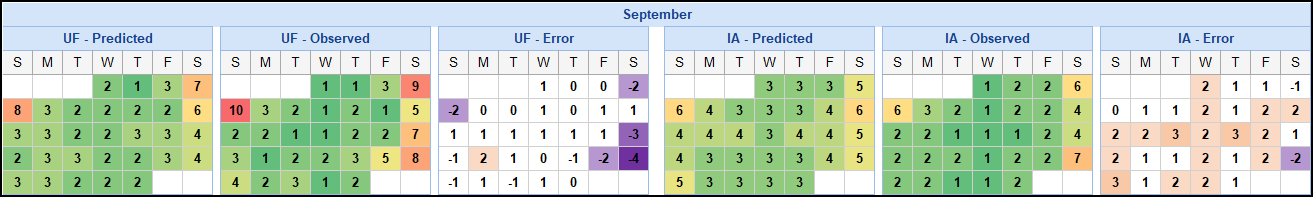
The Delta variant brought an increasing prevalence of COVID at the end of July and the beginning of August. Unlike Disney, Universal did not see a rapid drop in attendance; the pattern here is typical (for the first time this year!) with crowds dropping in the second half of August and continuing to be low through September.
October, November, December

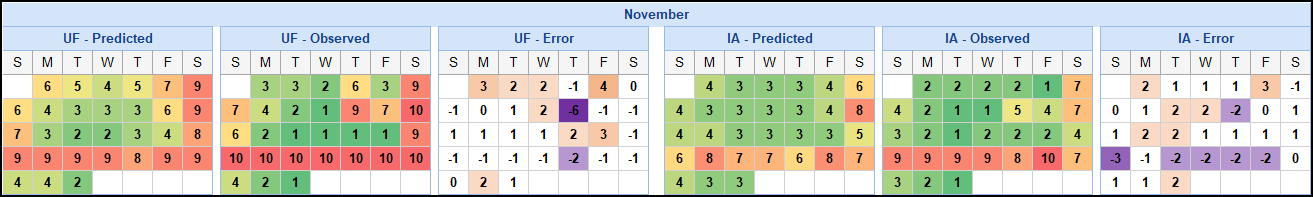

Through the remainder of 2021, crowds continued to be more in line with historical estimates. Since June we’ve seen IoA buck the historical trend and run even with USF when the parks are busy, and we see it here again in the holiday weeks when the heavy crowds temporarily return. This change is something we’ll have to keep an eye on, and it should work its way into our forecasts if it continues.
Final Scores
Our accuracy rating is based on the On Target percentage: the number of forecasts that were within +/- 1 step of the observed crowd level. So how did the Universal Orlando parks stack up this year?

First the good news: Universal Studios had a 62.5% On Target rating. The distribution is centered around -1, which is not ideal but is still within the On Target range. And although it’s not symmetrical, it’s skewed towards overprediction. We don’t like to see asymmetry because it might be an indicator that we have some systemic error that we need to tease out, but if we have to have it then this is how we like to see it, because this is colloquially known as the “no angry people on Twitter” direction.
Now the bad news: Islands of Adventure couldn’t quite squeak over the 50% mark, and although the distribution is centered around 1 (again, we would prefer 0), there is a large skew towards underprediction. This is consistent with the trend we already remarked on where IoA’s crowd levels were more even with USF than they have been in the past, and it’s definitely something that we hope to forecast more accurately next year.
How does this compare to other years?
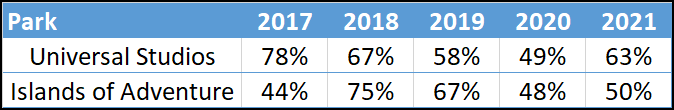
For Universal Studios the comparison is favorable, with 63% being well within the range of what we’ve seen in the past. Islands of Adventure is only favorable when compared with the 44% from 2017, but that doesn’t seem like a comparison that lets us hold our heads high. The numbers from 2018 and 2019 show that we can do better.
Wrapping Up
From March through August this year, the Universal Orlando parks had a simply incredible number of days in the upper tier of crowd levels. The parks were extremely busy this year. While Universal has plenty of draw on its own, it’s likely that some of those crowds reflected spillover from Disney, which is still not operating at full capacity. Some guests may also have been put off by Disney’s reinstatement of its mask mandate in response to Delta, or having to navigate the Park Pass system. Anecdotally, it seemed that although people threaten every year to go to UOR because they’re fed up with Disney, this might have been the year that a large chunk of visitors actually followed through on that. Will this trend continue in 2022? We’ll just have to wait and see.
As you visit the parks, here are our suggestions to get the best experience with our crowd calendars.
- Check crowd-level predictions shortly before your trip, since we make updates on a regular basis. Subscribers can use the crowd tracker and get notified automatically when we make updates to days they’re following.
- Take the time to look at the predicted attraction wait times for the park you plan to visit. Sometimes we get complaints from people who are in the parks on a level 3 day and are surprised by a long line; they don’t realize that what they’re seeing might be par for the course at level 3. Having realistic expectations can be the key to a great day.
- If you use a touring plan, reoptimize it every now and then during the day. Once the park opens our prediction is frozen in history, but we update our day-of wait time estimates frequently based on what we see in the parks. Even if our predicted crowd level turns out to have been way off, reoptimizing will help you to have an optimal day.
Are you planning a trip to Universal Orlando this year? Do you think we’ll continue to see crowds at IoA match those at USF on heavy attendance days? Did you blow off Disney for Universal Orlando in 2021? Let us know in the comments!

You May Also Like...
-

We have had a few weeks to observe the wait times at Universal Orlando Resort since the parks reopened in June.…
-
Disney World parks have reopened and we were surprised to see that Universal Crowd levels appear to be unaffected. Saturday crowds…
-

Wait times at Universal Orlando Resort are up, especially at the Universal Studios Florida park. We have seen crowd levels at…
-
Crowd levels at Universal Orlando Resort continue to hit record highs and our wait time models are underpredicting as a result.…
Maintain the high quality of your article. I’ve been involved in the creation of graphic design. your article is impressive.
In my opinion, the “Fed up with Disney” factor is much higher than you think. In 2021, I spent 6 days at Disney and 4 days at Universal. For me, the satisfaction level between the two was enormous (statistically significant). After 6 days at Disney, I swore never to stay onsite at a Disney hotel again and had so many things that just went wrong at Disney with rides, unhappy cast members, so many experiences still closed, and so on. I rated my visit there at a 2 out of 10. By contrast, everything was perfect for all 4 days at Universal. I would rate it a 10 out of 10. I talked to a lot of guests at Universal who did something similar and felt the same way. Disney alienated A LOT of people in 2021.
For 2022, I plan to stay only at Universal (Portofino Bay) for my entire 9-day stay. I may go to one of the Disney parks for a day or two, but I am still peeved at Disney, so maybe not. I expect the crowds to be heavier at Universal, and frankly, I don’t care because I will have a Universal Express pass and a touring plan. It is worth it, especially compared to Disney.
Having said all that, I wonder if Touring Plans has accounted for the Mardi Gras crowd at Universal. I expect it to be really high this year, despite early February being a ‘slow time’ at both parks, in general. I had a hard time finding availability at the Universal hotels. I know a lot of people are planning to go, given that the parades, festivities and concert headliners are back.
I think you may be right about crowds. With Universal bringing back the 2 days free ticket, Universal parks may be CL 10s everyday this year!
Thanks for the commentary Alex, a lot of people love the Universal Parks (myself included) and rate them at or higher than the Disney parks.
Mardi Gras is a busy time at Universal as we have discovered over the years with our forecasts. Mardi Gras dates are very important in our predictions. Whether this year is more popular than normal remains to be seen. Regardless, an optimized touring plan is the single best way to beat the crowds at Universal. Use one and it won’t matter how busy the park is.
Are 2021’s observed crowd levels the main reason USF’s predicted CLs for 2022 are often 2-3 points higher than those of IoA?
No. No particular year’s observations have any higher weight than another year (although we do have some predictors in the models that relate to how recent the observations were). Also it is important to note that each park uses its own relative scale. So a ‘5’ at Universal Studios Park doesn’t necessarily mean the same attendance as a ‘5’ at Islands of Adventure.