Magic Kingdom’s Busiest Day – Wait Times for Tuesday, March 23, 2021
The weird winter chill has come and gone, leaving pleasant temperatures in Orlando again. Posted wait times at all four Walt Disney World theme parks continue to stay high as spring break rolls on throughout many parts of the country. Magic Kingdom’s average posted wait times were the highest of the past 30 days. But, Magic Kingdom’s posted wait times were also pretty inflated, as actual wait times were 59% of the posted average. We received 204 actual wait times from our Lines app users, our awesome Liners! And we counted 483 of 500 guests (97%) at Disney Springs wearing masks according to Disney’s guidelines.
Magic Kingdom Wait Times

Astro Orbiter had an average wait time today of 44 minutes. Its 7-day average is 42 minutes, so today ranks #1 for this week. Its 30-day average is 41 minutes, so today ranks #6 for the past month. Its 365-day average is 31 minutes, so today ranks #22 for the past year.
Big Thunder Mountain Railroad had an average wait time today of 48 minutes. Its 7-day average is 42 minutes, so today ranks #1 for this week. Its 30-day average is 45 minutes, so today ranks #10 for the past month. We received 11 actual wait times today, and the actual wait averaged 25% of the posted wait time, so the average actual wait was 12 minutes.
Dumbo the Flying Elephant had an average wait time today of 24 minutes. Its 7-day average is 23 minutes, so today ranks #2 for this week. Its 30-day average is 21 minutes, so today ranks #7 for the past month. Its 365-day average is 13 minutes, so today ranks #21 for the past year.
“it’s a small world” had an average wait time today of 51 minutes. Its 7-day average is 47 minutes, so today ranks #1 for this week. Its 30-day average is 45 minutes, so today ranks #4 for the past month. Its 365-day average is 35 minutes, so today ranks #14 for the past year.
Mickey’s PhilharMagic had an average wait time today of 32 minutes. Its 7-day average is 30 minutes, so today ranks #1 for this week. Its 30-day average is 30 minutes, so today ranks #2 for the past month. Its 365-day average is 21 minutes, so today ranks #13 for the past year.
Peter Pan’s Flight had an average wait time today of 45 minutes. Its 7-day average is 46 minutes, so today ranks #4 for this week. Its 30-day average is 42 minutes, so today ranks #11 for the past month. We received 8 actual wait times today, and the actual wait averaged 78% of the posted wait time, so the average actual wait was 35 minutes.
Pirates of the Caribbean had an average wait time today of 64 minutes. Its 7-day average is 55 minutes, so today ranks #1 for this week. Its 30-day average is 56 minutes, so today ranks #2 for the past month. Its 365-day average is 43 minutes, so today ranks #7 for the past year. We received 6 actual wait times today, and the actual wait averaged 63% of the posted wait time.
Splash Mountain had an average wait time today of 88 minutes. Its 7-day average is 62 minutes, so today ranks #1 for this week. Its 30-day average is 68 minutes, so today ranks #2 for the past month. Its 365-day average is 50 minutes, so today ranks #4 for the past year. We received 4 actual wait times today, and the actual wait averaged 78% of the posted wait time.
The Haunted Mansion had an average wait time today of 28 minutes. Its 7-day average is 29 minutes, so today ranks #3 for this week. Its 30-day average is 29 minutes, so today ranks #14 for the past month. We received 7 actual wait times today, and the actual wait averaged 52% of the posted wait time, so the average actual wait was 14 minutes.
Seven Dwarfs Mine Train had an average wait time today of 68 minutes. Its 7-day average is 65 minutes, so today ranks #2 for this week. Its 30-day average is 64 minutes, so today ranks #7 for the past month. Its 365-day average is 57 minutes, so today ranks #67 for the past year.
Under the Sea ~ Journey of the Little Mermaid had an average wait time today of 26 minutes. Its 7-day average is 24 minutes, so today ranks #2 for this week. Its 30-day average is 25 minutes, so today ranks #13 for the past month. Its 365-day average is 20 minutes, so today ranks #85 for the past year. We received 5 actual wait times today, and the actual wait averaged 53% of the posted wait time.
EPCOT Wait Times

Gran Fiesta Tour Starring The Three Caballeros had an average wait time today of 5 minutes. Its 7-day average is 10 minutes, so today ranks #6 for this week. Its 30-day average is 9 minutes, so today ranks #29 for the past month. Its 365-day average is 9 minutes, so today ranks #241 for the past year.
Living with the Land had an average wait time today of 16 minutes. Its 7-day average is 11 minutes, so today ranks #1 for this week. Its 30-day average is 9 minutes, so today ranks #1 for the past month. Its 365-day average is 11 minutes, so today ranks #26 for the past year. We received 4 actual wait times today, and the actual wait averaged 29% of the posted wait time.
Mission: SPACE Orange had an average wait time today of 42 minutes. Its 7-day average is 49 minutes, so today ranks #6 for this week. Its 30-day average is 38 minutes, so today ranks #10 for the past month. Its 365-day average is 27 minutes, so today ranks #30 for the past year.
Soarin’ had an average wait time today of 58 minutes. Its 7-day average is 60 minutes, so today ranks #3 for this week. Its 30-day average is 47 minutes, so today ranks #7 for the past month. We received 5 actual wait times today, and the actual wait averaged 55% of the posted wait time, so the average actual wait was 32 minutes.
Test Track had an average wait time today of 68 minutes. Its 7-day average is 74 minutes, so today ranks #7 for this week. Its 30-day average is 57 minutes, so today ranks #11 for the past month. We received 10 actual wait times today, and the actual wait averaged 52% of the posted wait time, so the average actual wait was 35 minutes.
The Seas with Nemo & Friends had an average wait time today of 18 minutes. Its 7-day average is 17 minutes, so today ranks #3 for this week. Its 30-day average is 13 minutes, so today ranks #5 for the past month. Its 365-day average is 11 minutes, so today ranks #22 for the past year.
Frozen Ever After had an average wait time today of 45 minutes. Its 7-day average is 48 minutes, so today ranks #4 for this week. Its 30-day average is 38 minutes, so today ranks #8 for the past month. Its 365-day average is 45 minutes, so today ranks #105 for the past year.
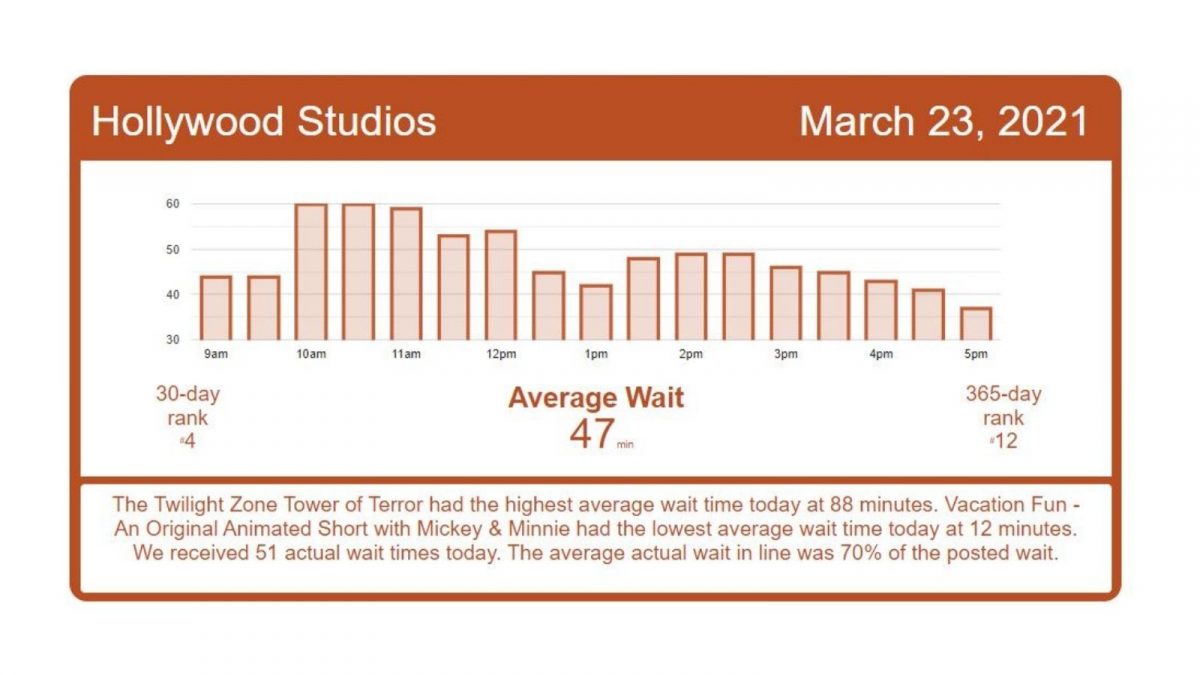
Disney’s Hollywood Studios Wait Times

Muppet*Vision 3D had an average wait time today of 37 minutes. Its 7-day average is 32 minutes, so today ranks #1 for this week. Its 30-day average is 32 minutes, so today ranks #1 for the past month. Its 365-day average is 20 minutes, so today ranks #3 for the past year.
Rock ‘n’ Roller Coaster Starring Umphrey’s McGee had an average wait time today of 50 minutes. Its 7-day average is 45 minutes, so today ranks #1 for this week. Its 30-day average is 44 minutes, so today ranks #4 for the past month. We received 8 actual wait times today, and the actual wait averaged 85% of the posted wait time.
Star Tours: The Adventures Continue had an average wait time today of 41 minutes. Its 7-day average is 35 minutes, so today ranks #1 for this week. Its 30-day average is 37 minutes, so today ranks #5 for the past month. Its 365-day average is 27 minutes, so today ranks #17 for the past year. We received 5 actual wait times today, and the actual wait averaged 50% of the posted wait time.
Toy Story Mania! had an average wait time today of 40 minutes. Its 7-day average is 34 minutes, so today ranks #1 for this week. Its 30-day average is 35 minutes, so today ranks #4 for the past month. We received 14 actual wait times today, and the actual wait averaged 65% of the posted wait time, so the average actual wait was 26 minutes.
Slinky Dog Dash had an average wait time today of 79 minutes. Its 7-day average is 70 minutes, so today ranks #1 for this week. Its 30-day average is 67 minutes, so today ranks #1 for the past month. Its 365-day average is 58 minutes, so today ranks #11 for the past year. We received 5 actual wait times today, and the actual wait averaged 68% of the posted wait time.
Alien Swirling Saucers had an average wait time today of 39 minutes. Its 7-day average is 31 minutes, so today ranks #1 for this week. Its 30-day average is 31 minutes, so today ranks #2 for the past month. Its 365-day average is 24 minutes, so today ranks #5 for the past year.
Mickey & Minnie’s Runaway Railway had an average wait time today of 52 minutes. Its 7-day average is 43 minutes, so today ranks #1 for this week. Its 30-day average is 46 minutes, so today ranks #3 for the past month.We received 11 actual wait times today, and the actual wait averaged 67% of the posted wait time, so the average actual wait was 39 minutes.
Millennium Falcon: Smugglers Run had an average wait time today of 69 minutes. Its 7-day average is 59 minutes, so today ranks #1 for this week. Its 30-day average is 61 minutes, so today ranks #2 for the past month. Its 365-day average is 52 minutes, so today ranks #27 for the past year. We received 4 actual wait times today, and the actual wait averaged 65% of the posted wait time.
Rise of the Resistance is having an awful day. I can hear the Imperial March when I look at today’s today. Boarding Groups are well below pace of the past 7 days. This may have contributed to today’s higher wait times across the park.

Disney’s Animal Kingdom Wait Times

DINOSAUR had an average wait time today of 52 minutes. Its 7-day average is 54 minutes, so today ranks #3 for this week. Its 30-day average is 48 minutes, so today ranks #12 for the past month. Its 365-day average is 31 minutes, so today ranks #40 for the past year. We received 5 actual wait times today, and the actual wait averaged 114% of the posted wait time.
Expedition Everest – Legend of the Forbidden Mountain had an average wait time today of 25 minutes. Its 7-day average is 26 minutes, so today ranks #4 for this week. Its 30-day average is 22 minutes, so today ranks #12 for the past month. Its 365-day average is 25 minutes, so today ranks #110 for the past year. We received 8 actual wait times today, and the actual wait averaged 51% of the posted wait time.
Kilimanjaro Safaris had an average wait time today of 40 minutes. Its 7-day average is 41 minutes, so today ranks #4 for this week. Its 30-day average is 32 minutes, so today ranks #7 for the past month. We received 14 actual wait times today, and the actual wait averaged 49% of the posted wait time, so the average actual wait was 19 minutes.
Na’vi River Journey had an average wait time today of 49 minutes. Its 7-day average is 65 minutes, so today ranks #5 for this week. Its 30-day average is 72 minutes, so today ranks #28 for the past month. Its 365-day average is 46 minutes, so today ranks #102 for the past year. We received 12 actual wait times today, and the actual wait averaged 72% of the posted wait time.
Avatar Flight of Passage had an average wait time today of 71 minutes. Its 7-day average is 73 minutes, so today ranks #4 for this week. Its 30-day average is 61 minutes, so today ranks #10 for the past month. Its 365-day average is 47 minutes, so today ranks #51 for the past year. We received 9 actual wait times today, and the actual wait averaged 71% of the posted wait time.
You May Also Like...
-

Easter weekend is here! Pleasant weather combined with Easter crowds lead to Magic Kingdom's posted wait times being the highest of…
-

Today's average posted wait times at the Animal Kingdom were the highest they've been in the past 30 days, while posted…
-

We're kicking off the week by seeing higher average posted wait times today at Hollywood Studios and EPCOT. The Studios' average…
-

The Magic Kingdom's average posted wait today was just 16 minutes - that's all day, across all attractions - and even…