
Disney Data Dump December 28, 2022
It’s the most crowded time of the year! But also one of the most winter-y-est times in the past decade or so, at least around Christmas-time. And those travel woes definitely had an impact on expected crowds. Just how much of an impact? We also saw the end of holiday parties at the Magic Kingdom, which should lead to a steadying out of crowds there. Steady doesn’t necessarily mean pleasant, though. Let’s find out what’s been happening in the past week, and what we can expect through the end of the year.
Observed Crowd Levels 12/20 – 12/26
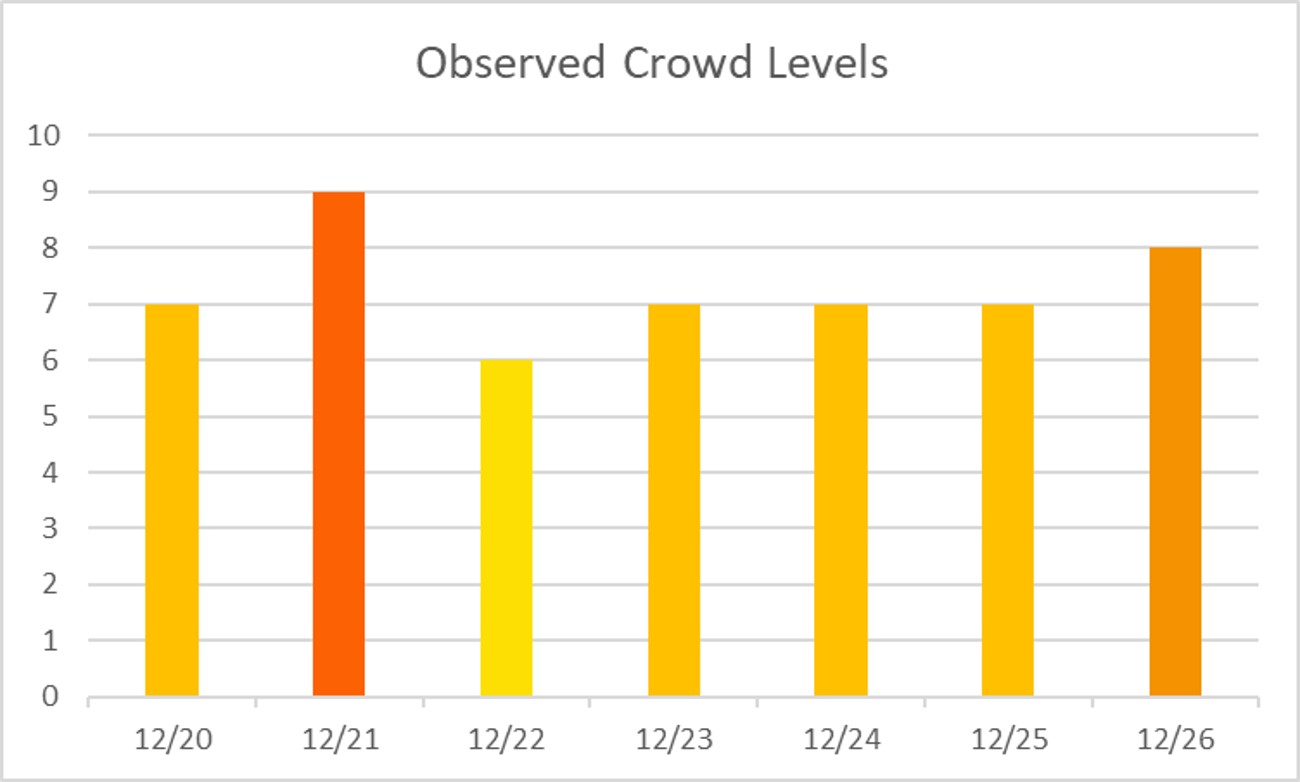
No green crowd levels like last week, but honestly … this could have been a lot worse. It’s not a big surprise that the drop in crowd level from the 21st to the 22nd almost directly correlates with the big winter storm beginning to roll across the country. Quite a few families cut their trips short in order to make it back home for Christmas before travel snarled to an untangle-able mess. And others couldn’t start their vacations as planned thanks to waves of cancelled flights. So if you were in Orlando this past week, consider that string of 7s your Christmas present from Old Man Winter.

It’s the end of an era – the last of our “go to Magic Kingdom on party day” graphs until next fall. Stay tuned until the end of this post for some changes I’ll be making to this weekly post for 2023. But for now, enjoy the fact that even in the midst of holiday crowds, Magic Kingdom had some really pleasant party days. It even has that Christmas-y green/red/green feel. You’re welcome.

Each week, I’m giving you a very transparent look into how our crowd level predictions performed. Each day at each park is one data point, so we have 28 different crowd level predictions to evaluate each week. Any time a prediction is within one or two crowd levels, things won’t really “feel” much different than what we predicted. Being off by 3 or more crowd levels is where we’d like to be more accurate because you might feel that difference in wait times throughout the day.
In the past week, our predictions were either spot-on or within 1 crowd level 54% of the time. This is a drop from the rates in the 60s and 70s of the past three weeks. 79% of the time we were within 2 crowd levels, and that means we earn an C+ for our predictions this past week. Not one of our best results. In fact, we underestimated the crowds by three crowd levels on 3 different park-days. And on December 2nd, we underestimated Hollywood Studios by 4 crowd levels. We predicted a 6, and it ended up being a 10. Overall, WDW was a crowd level 6 that day, so Studios was a big anomaly. And only 4% of ride capacity was lost due to unexpected downtime, so it wasn’t some large outage issue that caused wait times to spike.
Attraction Downtime 12/20 – 12/26
If we average out all of the capacity lost due to unexpected downtime over the past week, it comes out to 4.9% of attractions unexpectedly being down. This is a decent spike compared to the past few weeks, and is probably at least in part thanks to some colder weather wreaking havoc on attractions. The park with the biggest issues was Animal Kingdom, with 6.6% of capacity its lost due to unexpected downtime. This is a remarkably low park high for the week compared to all of the rest of our weekly reviews. I’m almost certain this is the first time Animal Kingdom has been the park with the most downtime issues! Happy end of year surprise.
The worst day for attraction downtime in the past week was on December 25th. On that day, 8% of all capacity at WDW was lost due to unexpected downtime. The single worst park-day of the week was also on December 24th, at Animal Kingdom. On that day, 14% of the the capacity at that park was lost due to unexpected downtime. Animal Kingdom was open for 12 hours on that day, so 14% downtime is the equivalent of the whole park being down for 100 minutes – over an hour and a half. A lot of people would cut that hour and a half off of the end of a full day at Animal Kingdom anyway … but those people are wrong. 12 hours in Animal Kingdom is perfect, and anyone there on the 24th was robbed.

Attraction Downtime
The worst offender was Expedition Everest, which was unexpectedly down for approximately 25% of the week. Its worst day was easily December 24th, when it was unavailable for the entire park day. Everest went down late in the evening on the 23rd, and didn’t come back up reliably until late afternoon on the 25th. This is total nonsense – the Yeti should totally work in the cold weather 🙂
Rope Drop Downtime
Here are this week’s problematic offenders:
- Magic Kingdom: Splash Mountain (unavailable for 35% of its first hour of the day), TTA PeopleMover (unavailable for 31% of its first hour of the day), The Barnstormer (unavailable for 27% of its first hour of the day)
- EPCOT: Test Track (unavailable for 30% of its first hour of the day), Frozen Ever After (unavailable for 20% of its first hour of the day)
- Hollywood Studios: Tower of Terror (unavailable for 45% of its first hour of the day), Runaway Railway (unavailable for 30% of its first hour of the day), Slinky Dog Dash (unavailable for 29% of its first hour of the day)
- Animal Kingdom: Expedition Everest (unavailable for 29% of its first hour of the day)
Magic Kingdom had a slightly nicer week for non-early-entry visitors, with Big Thunder Mountain and Pirates of the Caribbean dropping off of this list. Still, Jungle Cruise is reliably your best first-thing option on the “left side” of the park. EPCOT had a rough week, with 2 out of the 3 big rope drop candidates struggling to wake up and get started in the morning. And at Hollywood Studios, at least you had the opportunity to attempt to rope drop Rise of the Resistance, even if Tower of Terror and Slinky Dog Dash being down ruined the rest of your early-morning routine.

Wait Times 12/20 – 12/26
Attractions with the Highest Average Posted Wait at each park
- Hollywood Studios: Tower of Terror, average posted wait of 125 minutes (97 minutes last week)
- Animal Kingdom: Flight of Passage, average posted wait time of 160 minutes (105 last week)
- EPCOT: Remy’s Ratatouille Adventure, average posted wait time of 87 minutes (74 last week)
- Magic Kingdom: Seven Dwarfs Mine Train, average posted wait time of 81 minutes (71 last week)
Well hello there, big wait (any Holiday fans out there?). Flight of Passage had some absolutely bonkers posted wait times this week. During one random check this past week, I caught it at 295 minutes. In the afternoon on a weekday. Anyone else do those random “sure, I’m sitting in my cold house in St. Louis, but what are wait times like at Disney?” checks? They’re an awful lot of fun. Because sometimes you can say to yourself “at least I’m not in a 5 hour long line, because I’m smart and visit in September.” An average posted wait times of 160 minutes is just straight-up crazy. This includes posted wait times during early entry. It includes posted wait times later in the evening when barely anyone has stayed in Animal Kingdom.

An average posted wait time of over 2 hours at Tower of Terror is also pretty rare. It’s been having well-known capacity issues, but usually the balk point where people just opt not to get in line there is lower than 2 hours. That means there were lots of other high wait times at Hollywood Studios as well. In fact, 4 out of the top 5 highest average posted waits were all in Hollywood Studios:
- #2: Tower of Terror (125 minutes)
- #3: Slinky Dog Dash (105 minutes)
- #4: Rise of the Resistance (98 minutes)
- #5: Millennium Falcon: Smugglers Run (93 minutes)
So if you’re planning your Studios day all around Rise, that’s actually not turning out to be the key factor this winter. Tower of Terror and Slinky Dog Dash have routinely had higher wait times and more downtime. It’s a weird, upside-down world we’re living in.
Parks with the Highest and Lowest Average Wait
These parks likely won’t change week-to-week unless something ridiculous happens, but these data points will give us a high-level view of how wait times are trending from week to week.
- Highest: Hollywood Studios, average park-wide posted wait of 58 minutes (last week 46 minutes)
- Lowest: Magic Kingdom, average park-wide posted wait of 27.5 minutes (last week 24 minutes)
Big ouch for Hollywood Studios. If you picked any random line at Studios over the past week, you could have expected to see a posted wait time of an hour. That includes less-crowded times like early entry or during Fantasmic, and it includes lower-tier attractions like Alien Swirling Saucers, or even “attractions” like Walt Disney Presents or Vacation Fun. But when you’ve got four attractions all with an average over 90 minutes, it’s difficult to balance that out.
Most Inflated Posted Wait Times
We all know that Disney inflates their posted wait times on purpose. They have many reasons for doing this. Some are totally understandable, and some are potentially more problematic. We can figure out how much posted wait times are being inflated by comparing submitted actual wait times from the Lines App and the posted wait time when the person timing their wait entered the line.
From December 13th through 19th, actual wait times in the Lines App averaged 64% of what was posted. So if the posted wait time was 20 minutes, you could’ve expected to wait just under 13 minutes instead.
But the worst offender for the week was Living with the Land. At this one attraction, submitted actual wait times were 40% of posted wait times, which means that if Living with the Land had a 20 minute posted wait, you probably would’ve waited just about 8 minutes. Less than half of what was posted. Remember to always check the Lines app for predicted actual waits instead of believing what is posted.
Looking Ahead: December 27th through January 2nd
Since it takes time to pull data and write a post, you’ll be reading this on the 28th when the 27th is already in the past. But we’re staying as close to real-time as possible.
Looking ahead to this next week, travel disruptions have mostly* been resolved. That’s a big asterisk, because families flying to Disney World means they’re looking for cheap-ish, family-friendly airlines, and that makes Southwest a popular choice. If you haven’t yet heard the saga of Southwest cancelling 2/3 of its daily flights from now through the new year … lucky you. But let’s assume that even if flights got cancelled, families are driving their way to Disney World to not miss their vacation.
Barring any other freak things, I fully expect all crowd level 9s and 10s from now through the end of the year. This is the busiest week at Walt Disney World, always. A quick spot-check of crowds as I write this shows easy crowd level 10 waits at each of the parks on the 27th. Good luck to any of you that are braving the crowds this week.
Looking Ahead: 2023
Expect some changes to this post as we head into 2023. Most things will stay the same, except that there won’t be a Magic Kingdom specific crowd level chart. If some weird trend happens at any park, I’ll highlight that instead.
Additionally, I’ll be adding a new section that gives a shout-out to the Lines user with the most submitted wait times from the previous week, and that gives guidance on attractions (and maybe even times of day) where we could use some additional timed waits. That way if you’re taking a trip the following week, you know how you can best help us … so that we can help you more 🙂
In early 2023, you’ll also be seeing some crowd calendar retrospectives to show how our predictions fared throughout the entire year – not just the past week. And I’ll also be giving out 2022 “awards” to the highest-satisfaction hotels, attractions, and dining locations. Hopefully all of this will help you to make better decisions for your upcoming trip.
If you’d like to see anything else featured in this post in the future, or if you have requests for other analyses or blog posts, let me know in the comments below!
You May Also Like...
-

Welcome to December, Disney data friends! The Festival of Holidays is in full swing, along with the Candlelight Processional. Fantasmic continues…
-

Welcome to the darkest and shortest day of the year! It's officially winter, and it's officially large crowd season at Walt…
-

Happy mid-December! Does anyone else feel like it was just yesterday that I posted the last data dump? No? Just me.…
-

Happy November! This change of month means that it is officially holiday season at Walt Disney World. Decorations are up, the…
I really don’t understand the attraction downtimes at rope drop. The parks are closed all night and they can’t get them ready for opening?
After this week’s weather, the way I like to think of it is a car that hasn’t been started up for a while. It freezes up, and makes it more difficult to restart. Sure, overnight isn’t a long time for an attraction to be shut down, but just like anything else, starting it back up may lead to some problems.