Is Dining Quality at Walt Disney World Back to Normal?
Back in March (is that like, eons ago at this point?), Bob Chapek claimed that satisfaction was up at Disney parks post-reopening and everyone thought he was crazy. I ran a series of analyses and articles exploring pre-pandemic satisfaction to post-reopening satisfaction at resorts, attractions, and dining locations. The results were … not great for good ol’ Chapek dude. But, anecdotally at least, it seems like with the reopening and restaffing of dining locations, things are at least getting better on that front.
So today let’s explore dining satisfaction over three distinct periods: pre-pandemic, post-reopening (through March of 2021), and “recently” (April through early September 2021). Did satisfaction rebound overall? Are there specific locations or types of restaurants that have performed better (or worse) in the last half-year?
Explain the Math!
At the end of every WDW vacation, you can fill out a post-visit survey that gives us lots of information about all aspects of WDW vacations, from planning to party demographics, as well as everything that you do on vacation. We can use that information to help everyone make better future decisions, like where to eat if you want to enjoy your meal, or attractions to visit depending on your demographics.
In each post-visit survey, you can give each dining location that you visited a thumbs-up, or a thumbs-down. For our purposes here, we’ll call a thumbs-up “satisfied” and a thumbs-down “dissatisfied”. This allows us to compare everything with statistical analysis based on proportions. The proportion of people that were satisfied with their dining experience are the number of survey respondents that gave their experience a “thumbs up” divided by the total number of people that rated their dining experience.
Once we get this proportion for two different types of people (like those that visited before the pandemic, or those that visited in the last 6 months), we can compare the two proportions directly. If we know the size of each group of people, and the proportion that were satisfied in each group, a fancy two-proportion z-test can tell us if the two proportions are significantly different. That is, what are the chances that the difference in the two proportions are due to random chance or error, compared to the chances that the differences are really real?
If you read the initial comparison back in early April, and you have a good memory for numbers, you might call me out for having slightly different percentages in that post and this one. That’s because people can submit surveys for trips weeks or months after they actually visit. But we assign the satisfaction scores to the dates of their visit, not the date that they filled out the survey. So we have some additional data about the proportion of satisfied people for the same timeframes that we didn’t have back when we first crunched the numbers.
(Side note – you caught me, my real goal of this whole post is to get Satisfied from Hamilton stuck in the heads of as many people as possible.)
Overall Results
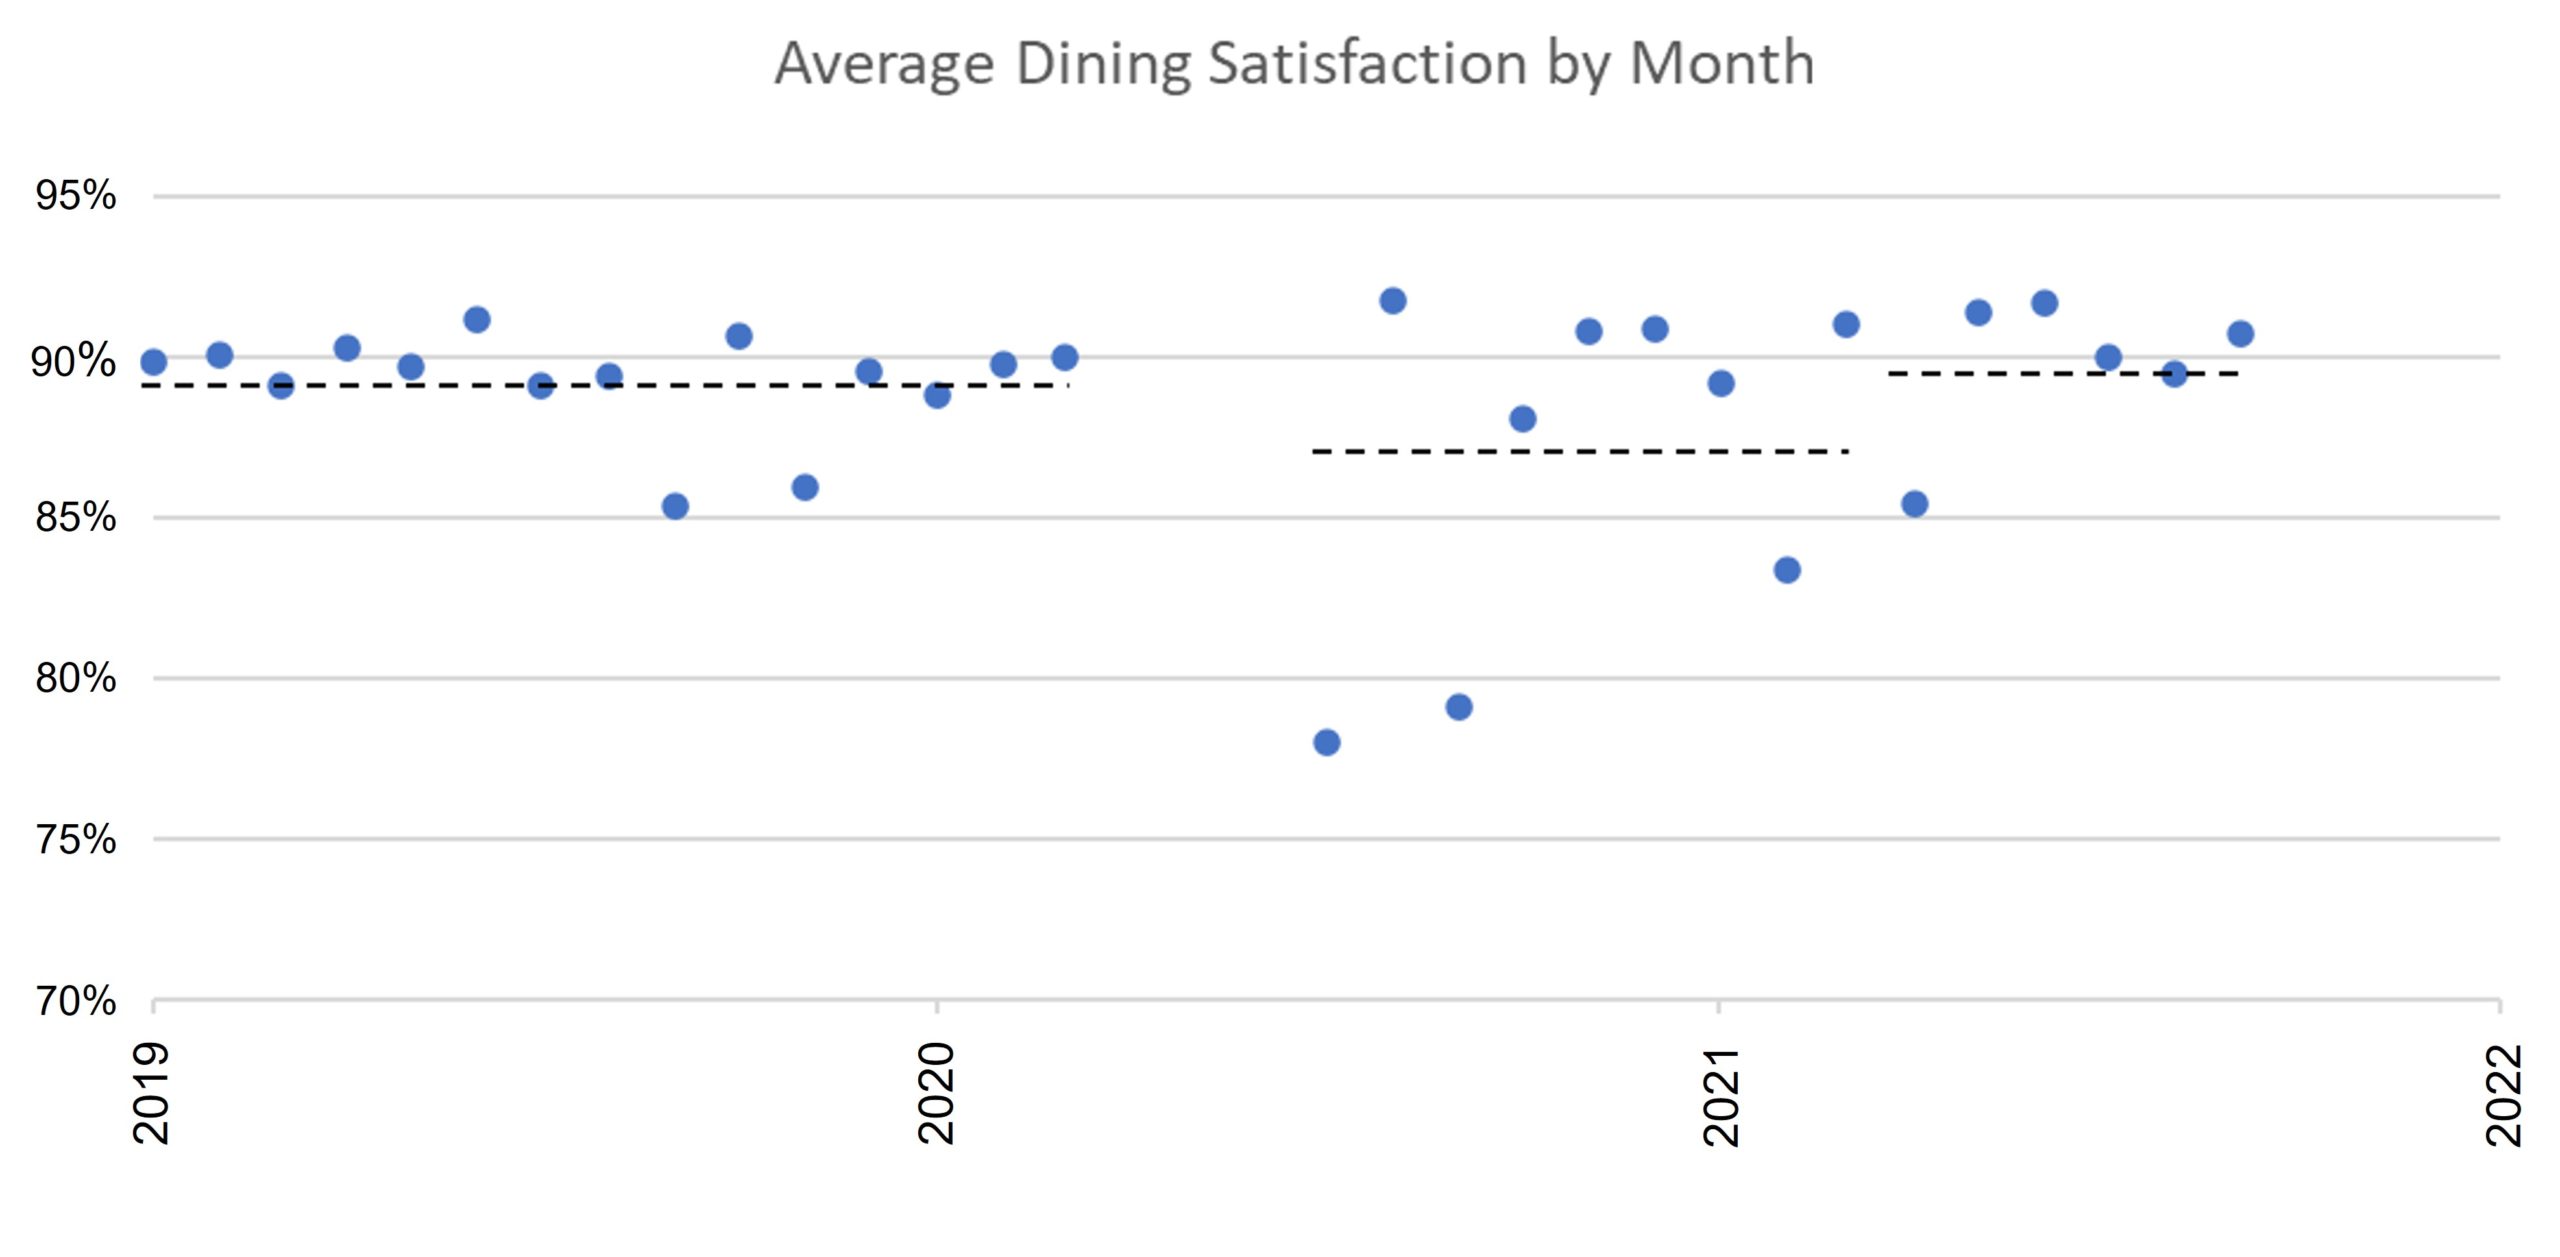
- Pre-pandemic, the average satisfaction at all dining locations in WDW was 89.1%. After the parks reopened in July 2020, and through all of March 2021, that number dropped to 87.2%. That might not seem like much, but thanks to really really large sample sizes, it’s definitely statistically significant – not due to chance.
- It looks like that lower average was due, in most part, to a few really terrible months – July and September of 2020, and February of 2021.
- Since April 2021, the average satisfaction has bounced back up to 89.6%. Now only is that statistically significantly better than the post-reopening phase, it’s also significantly better than the pre-pandemic average. And if April hadn’t been one of those “off” months, the average would be even better.
- So what’s up with the better satisfaction? I could make a lot of guesses – people just happy to be back in the parks, kitchens and service areas staffed back up closer to “normal”, some fan favorites opening back up, etc. But let’s dig in one layer of detail deeper to see if anything shows up there.
Satisfaction by Dining Type
Table-Service
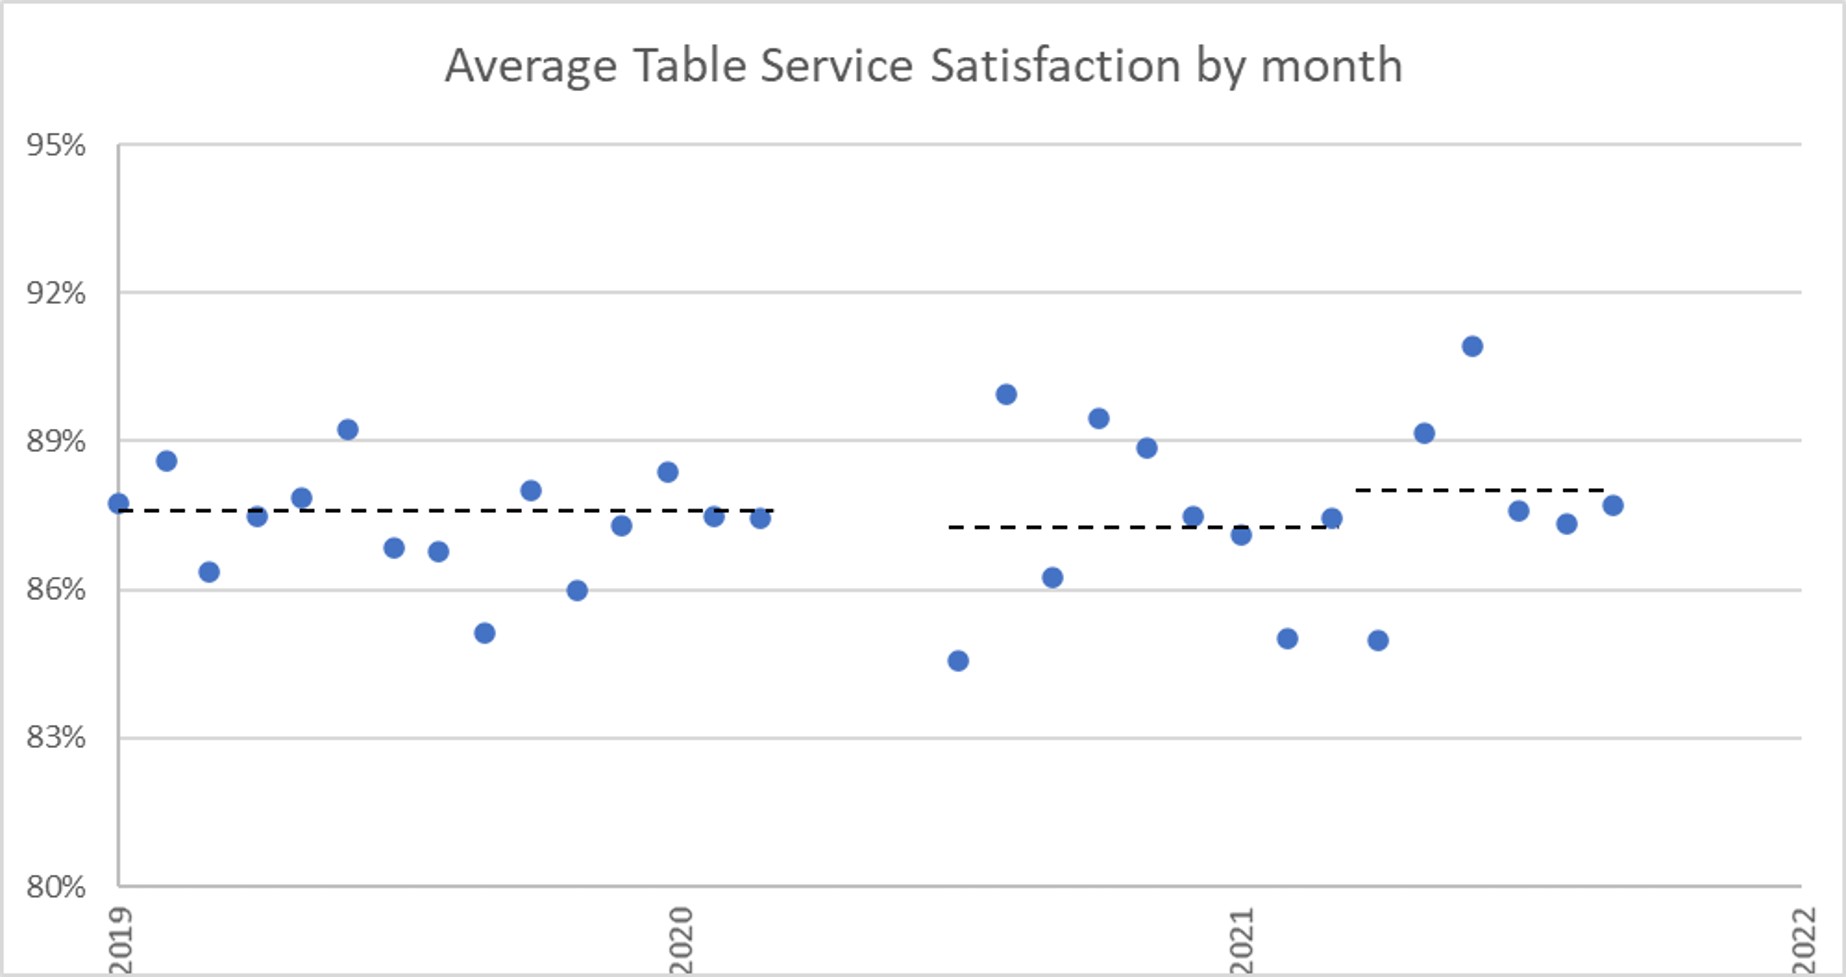
The average satisfaction at all table service restaurants was 87.5% prior to the pandemic, and 87.4% during the months following reopening. That’s not statistically significant – they’re basically the same. But since April, satisfaction has gone up to 88.1%. Still not a statistically significant increase. So table service restaurants have basically stayed stable, no matter the “phase”.
Counter Service

Counter service locations didn’t see a drop in satisfaction post-reopening. In fact, satisfaction averaged 87.6% pre-pandemic, and 87.7% in the months following reopening. That’s not a significant increase. It’s basically the same, especially since satisfaction varied so wildly month to month following reopening. Since April, satisfaction at counter service spots has been 88.6%, though, which is significantly increased from both before the pandemic and the post-reopening phase.
Bars and Lounges

Here’s where we start to see some more pronounced differences. Visitors at bars and lounges pre-pandemic averaged 92.1% satisfaction. In the months following reopening, that dropped all the way to just below 90%. That’s a statistically significant difference. But in recent months, average satisfaction has started to make a recovery and is back up to 91.1%. That’s not statistically different from the pre-pandemic average or the post-reopening average. It’s just hanging out there in the middle, so we can’t technically call it a trend either way right now.
Everywhere Else

Things that are table service, counter service or bars/lounges include food carts, festival booths, markets, and room service. These locations actually saw the biggest drop in satisfaction compared to prior to the pandemic. Before closure, average satisfaction at these locations was 92.8%, and post-reopening that average dropped all the way to 86.2%. That’s obviously a statistically significant drop. Recently, the average has increased back to 91.6%. That’s significantly better than the post-reopening months, but also still significantly worse than the pre-pandemic satisfaction.
Satisfaction by Specific Location
Table Service Locations
Are there any restaurants that have been steadily improving compared to pre-pandemic averages? Yes! Two table-service locations jump out:
-

It’s still not in the top tier, but STK isn’t at the very bottom of the pack anymore STK Orlando had 62.2% satisfaction pre-pandemic, and in my original article, I remarked that it had improved. From July 2020 through March 2021, that satisfaction increased to 76%. Since April, satisfaction has continued its upward trend to 80%.
- Ale & Compass Restaurant started out with 80.6% satisfaction pre-pandemic. In the months post-reopening, that average went up to 87.8% – already an impressive improvement. But recently that satisfaction has continued to go up and now averages 93.2% since April.

What about recent gains? Regardless of pre-pandemic averages, two table-service locations have made major improvements since April, when compared to the post-reopening phase:
-

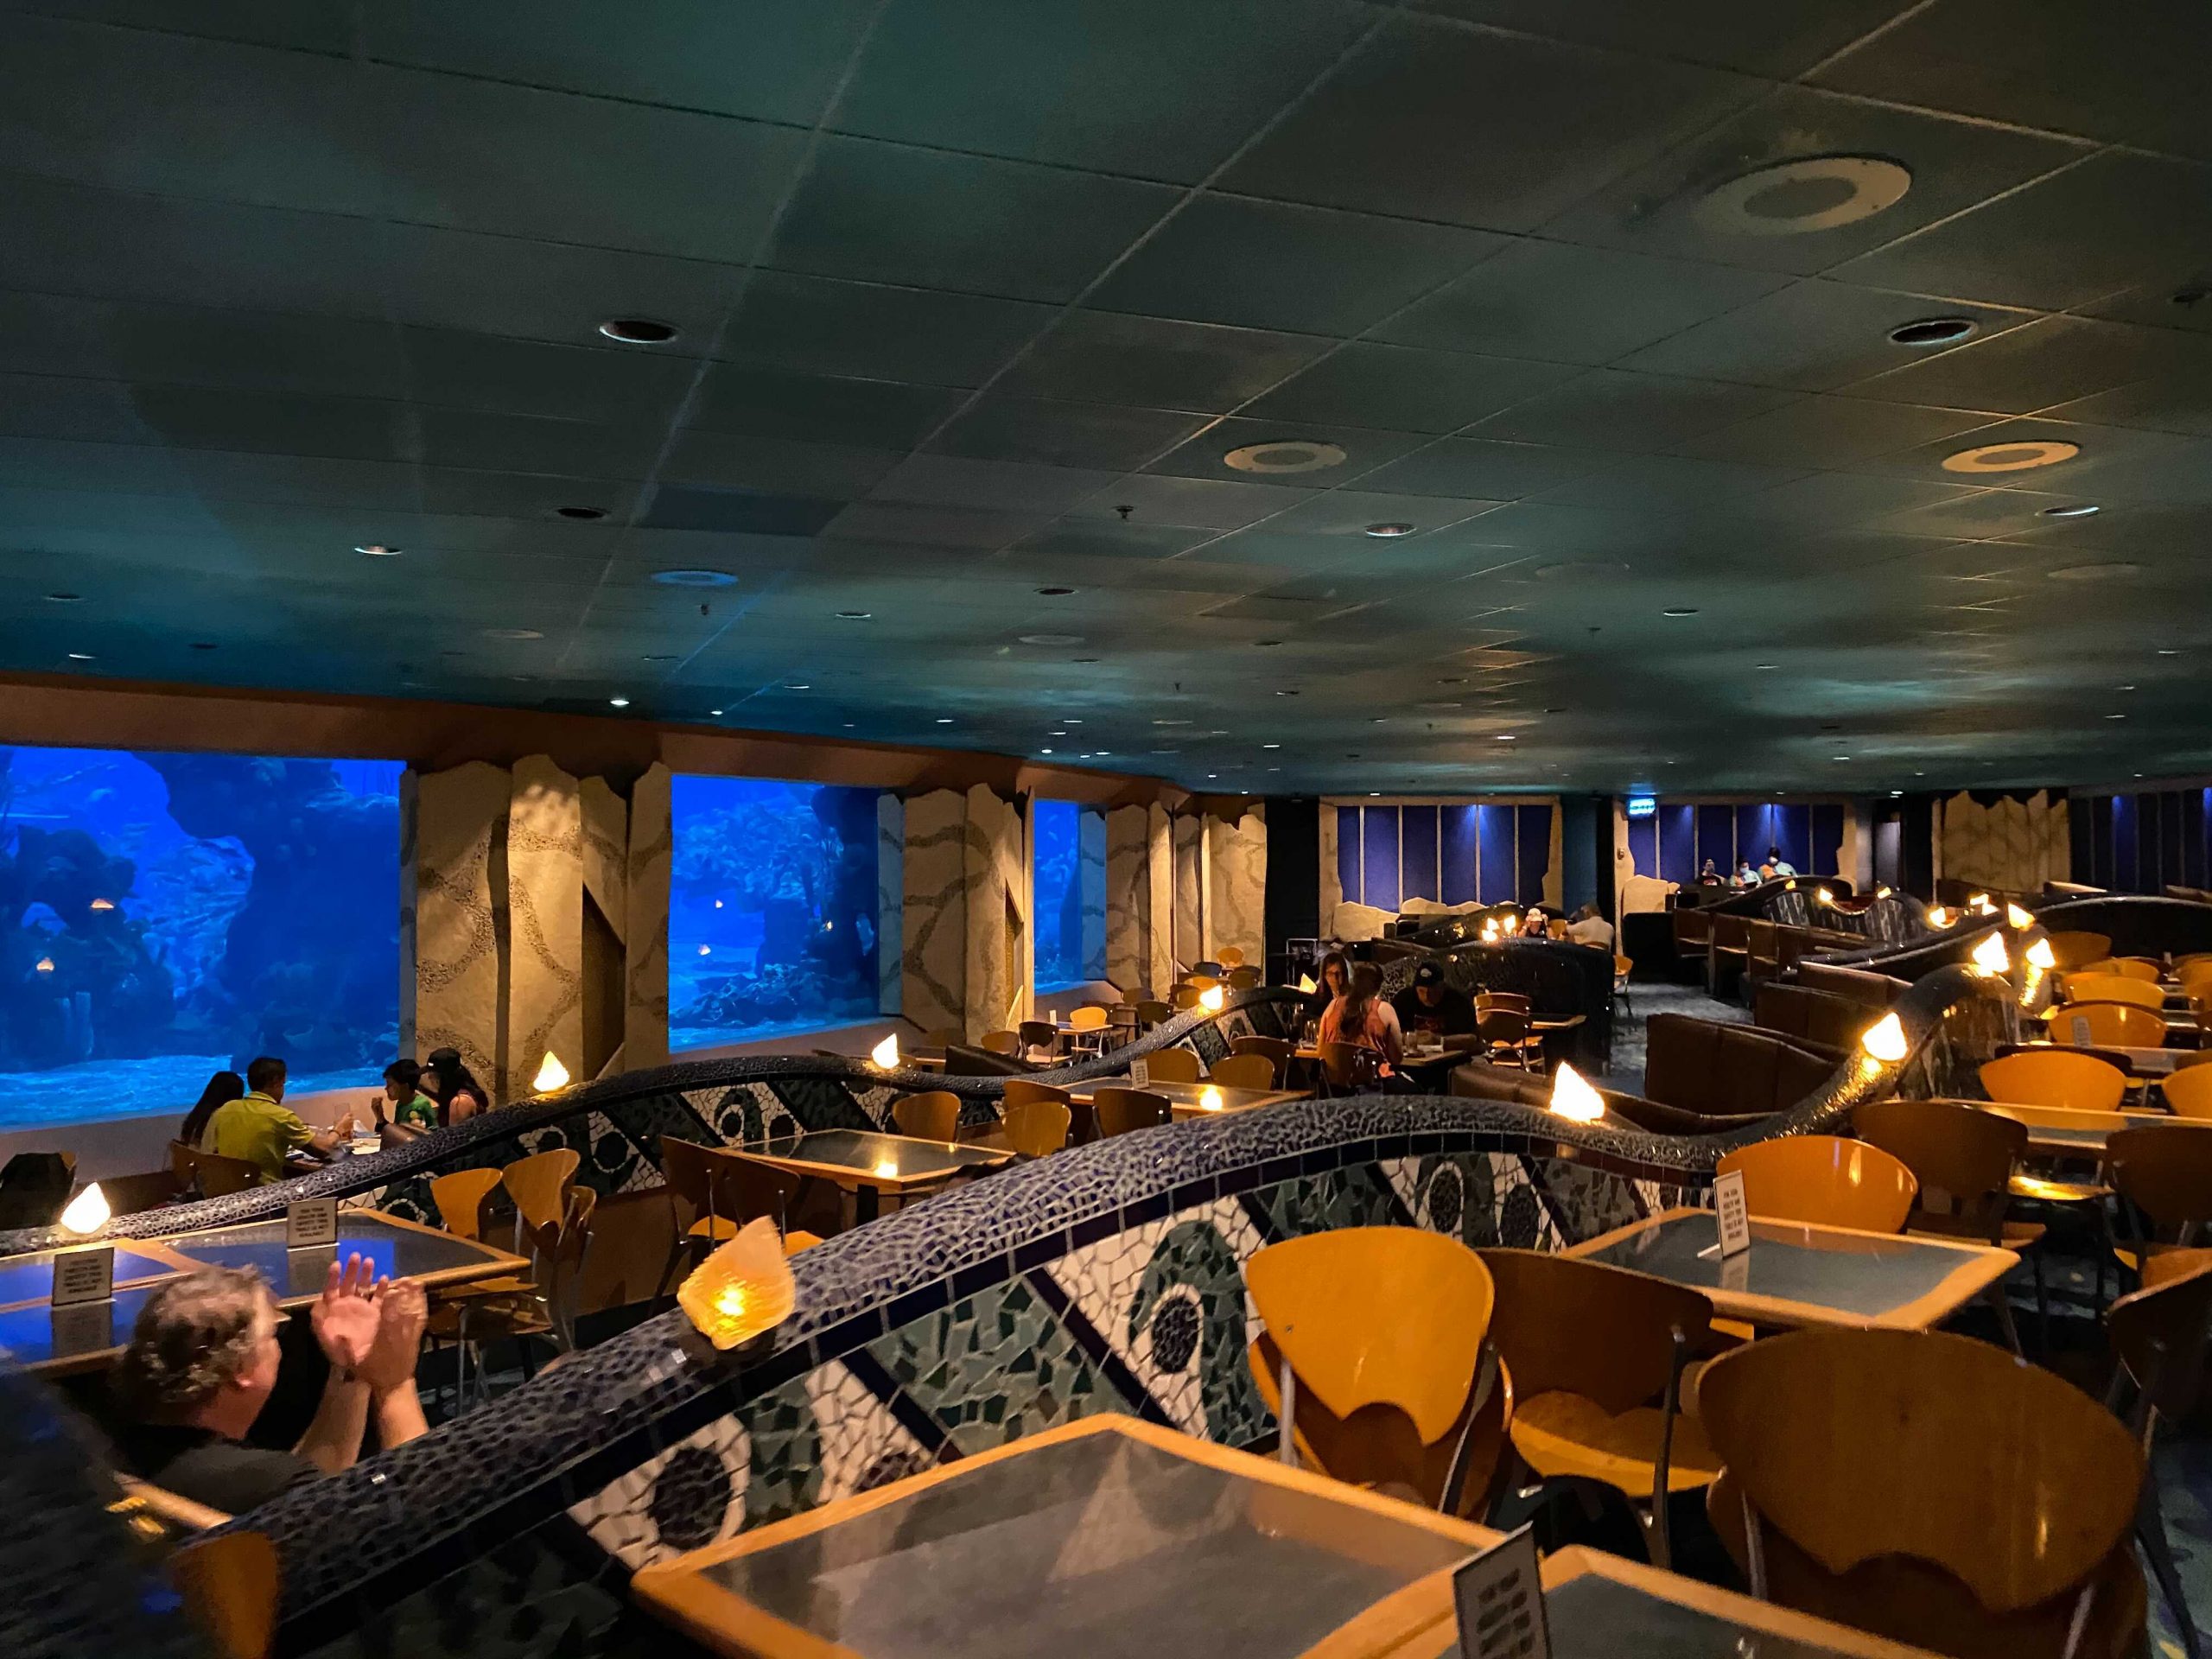
If you’ve been unimpressed at Coral Reef before, it might be worth another visit now We called out The Crystal Palace as somewhere that had really lost its groove post-reopening. Even as recently as last week we still said you should dine there at your own peril. Compared to a 90.2% average satisfaction pre-pandemic, satisfaction was really terrible at 71% post-reopening. Since April, that satisfaction has recovered up to 82.9%. Still not anywhere close to where it was previously, but much better than those first few months.
- Coral Reef Restaurant is also an interesting case. Post-reopening, nothing much was changed from pre-pandemic. Average satisfaction went from 77.7% to 77.8%. Not really different at all. But since April, average satisfaction has suddenly jumped to 87.5% – a significant increase!
And what are the restaurants that haven’t made improvements, and/or are still well below their pre-pandemic averages?
-

People seem to be not as excited to meet Mickey and his friends in the past few months Narcoossee’s was a pretty highly-rated table service location pre-pandemic, with an average satisfaction of 90.1%. Unfortunately, since April the satisfaction there has only been 77.5% – a very significant drop.
- Not to sound the alarm bells too soon, but Topolino’s Terrace also pops up as the place with the most significant decrease in satisfaction from post-reopening compared to the last 6 months. It’s not the biggest decrease by value, but since we get so many surveys from Topolino’s, it is the most significant. Post-reopening, satisfaction at Topolino’s was at a stratospheric 97.9%. Since April, that average satisfaction has dropped to 92.2%. That’s still better than about 75% of table service restaurants over the same time period. But it’s certainly not the very best.

Counter Service Locations
Several counter service locations around property have been steadily increasing satisfaction compared to pre-pandemic WDW, and two of them are at Hollywood Studios (my personal pick for most-improved-counter-service):
-

ABC Commissary’s new menu items seem to be performing well, and might be worth a try if you haven’t visiting in a while ABC Commissary used to be a pretty miserable place to eat. Pre-pandemic the average satisfaction there was 76.4%. Not great. Post-reopening, a new menu was introduced and satisfaction improved all of the way to 87.2%. And it wasn’t just a phase – since April, satisfaction is still on the rise, now at 88.5%.
- Good’s Food To Go isn’t a place that a lot of people know about or frequent, unless you happen to be a regular at Old Key West. And for good reason – satisfaction there was only 71.9% pre-pandemic. Certainly no reason for a trip over to OKW. Thankfully for those staying at that resort, post-reopening, satisfaction increased to 82.1%. And since April things have been even better, with average satisfaction at 88.1%.
- Rounding out the steady increases category is Ronto Roasters. Ronto Roasters certainly wasn’t a slacker pre-pandemic, with average satisfaction at 89%. But it was even better post-reopening, at 95.2% average satisfaction. And it continues to impress, with 97.1% satisfaction since April. That’s the 4th-highest satisfaction rating at a counter service spot for that time period.
Regardless of pre-pandemic, what are the counter service spots with the most significant recent improvements? These are the comeback kids:
- Yak & Yeti Local Food Cafes get a lot of reviews, and post-reopening was sitting at 87.8% satisfaction. Not too bad. But since April, that’s improved all the way to 96.3% – making it the most statistically significant improvement.
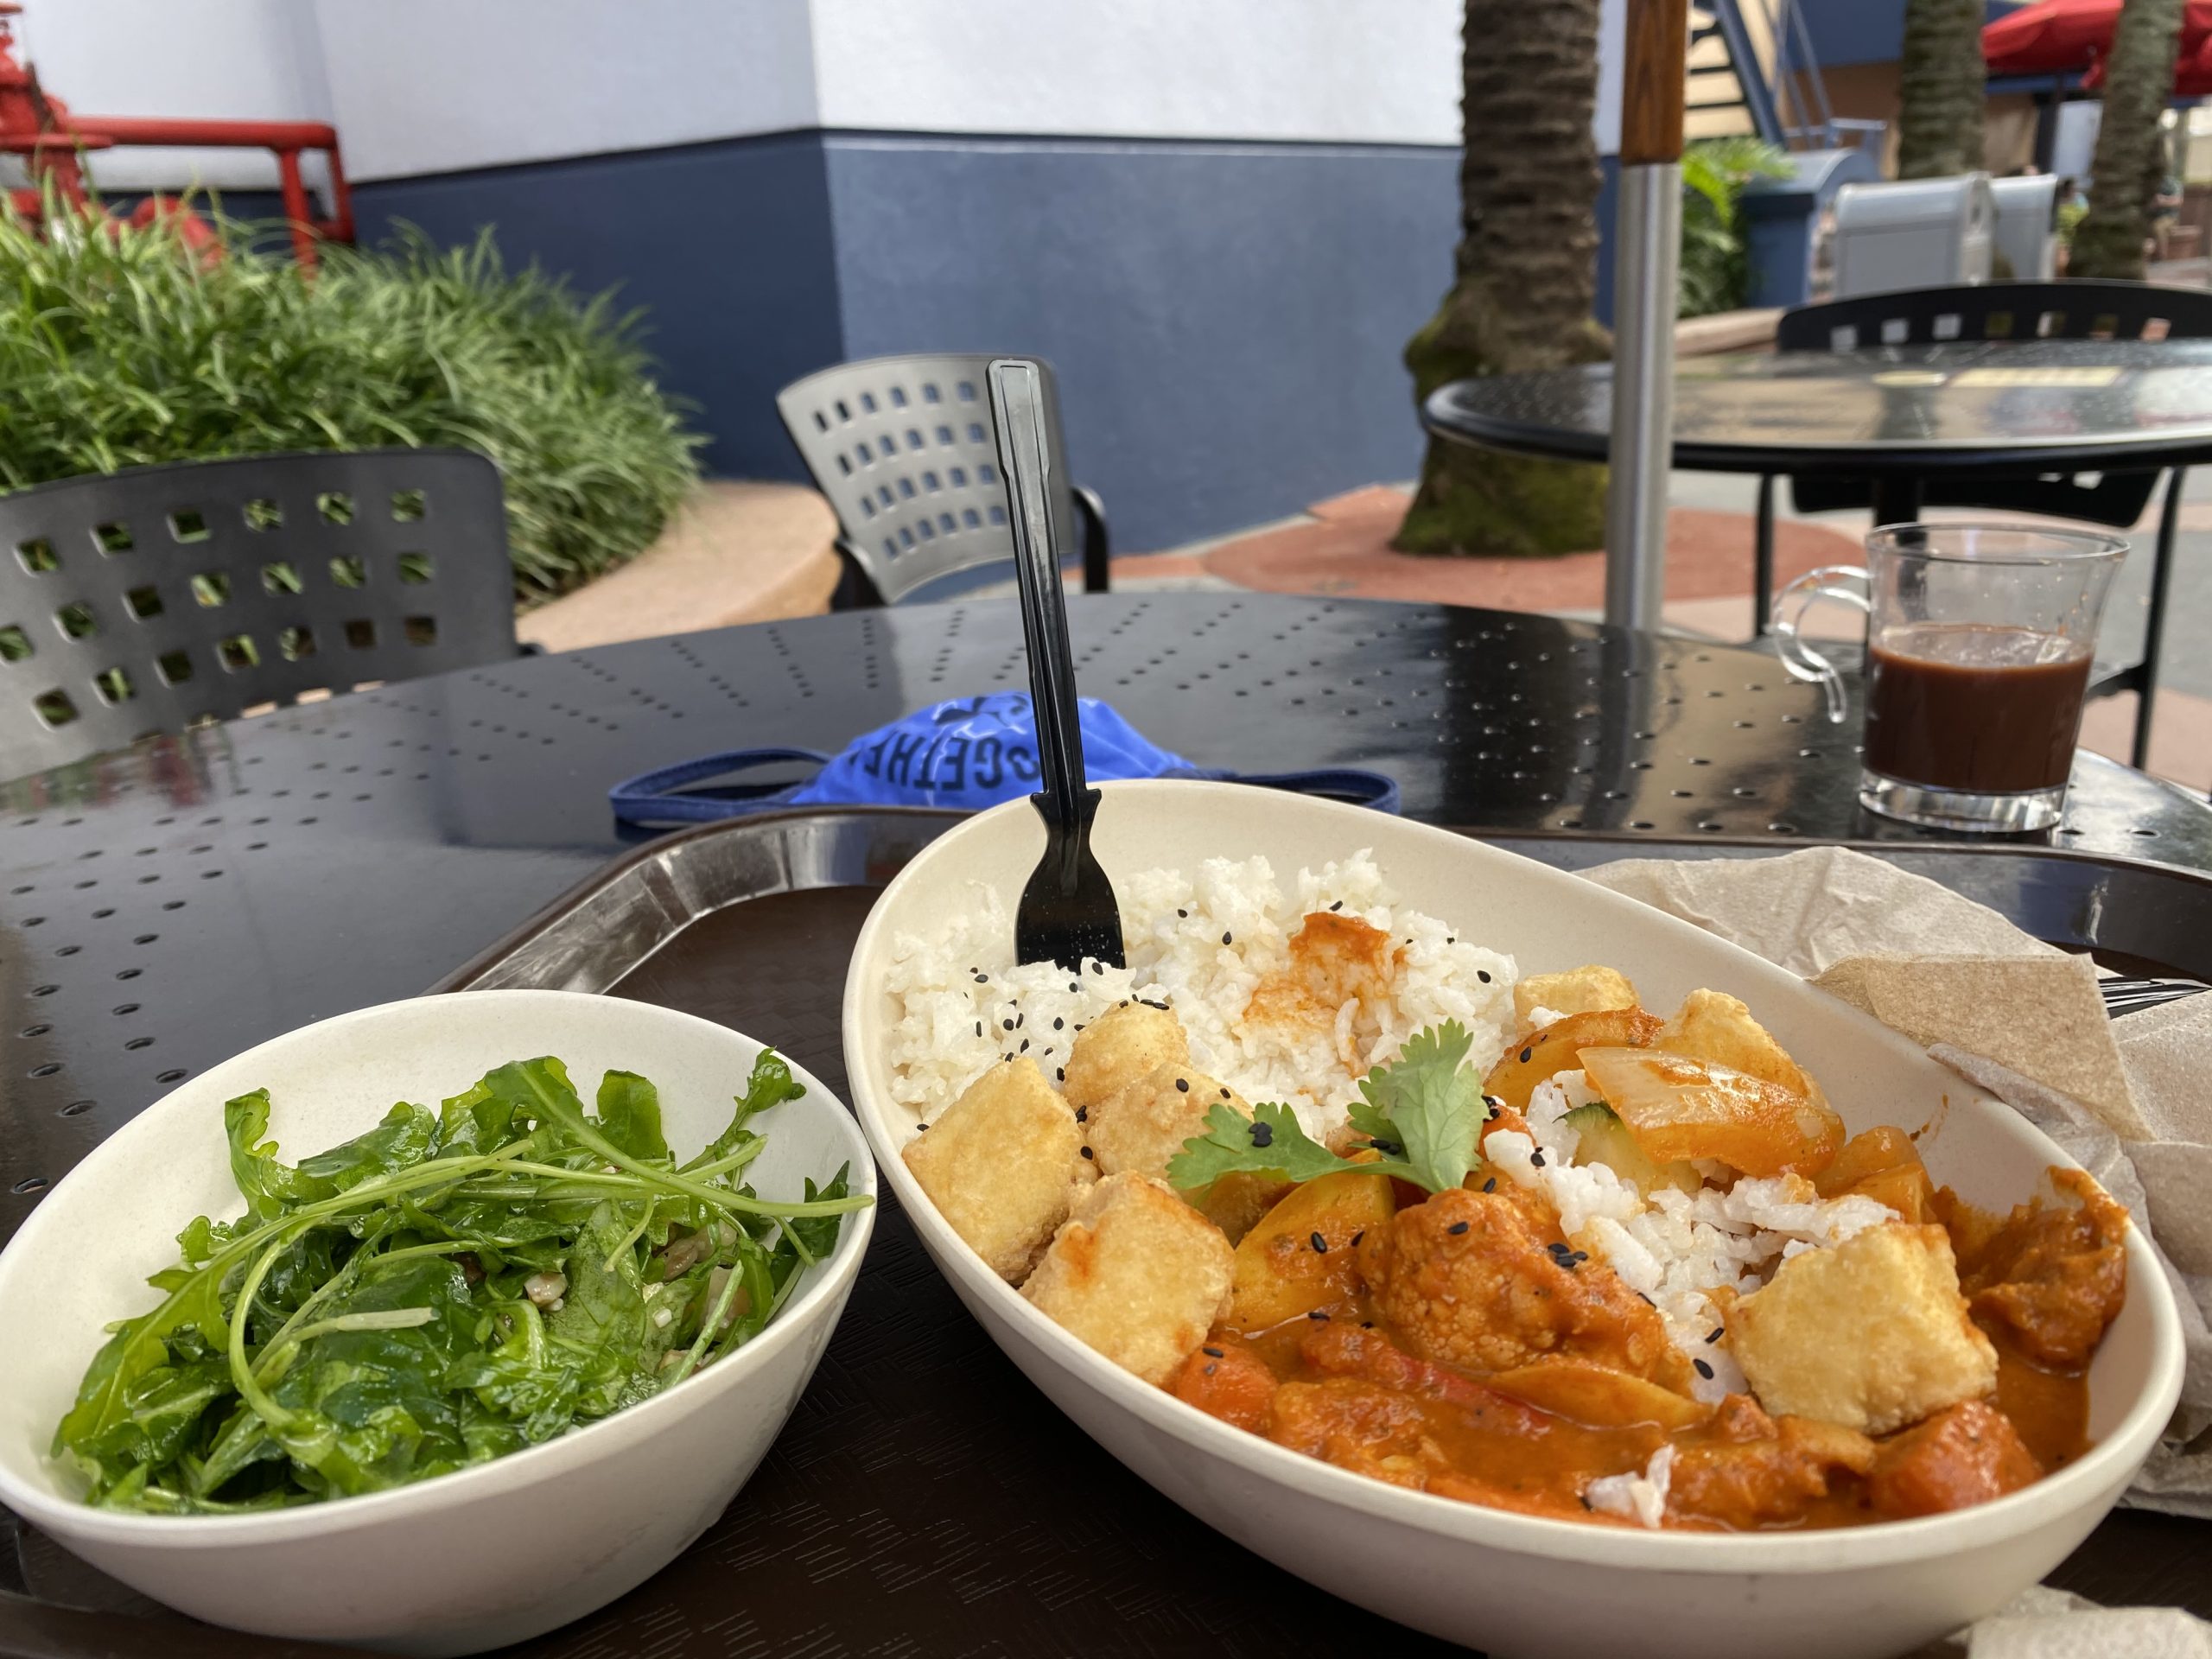
- Following close behind is Harambe Market. So something’s going on at Animal Kingdom since April (Pizzafari and Satu’li Canteen take spots four and six on the recently improved list). Post-reopening, satisfaction at Harambe Market was at 91.5%. That’s already very good, and almost identical to pre-pandemic satisfaction. But since April, 152 different people rated Harambe Market, and it got an astounding 98% average satisfaction. For the time period, it ties (with Satu’li Canteen) for second-highest satisfaction of any counter service spot on property.
And what about recent losers?
-

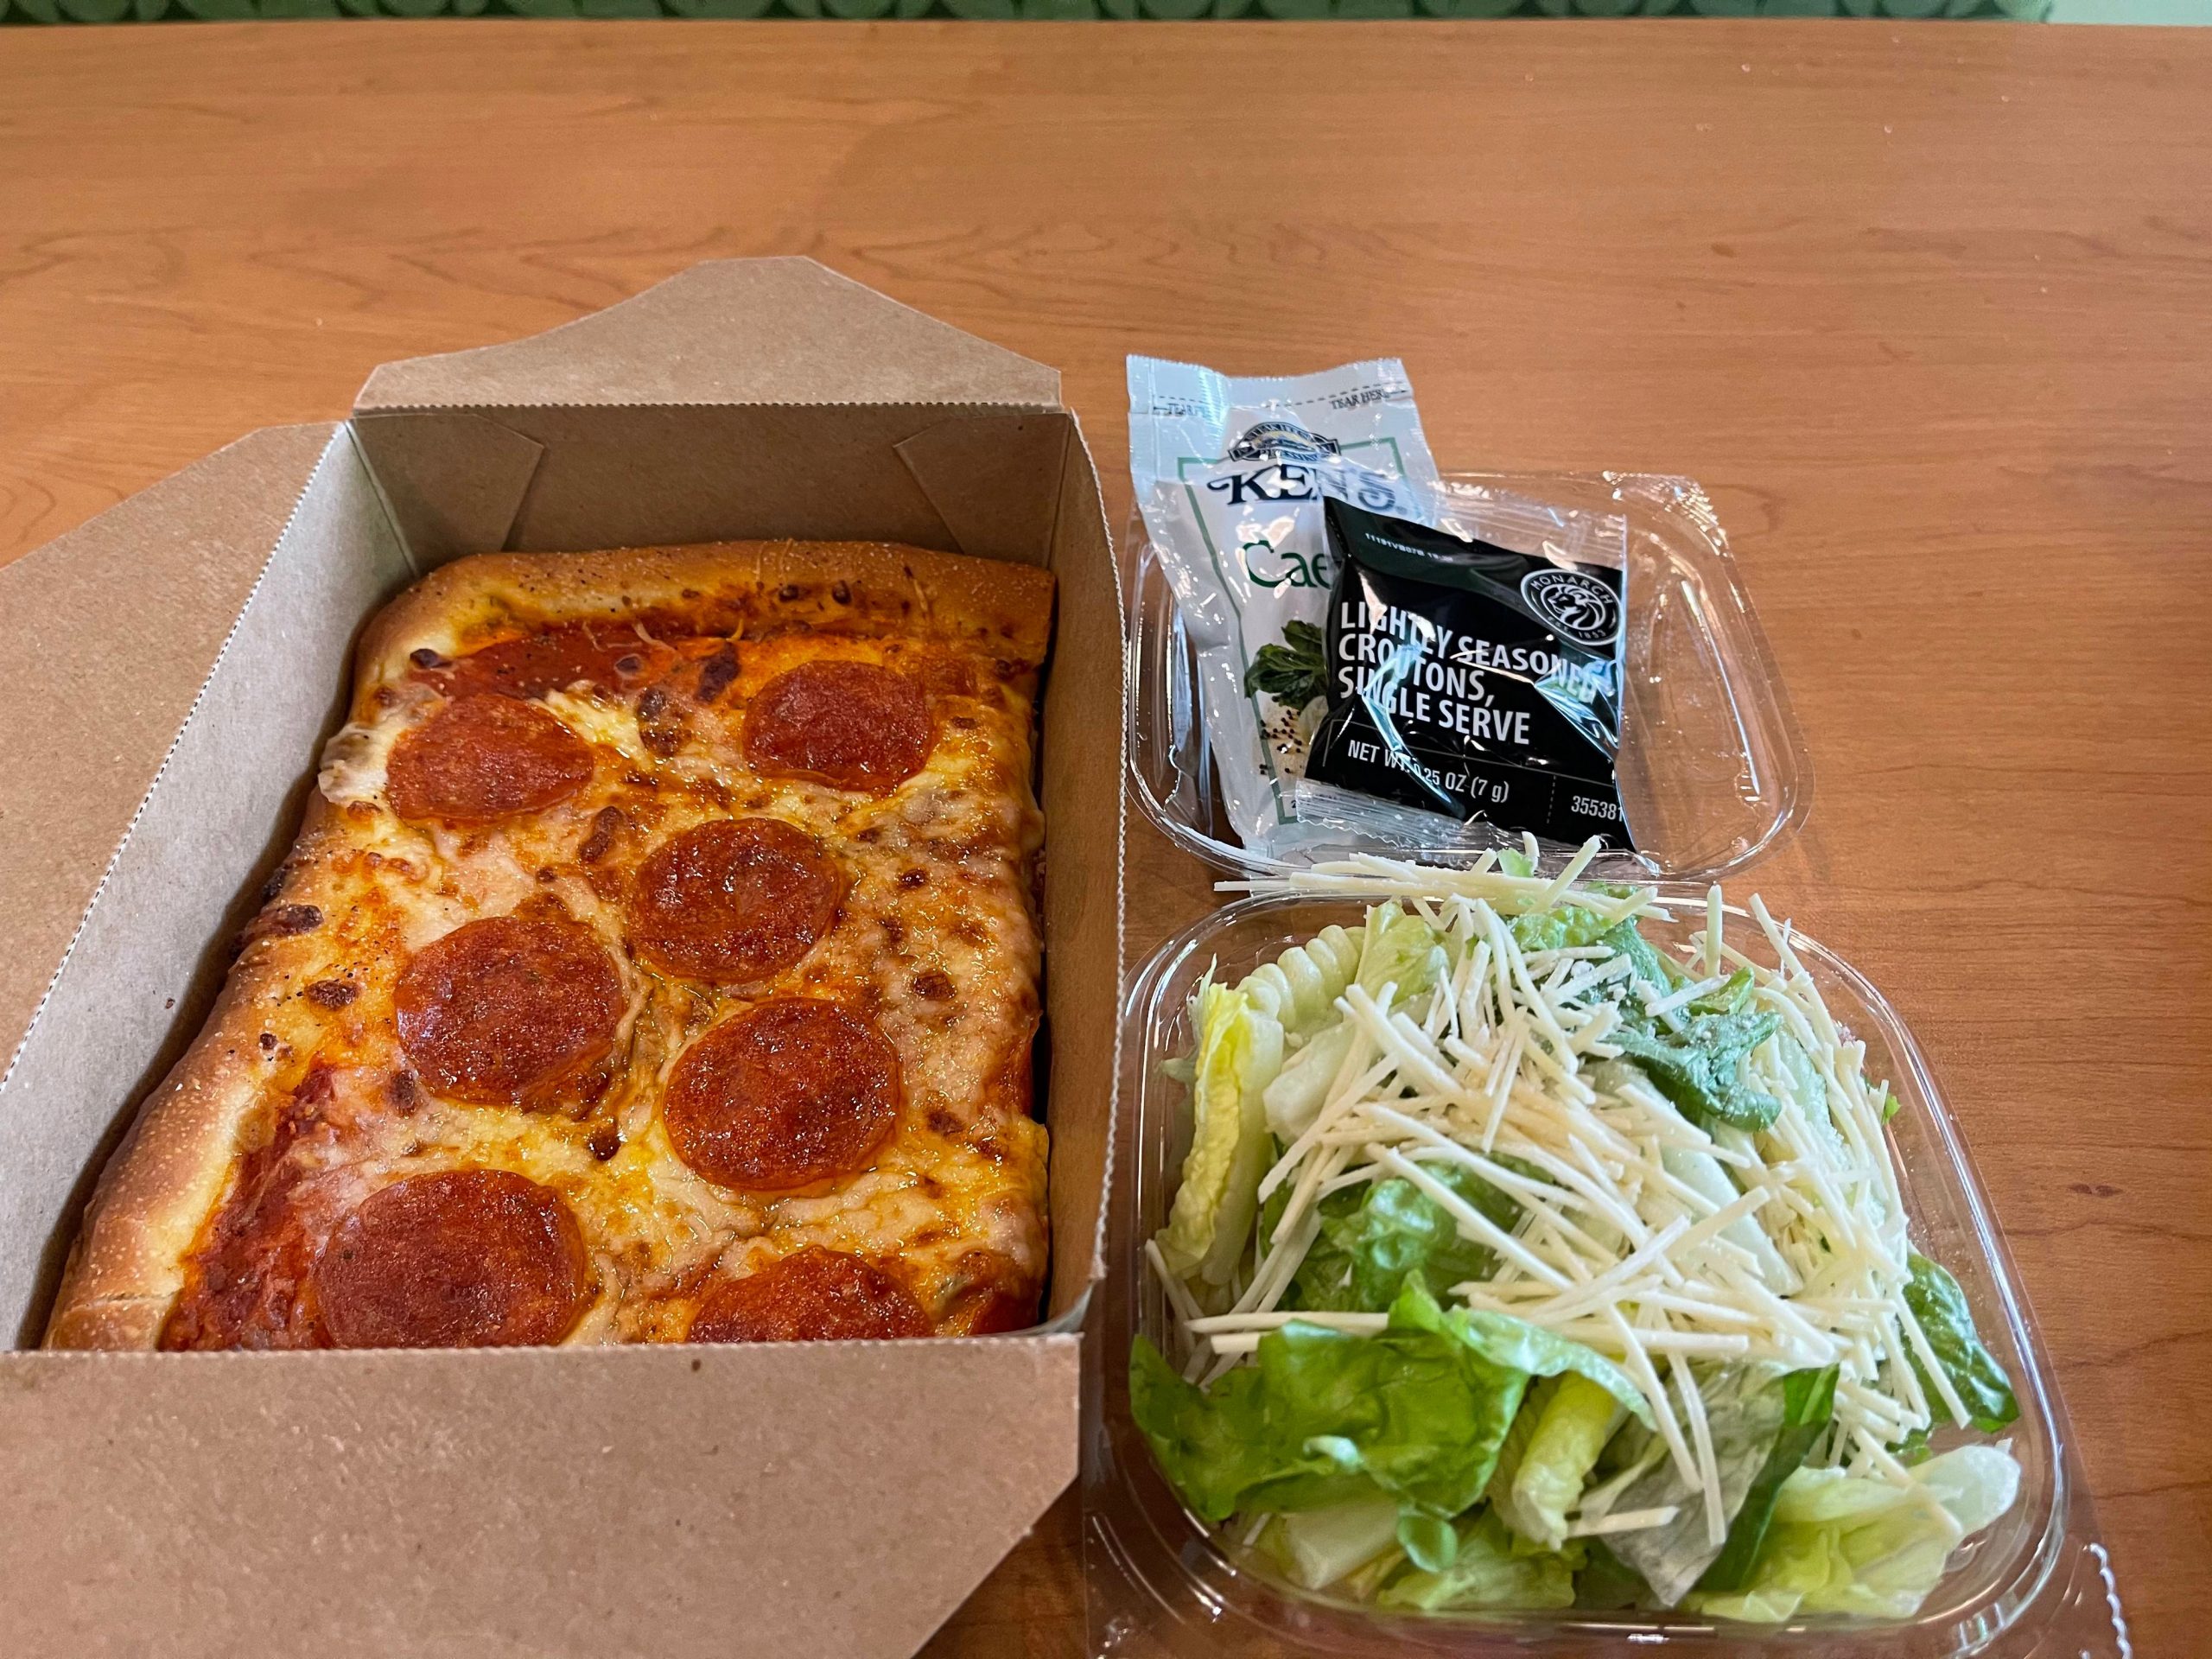
We’re all shocked that standard fare like boxed pizza hasn’t lifted Pop Century’s satisfaction score, right? Gasparilla Island Grill is a counter-service spot at the Grand Floridian. Pre-pandemic, it had a decent satisfaction rating of 88.5%. And post-reopening, that actually improved to 92.5%. But since April, things have apparently gone very poorly, with satisfaction tanking to 78% (with over 150 reviews).
- And counter-service dining at resorts seems to be having a hard time in general, because the next entrant here is Everything POP, the food court at Pop Century resort. Pre-pandemic, satisfaction was at a respectable 88.6%. Post-reopening, that dropped to 81.9%. And the decline has continued, with average satisfaction since April at an abysmal 74%.
What Does This Mean For You?
- The good news is that overall dining satisfaction seems to have recovered from the post-reopening lull, and may even be better than pre-pandemic averages.
- Several dining locations, like ABC Commissary, Harambe Market, and Ale & Compass Restaurant have steadily been increasing satisfaction. They’re worth checking out if you haven’t before.
- Places to maybe avoid? Everything POP and Narcoossee’s are a few locations that have seen significant satisfaction drops.
Are you surprised by any of the satisfaction results from the past few months? Have you had any really good or really bad experiences at WDW dining locations recently? Let us know in the comments!

You May Also Like...
-

Walt Disney World table service dining lately has been a bit....challenging. Likely due to a number of factors, the availability of…
-

It's time for another Walt Disney World dining update! More restaurants will be opening at the resort within the next few…
-

TouringPlans is pleased to welcome back guest author Ted Wioncek III. Let’s be honest, who hasn’t dreamed of taking a little…
-

Over the past 30 days, crowd levels at Magic Kingdom and Animal Kingdom have been slightly lower than historical averages. Therefore,…
Having eaten at Boma (an all time favorite) Tuesday night and Space 220 on Thursday, some thoughts. Boma’s selections have been pared back a bit, maybe 20%. Soups were still awesome and desserts, some of the rest was a bit down from memory.
At Space 220, the chefs needs to restrain the salt shaker a bit as both the Caesar and the gravy for the Flat Iron was way too salty.