
What Crowd Levels Are Park Pass Sell-outs at Disney World?
Lately we’ve been getting a few questions from people who want to understand why they can’t get a park pass for a specific date when the crowd calendar only predicts a 5. Today I’m going to try to tease apart why park capacity and crowd level don’t always line up, and take a look at the data to see what we can find out. In a future post I’ll take aim at questions about how far in advance park passes sell out, and how much availability fluctuates for a given day.
A Little History
We know that when Disney was holding capacity down very tightly (through early 2021), a sold-out park might have quite low crowd levels. For instance, in March of 2021, a sold-out Magic Kingdom had a crowd level of only 3. Even with the maximum number of people allowed in, there just weren’t enough of them to generate long lines.
As the year went on, we saw the maximum level that could be achieved in each park rise. By December, it appeared that you could get all the way to “10” again in all four parks.
The “Obvious” Answer
If you can get all (or at least most) of the way to a 10 in each park, and the park is “sold out” when we’re predicting only a 5, it seems obvious that the Crowd Calendar must be really wrong, right? It’s gonna be a 9 for sure, no matter what the CC says when you’re trying to make your plan.
The answer turns out not to be this obvious, but let’s look at the data to be confident about that.
Animal Kingdom

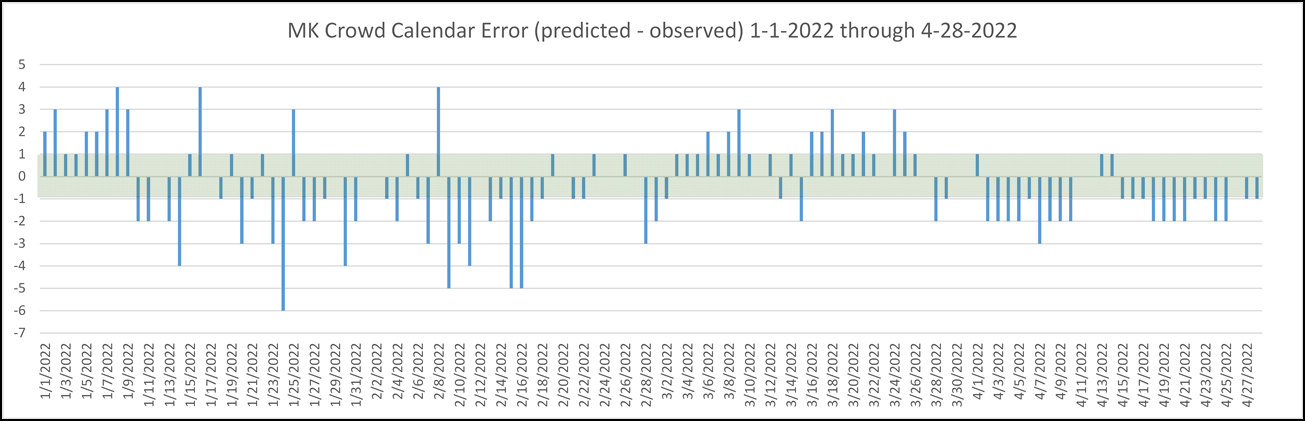
This is the first time we’re seeing these charts, so I’m going to take a minute to explain them. The top chart just shows the error between the predicted and observed Crowd Levels from January 1 through April 28. As statisticians, we think big errors in any direction are bad, but the negative errors here are “worse”. That’s because those errors line up with TouringPlans users who are grumpy that the park is more crowded than we forecast it would be.
We don’t need to peer intently at every date in this chart, just notice whether there’s a lot of severe error going on or not. A few things to note about that:
- The green rectangle covers the range within 1 of the predicted crowd level – we consider this “good enough”, so what we really want to get a sense of is how often the error bars don’t stay within the rectangle.
- A dead-on prediction doesn’t actually generate a bar, so don’t forget about those wider-than-usual spaces when you’re thinking about how accurate the calendar was.
- We really don’t care about positive error at all here — only the negative error can possibly be a case where that “obvious answer” might apply.
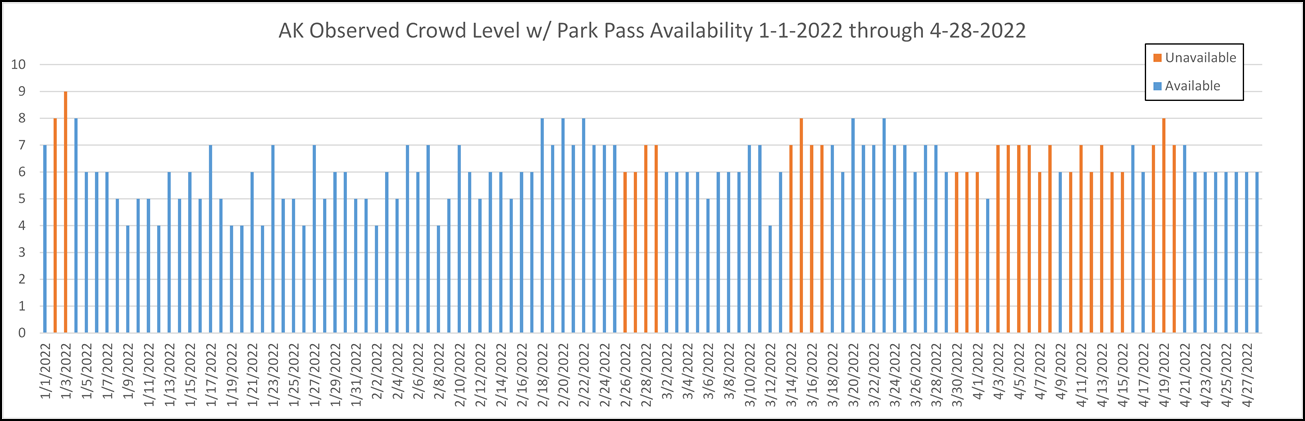
The second chart is just plotting the observed crowd level on each date and coloring it based on whether park passes were sold out or not. For this chart, dates were counted as “available” if there were park passes available the day before, even if they sold out at some point on the actual date. So for March 23, if you could get a pass on March 22 it was counted as available.
What do we see?
Well, we see that the crowd calendar has its ups and downs as usual. Remember – the calendar is a forecast, not a guarantee. Still, it does reasonably well, especially if we’re only concerned about negative error. There are only about 20 days (out of 120) with a negative error bigger than -1.
Looking at the second chart is really interesting. The lowest crowd level where we see the park sold out is only a 6. At the same time, there are days as high as 8 where the park is not sold out. So there’s definitely not a strict correspondence between pass availability and crowd level.
Even more interesting, we can pick out a few days where the observed level was 6, the error was -1, and passes were unavailable. Why do we care about this? Well – because that’s the exact situation that users are asking about: a mid-range predicted crowd level (5 in this case) with a sold-out park. And so this is our evidence that the “obvious answer” that our prediction must be way off isn’t necessarily the right answer.
Let’s take a look at the other parks.
Hollywood Studios


Over at Hollywood Studios, we see the same thing. The Crowd Calendar is doing OK. When we look at the second chart, we see that there are plenty of CL 7 days that have no availability … and plenty of CL 8 and 9 days that never ran out of passes. It does look a little like capacity tends to be running out at lower Crowd levels recently. Maybe.
EPCOT


EPCOT rarely runs out of passes. But we do see the same pattern where “7” days at the end have no reservations, but plenty of 8’s and even a few 9’s earlier and later are not sold out.
Magic Kingdom
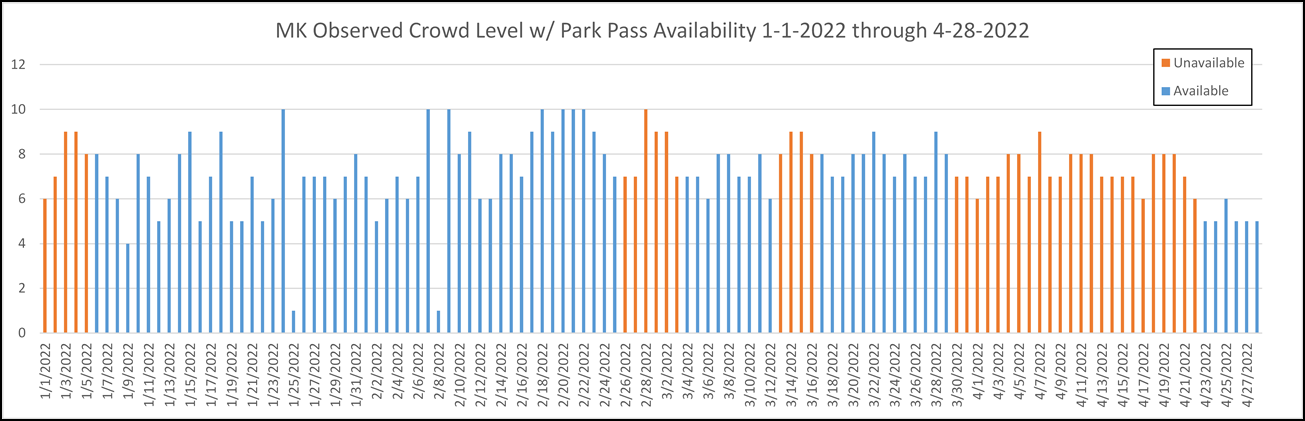
Finally, the Magic Kingdom. And again, the same pattern. Lots of sellouts at CL 7 recently, measured 10’s on other dates that weren’t sold out.
Less Obvious Answers?
Now that the obvious answer didn’t pan out, how do we explain why there’s so much variation in the crowd level of a sold-out park? The answer is that capacity is a lot more than just the rides and shows that we include in the crowd calendar.
I think that the trend towards sell-outs at lower crowd levels is likely to be real, even though it’s hard to say for sure — and it actually represents progress in bringing the parks back to normal. To see why, let’s do a simple thought experiment.
Let’s say we have a park that has only a single thing to do, and it’s an attraction – let’s call it Sploosh Mountain. 200 people per hour can ride Sploosh Mountain, so if we have 400 people in the park, we’ll end up measuring an average wait time of 1 hour if they all get in line at the same time and ride once. (This is really oversimplifying, of course). I’ll put my park capacity at 400 people, to keep things from getting out of control.

Now let’s add a restaurant to our park. The restaurant can also handle 200 people per hour. But … people don’t really have the same tolerance for waiting in line at restaurants that they do. So I don’t want to just double my capacity to 800; instead I’ll set it to 600.
Do you see what’s going to happen? As the restaurant takes some of the load off of Sploosh Mountain, the average wait for Sploosh Mountain is going to go down. My park capacity has actually gone up — but you wouldn’t know it to look at the average wait times when the park is sold out, because they’re getting smaller.
In Real Life
The above is just a made-up example to show the dynamics and highlight two key ideas:
- More things than just rides make up capacity — it’s also dining, parades, shows, and standing around.
- Capacity doesn’t just “add up” based on how much individual attractions, dining, parades etc. can handle.
In real Disney World, the past few months have seen the return of parades and other pre-COVID entertainment to the parks. This takes people out of the lines that we’re measuring and sends them to places where we don’t measure the waits.
We also know based on Disney’s statements that they haven’t been able to quite staff dining locations to full capacity. This matters because dining contributes to capacity, but it’s also a capacity limiter. It’s like bathrooms; there needs to be a certain amount per person or dissatisfaction will be rampant.
What To Take Away
At Animal Kingdom sell-outs don’t occur below Crowd Level 6, but an error of 1 or 2 crowd levels isn’t that uncommon. Do not assume that just because the predicted CL is only 4 or 5, that means the park won’t sell out.
The same thing goes for the other three parks, with HS frequently selling out at Crowd Level 7, EPCOT sometimes at Crowd level 7, and Magic Kingdom also with frequent sell-outs at Level 7 and occasionally Level 6.
A recent trend towards sell-outs at lower crowd levels may represent the return of more and more pre-COVID entertainment and dining.
Have you been surprised to find park pass reservations sold out when only middling crowds are predicted? Let us know in the comments!

You May Also Like...
-

This is a follow-up to my recent Park Pass analysis blog post. The big unanswered question: If Park Pass availability does…
-

What Is Disney's Park Pass Reservation System? When it reopened in July 2020, Walt Disney World set capacity limits on the…
-

Our crowd level predictions for Disney World parks have been a little high lately. As Disney attractions start returning to normal…
-
This weekend will have the longest park hours since Walt Disney World re-opened in July. Extended park hours are a signal…
Great explanation! I was getting very anxious about my upcoming trip with moderate crowd predictions but many sold out parks. Yet I have noticed on MDE that waits do seem to be lowering a bit from the Spring Break madness, and hot Genie + rides aren’t going quite as quickly.
Hi Haley, it’s always hard to predict what the future will bring and many are taking long-postponed vacations. But it does seem that things are calming down a bit, and hopefully that will continue as Disney covers that last bit of ground towards full staffing.
Thanks Jennifer – I love data-based visual aids. Your explanations and examples paired with the graphs are a great way to explain messy data.
There might additional considerations for APRs and CLs not aligning too. I think controlling crowd flow is a big part of the new game plan. With limited resources/support (CMs, rides, food, shows, space, shade), steering crowds is more important than capping crowd sizes. Hot, tired people in long lines aren’t happy, but they’re also not eating or shopping. Limiting APRs spreads the guests across parks and staggering opening times encourages more guests to start elsewhere.
WDW seems to be pushing guests out of choosing MK APRs l by keeping opening it later than the others and by limiting what is available at Early Theme Park (Half-)Hour. Plus MK is open later than the others, so it’s easy to plan to hop there later.
At least they’re pushing me elsewhere, if I’m going to get up early, I want to have more options.
Hi Jenn, glad you enjoyed it!
Crowd flow is _always_ part of Disney’s plan, so I’m sure you’re right. 🙂 But keep in mind that we don’t have attendance figures – we really have no way to know how many people are in the parks at a given crowd level.
In the past, MK was routinely open later than the other parks (often until 11 or midnight on weekends), and available attractions during Extra Magic Hour were limited too — to the same attractions actually, I think. So I see the later hours here as again something that’s “coming back” rather than something new.
Are there any insights on how far in advance of a date that passes “sell out”?
You can look on the Disney website to see which dates have sold out – I can see that on some dates in May and June some parks don’t have any reservations left but surprisingly on 4th July all parks still have reservations available.
Hi Dan, I know, this is the question that really matters for planning, right? I’m going to take a look at this in a future post.
Thanks. I know we can look at current availably, but getting a sense of how far out they sell out would be interesting.
What is the number on the Y axis of the second graph?
The second graph in each set of graphs (just positive values) is the TP predicted crowd level for that day.
Hi Dan,
It’s the observed crowd level for that day. The predicted level isn’t shown explicitly, but the two charts line up so you can get it by comparing them.
Appreciate the data and analysis, thanks.
I think there is another trend at play. Reservations ‘sold out’ much more frequently in April for the same crowd levels that they did not sell out for earlier in the year. Disney has been taking hits for Genie+ providing very little value on high crowd days. I believe they started to throttle park capacity mid-April for two reasons:
1. See how limiting park capacity would impact Genie+, and/or guest experience.
2. See how those limitations would be perceived by the park going public either for lack of available reservations, or if perception of Genie+ or park experience improved.
It seems counter intuitive that as more shows and dining opportunities returned in the parks throughout the year, that park reservations would be less available if it was strictly based your examples of park capacity. There was more capacity available in April than February for the same crowd level based on ride queue length.
Hi Chuck,
It might be that Disney was being more restrictive about how many people were allowed in during April; I’m sure they are aware that many guests have frustrations with Genie. But we don’t have any way to know how Crowd Levels correspond to the total number of people in the park. If this model is correct, then there may have been more people in the parks on those sold-out days in April than there were on the non-sold-out days in February, even though lines were shorter. But Disney doesn’t release attendance figures, so we really have no way to know how overall attendance compares.