How Crowd Levels Affect Your Waits In Line at Disney World
One of age-old things we work on is this: “How does a specific crowd level feel?”
It may seem like a simple question. After all, we have three really smart statisticians. We have nearly a million wait times from attractions in every park. We can tell you, to a decent level of accuracy, that next Wednesday in the Magic Kingdom will have higher waits than 47% off all the days we’ve ever measured at that park. But it’s really hard to convey “47%” into an idea of what the park will feel like. If you’ve never been to the Magic Kingdom before, the crowds on an average day may seem huge. But if you’ve only visited during holidays, the average Wednesday in May probably feels uncrowded.
Keep in mind that one of the best ways to avoid crowds is to have a Touring Plan. On days with the lowest crowd levels, it is difficult to have a bad time in the parks, even if you don’t follow a plan closely. On days with higher crowd levels, you may have downright miserable waits if you hit the park without a good touring strategy. As an analytical person, I’d like to see what those different crowd levels mean in a chart with pretty colors.
To illustrate this, I’m going to use the Touring Plans software to simulate the experience of going to the Magic Kingdom on days with ten different crowd levels. I’ll use three different touring strategies: visiting all of the attractions by walking clockwise through the park (i.e., starting in Adventureland and finishing in Tomorrowland), walking counterclockwise, and using an Optimized Touring Plan. The first two strategies may be simple, but many guests follow them.
All simulations use attractions from the Magic Kingdom One-Day Touring Plan for Tweens and Their Parents premium Touring Plan. I set the starting time at 10:00am because more guests arrive around that time than at park opening. And to keep the plans simple, I removed breaks and nighttime entertainment. Also, Big Thunder Mountain Railroad is not included since it’s currently closed for refurbishment. That leaves 16 attractions.

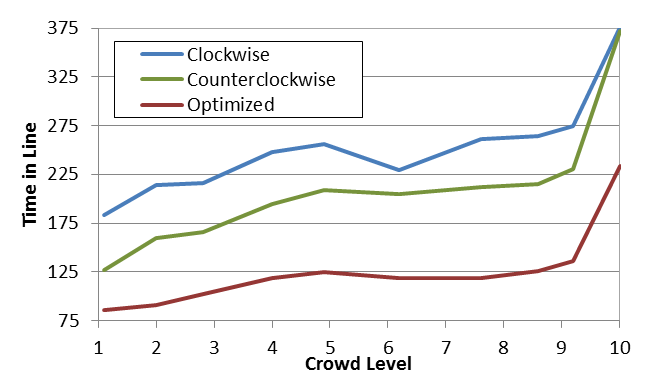
Not surprisingly, in this test the Optimized Touring Plans have the lowest waits. What is surprising, however, is that there is not immense variation in the total amount of time these Touring Plans take across crowd levels between 5 and 9. One reason you see a dip in the waiting times at crowd level 6 is due to variable capacity rides: Disney can add ride vehicles to an attraction to increase the number of riders at some attractions like “it’s a small world” and Splash Mountain. In addition, Disney adds more character meets and shows as the crowd level goes up. All of these tactics help reduce the number of people standing in line.
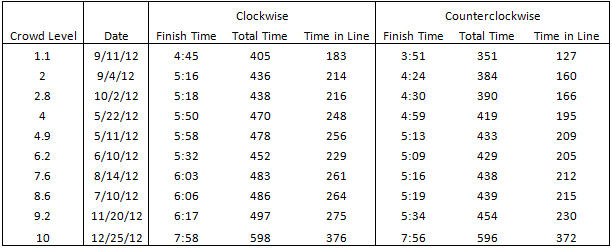
Another thing this demonstrates is that in Magic Kingdom a counterclockwise Touring Plan is more efficient than a clockwise plan. This is probably because lines build more quickly at attractions such as Space Mountain and Buzz Lightyear’s Space Ranger Spin than they do at Pirates of the Caribbean and Jungle Cruise.
Finally, these examples clearly demonstrate why we say that using a Touring Plan is significantly more important than picking the right park or the right day or week to visit.


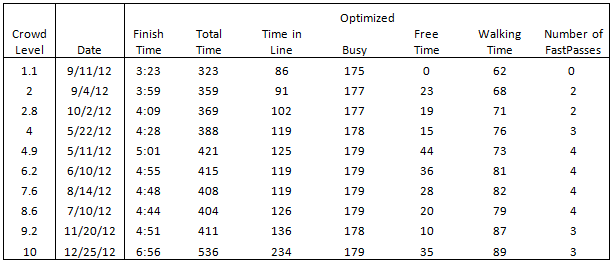
To minimize your time walking and standing in line, the Optimized Touring Plan software determines the best use of FASTPASS. Sometimes it is less efficient to backtrack and use a FASTPASS than to just wait in the standby line.
With the Personalized Touring Plans at TouringPlans.com, you can run the same simulations for your favorite attractions and dates. The new Evaluate option (see our video tutorial) lets you calculate the details (total time, wait times, walking times, etc.) of your itinerary for an attraction sequence that you define. Even with the best laid plans, anything can happen while you are in the parks; fortunately, we have you covered with the Lines mobile app, which allows you to re-optimize your plan on-the-fly based on current park conditions.
Finally, let us know whether you’d like to see more posts on the topic of “park feel” and crowd levels. Thanks!


If there’s no significant difference in wait times between level 5 & level 9, isn’t this a serious flaw in the crowd calendar? You don’t need a 10 point scale, you really only have 6 different crowd levels (based on wait time). Well, not crowd levels, but wait time levels. But aren’t the wait times really what the calendar is predicting?
This is great info. Really appreciate this TouringPlans capabilities we now can get. It will be interesting when the new “XPass” kicks in. I would think that would radically all your historical data that you’ve accumulated over the years. I wonder how long it will take you guys to find a new “equilibrium” and how to accurately account for the new FastPass mechanism????
This is my guess on how XPass will work. XPasses for attractions are just FASTPASSes that you receive prior to arriving to the park. There will also be XPasses available in the park, I’m hoping it will work just like the current FASTPASS but you can pick an available return time window. I do not expect the total number of XPasses and FASTPASSes per day to change. The capacity of the attractions is not going to change so our historical data should still be meaningful. We are already working on the ability for users to enter their XPass data.
Great article! As essentially a first timer this September, I have a lot of curiosity and yes, some anxiety about making RD, balancing the use of a TP with trying to keep the “vacation” feel in my vacation for myself and my family, and getting the most out of our time at the parks. Would love to see more articles like this!
Excellent article. Every Nerd Cell in my body is quivering! My only real surprise is that there is over an hour of wait on a level 1 day. Seems like almost everything is a walk-on then. Do wait times include actually walking through a long queue, like HM, or is it actual standing still time? I guess all the minimal waits still must add up to something!
Excellent article – very interesting graph, together with the explanation as to why the lines on a 6 day may be less than on a 5 day.
Would love to have to more articles on the same theme.
Brilliant post – thank you!
I’m amazed that even at the low crowd levels, you can trim so much time off waits with the touring plan
I would also be interested in the similar scenerios for the other parks too.
Really interesting post – would love to see more like this. The plateau (and the explanation – adding more capacity to offset crowds) makes a lot of sense if the X-axis is # of people in the park. However, what’s throwing me is that Touring Plans typically defines “crowd level” as the length of wait for rides. If that’s the case, does the “plateau” result from a larger difference between 1 and 2 (and 9 and 10) than between a 4 and a 5? If TP is assuming bell-curve-like distribution to come up with percentiles in crowd levels, that would seem to be the case. Okay, taking off my nerd hat now ….
Hi Brian,
Just so you know, the crowd levels are a percentile value. So a crowd level of 5 is only the median of crowds out of the 365 days of the year.
That is why the difference between a level of 9 and 10 is so big. It’s not just an increase of 10% in crowds and wait times, it is likely an increase of 50% (the typical July day vs. Christmas Day)
Just to clarify, the ranking is out of all days, not just 365 days. So a crowd level of a 5 will be similar in 2009 as 2012, or 2013. We have over 2,000 days that are ranked. This is why on any given day if you look at the Crowd Calendar you will not always see 36 or 37 days at each level.
Steve – great article. Could you please explain this further. There are far more than 36 ’10’ days and far fewer than 36 ‘1’ days on the current 365 day calendar. Doesn’t seem to make sense – there’s obviously a reason – can you please expand on this. Thanks!
10% of the 2,000 days Steve mentions have a crowd level of 10, but those days are NOT equally distributed across each of the 6+ years covered by those 2,000 days.
If, for example, there are 50 days with a crowd level of 10 day over the next few months, that simply means that those 50 days are predicted to be among the 10% worst days (in terms of wait times) over the entire wait time data set (which starts in 2006)
Lots of crowd level 10 days over the next year might suggest that Disney is succeeding in packing people into its theme parks, thereby increasing waits. With the expanded Fantasyland and an improving economy, that seems plausible.
Jeff–
David is correct. Just to add to the explanation… Disney’s goal is to have no slow period. They offer special events and discounts to encourage guest to visit at off times. With our years of data we can see their efforts are working. Over time 9’s and 10’s are becoming more frequent on the crowd calendar.
Totally agreed – so the plateau in the graph above is at least partially due to the fact that the crowd levels are being graphed as though they’re equally spaced when in fact they’re not. Instead, if actual park attendance was being included on the X-axis, the trend would likely be much more linear.
I’m just trying to figure out how they got data for the rest of 2012 🙂
I enjoy posts like this, might be cool to see someting similar on how hours impact the crowd levels across all 4 parks, thank you!
also might be cool to see same analysis for the other 3 parks. thanks again!
Yes! I would love to see more posts like this (and ASAP). Our visit this year is in July (completely unavoidable), so I’m loving all the information/stats on how to handle the parks on days with a crowd level of 9/10. Also I recently became a subscriber, so I guess I better get started on figuring out my touring plan!
What’s really interesting to me is that on a day that is 4.9 the total time is 421 minutes with 125 minutes waiting in line but a day that is 7.6 the time is less (total time = 408 with 119 waiting in line).
It’s actual consistent across all three models. the 4.9 day takes the longest. Counter-intuitive…
Nothing like a good breakdown of numbers to get someone excited. From a fellow stats geek, thank you. See you in the parks on Friday!
This is fantastic! What a great visual illustration of how a good touring plan makes all the difference, regardless of the crowd levels. (This also explains why my family has always visited over Easter break, getting to do and see everything we wanted using good touring plans, and without experiencing the long, horrible lines our friends who went during the “slow” times of year complained about.)
If I recall correctly, the Crowd Level data represents percentiles, i.e. a “1” day is in the lowest 10% of days and a “10” day is in the top 10%, and a “10” day is not 10x more crowded that a “1”. It would be interesting to see each Crowd Level translated to an average attendance for days with that level. That might better help people visualize what it looks/feels like versus what the effect on wait times is.
It would be great to show attendance levels but Disney does not release the daily attendance.
I think that a problem that people have with the Crowd Level is that when you say “Crowd” they think “Number of People”. Since the Crowd Levels are determined by looking at wait times across the parks, not number of people in the park, so perhaps it would be better to call it “Wait Level”. As you pointed out, on certain days the park can appear crowded due to the number of people there, but the wait times can still be reasonable because of additional ride vehicles, shows, and character meets.
This is a fantastic post. I love it.
I’m picking, but I would have set the left axis to 0-400. That would have visually demonstrated better how much you are saving with the touring plans.
I would love more posts on this, and something I think people would be interested in is what the relative size of the crowd at each different number.
It’s also really interesting how big a gap there is between 9 and 10…
I like the comparative pictures from Fantasyland as a visual illustration of that area throughout the day. Perhaps a similar idea of comparing mainstreet, fantasyland, tomorrowland, etc at different crowd levels at the same times would be a good visual to go along with these numbers and graphs. A great visual might also be strollers? Or People eating a restaurant?