
2021 Disney World Crowd Calendar Retrospective: TouringPlans vs Disney
A little while ago in November, I wrote about all the Disney ticket prices in 2022. In that article, I showed a heatmap of the single-day prices and I said it looked sort of like a crowd calendar. The very first person to comment on that article said:
Would be interesting to see what the current crowd calendar looks like for all of 2022 with the same colour scale next to the top image in this of adult 1 day prices.
And I was like “Whooooo, an idea is born!” TouringPlans has a crowd calendar. Disney has a crowd calendar (kinda). We should have a contest!
Is This a Fair Fight?
Well … no. It’s kind of more like a no-holds-barred Demolition Derby where each side gets to soup up their car with extra features and some sneaky tricks like dumping oil on the road or poking a spike out the side of the car to pop the other guy’s tires. Each side has a couple of advantages.
What are the TouringPlans Advantages?
TouringPlans has two big advantages. The first is that we get to make updates with improved predictions a few times a year, while Disney does not routinely change ticket prices once they are released. I hope I don’t need to explain why that’s good for us. The second is that we choose the yardstick.
When I say that we choose the yardstick, I mean that we’re the ones who get to say what the crowd level actually turned out to be on any given day. This is a critical advantage because there are many ways to define what it means to be “Crowd Level 5”. TouringPlans defines the crowd levels based on the park wait times, but Disney’s ticket prices (which we’re using for their “crowd level predictions”) are most closely linked to how many people they think are going to come to the parks.
That means that if zillions of people actually do come to the parks, but they’re all in lines for merchandise and food instead of rides, we’re going to say the crowd level is low. If Disney predicted high attendance with their ticket price “crowd level”, then we’re going to say they were wrong even though they were actually on the mark. Too bad, so sad. (In case you didn’t guess, I’m rooting for TouringPlans).
You might wonder why we don’t measure Disney’s performance against a scale that more accurately reflects what they were trying to predict, and that’s a good question — it would certainly be a fairer way to do it. The answer is that Disney doesn’t publish attendance figures, so we can’t. Gotta go with what you know, and the wait times are what we have numbers for.
What are Disney’s Advantages?
 Don’t worry about Disney, they’re over there in the other corner with a couple of tricks up their own sleeve. For starters, we get to adjust our predictions, but they have access to a lot of data to help them make course corrections in other ways. As an example, if hotel bookings are looking a little soft for June compared to expectations, they can try to boost attendance closer to their target by releasing a discount.
Another advantage that Disney has — and it’s a doozy — is that they control operations, which means that they can make changes to the relationship between attendance and wait times.
An easy-to-understand mechanism here is attraction capacity. If Disney only runs one track on Space Mountain, or two out of three theaters for Soarin’, this cuts back on staffing and other costs of operation. But it also means that these attractions will take a lot longer to process 1,000 people than they did when they were running at full capacity. Crowds might be lower, but wait times might stay the same (so you shouldn’t count on a low ticket price meaning no waits). Since our predictions are based on how Disney chose to set operational capacity for attendance levels in the past, any changes they make in real-time can reduce our accuracy, and we can’t do a thing about it.
If It’s Not Fair, Why Do It?
First, it’s fun! Second, it gives us a chance to remind everyone how we measure crowd levels, and an educated consumer is our best friend. But perhaps the most important reason is quality control.
Hey @TouringPlans, you really muffed it – Epcot predicted to be a 6 today, but I’m here and it’s a ghost town. Definitely more like a 2 or 3, you guys were way off!
I assure you that nobody ever tags us like that on social media when we overpredict (but you can be confident that when we underpredict, we hear all about it). When you’re in the business of prediction though, a miss is bad no matter which direction you whiffed in. Looking at a whole year’s worth of data like this helps keep us honest about how well we’re doing and tells us if there’s somewhere we can try to improve. The comparison to Disney helps to provide context about what the limits of prediction ability are. And assuming that our retrospective shows that we were mostly on the money, it gives us something to console ourselves with when we have a bad day and people are pummeling us on Twitter.
Setting Up the Crowd Calendars
On the TouringPlans side this is pretty straightforward because we already publish our crowd levels as a crowd calendar. The only challenge is that we actually have 5 numbers each day; one for each of the parks and an overall number for the resort. I decided to make it simple and just use the resort-wide prediction.
Getting to a Disney crowd calendar was a little trickier because we want it to have 10 levels but there are 21 different ticket prices. I also wanted the number of days in each level to match our ideal crowd level distribution — we’ve already seen that this isn’t quite apples to apples, but I wanted to get as close as possible. Since the breaks between price tiers didn’t match up with the number of days for each level, I had to do a little bit of assigning things by hand, but I think it came out pretty well.

Now that we’ve got each day assigned to a crowd level, we can make a visual of the crowd level predictions. Disney’s is first below, and TouringPlans predictions are just underneath to make it easy to compare.
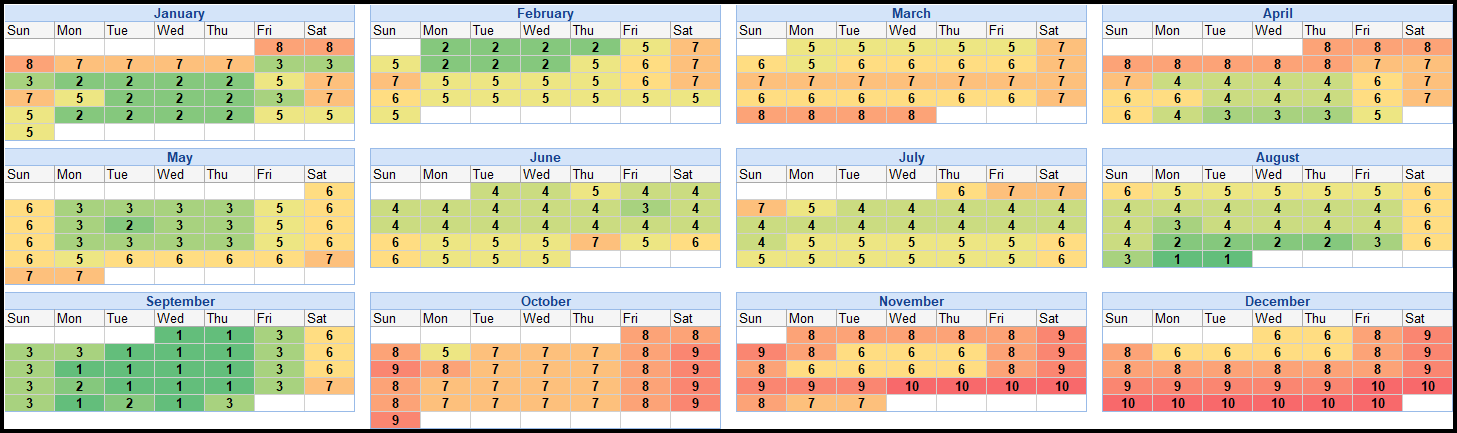

You might be thinking that the TouringPlans calendar looks really skewed to lower levels and the Disney calendar has more red in it. This is a good time to remember that for the TouringPlans calendar you’re not looking at the predictions that were in place on January 1, 2021. Of course we never updated anything retroactively, but this year was kind of a wild ride! Between continuing effects of COVID and capacity changes at Disney World, we published 13 crowd calendar updates this year (twice as many as in 2019); most of them were downward trending.
How Did These Calendars Stack Up to Reality?
We’ll need to get to some summary stats eventually, but I want to stick with the heatmaps a bit longer because they’re so good for seeing where and when things happened. I took the observed crowd level for every day and subtracted it on each calendar — that means that underpredictions are negative and overpredictions are positive. Remember when I said that from an accuracy point of view overpredicting is just as bad as underpredicting? I’ve colored these orange (overpredict) and purple (underpredict) so none of us make the mistake of thinking that the positive numbers are “good” just because they’re green. Days that are off by only one level are considered to be “good enough” and aren’t colored in these charts.


So one thing that really leaps out is that for the most part both calendars struggle in the same places. Disney is overpredicting by more, but this is a good time to remember that capacity limits can do weird things to the measured crowd levels. In March and April Disney looks like they’re way overpredicting, but at the same time, there were many days in these months when no Park Pass reservations were available. It’s always dangerous to draw conclusions from data that isn’t quite in its proper context (that won’t stop me), but I’d say that these “crowd level” prices represent what Disney thought demand would be, that they turned out not to be able to supply.
One piece of data to support this hypothesis is that in May Disney World started actively hiring and announced the resumption of its College Program. By June both calendars are overpredicting by the same amount, and in July Disney is mostly getting it right and TouringPlans is only overpredicting on weekends. Then came August, and who could forget what happened when Delta came to town?

In four months Disney World went from “hire as fast as possible” to “nobody’s in the parks” — and I was there in late August and I can tell you, there really was nobody in the parks. I don’t expect to ride Flight of Passage back to back in under 10 minutes ever again in my life.
October was arguably the worst month for the TouringPlans calendar. It looks like Disney thought October would be quite busy with the 50th anniversary. We didn’t think it would be quite as busy, and after seeing what happened in the first week of October we lowered our estimates even more on October 7. That turned out to be a mistake. Although Columbus Day often sees a bump, it doesn’t usually last the whole week. Our best guess is that a lot of those people who cancelled their August trips rescheduled for October, and only one week later we undid our update and put back the original predictions.
How Did the Calendars Stack Up to Each Other?
At last, the moment everyone’s been waiting for: we’re going to announce the winner!
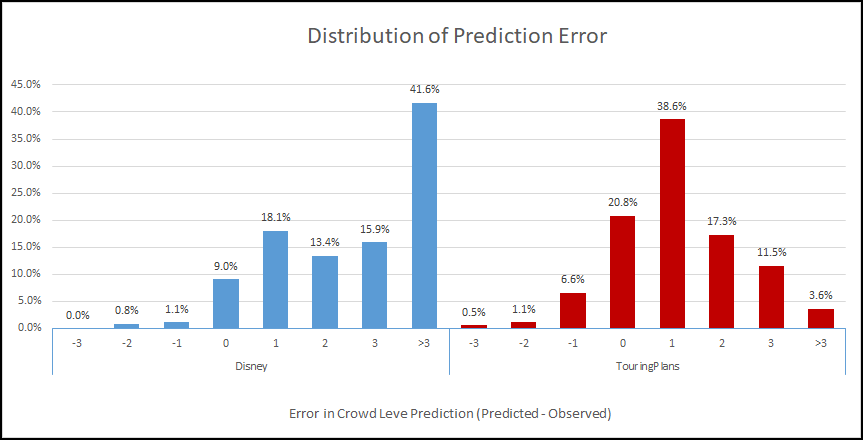
When it comes to the head-to-head matchup there’s only one calculation that really matters: who got it right the most often? From that perspective there’s really no contest; TouringPlans was exactly on target about 20% of the time, and within 1 level on 66% of days — a full two thirds. In contrast, Disney was within one level only 28% of the time. Even a statistically unjustifiable re-centering of Disney’s distribution can only push their score up to 58%.
I’m very happy to see TouringPlans come away with the win, and I bet that many of you aren’t very surprised either. You can decide for yourself whether using Disney’s ticket prices in this unorthodox way means that there ought to be an asterisk next to it.
What to Take Away
Prediction of any kind has limits. No matter how skilled we are, a rainy day is likely to see lower crowd levels than we predicted and beautiful fall weather can lead to underpredicting by a notch or two. Although Disney’s ticket prices and the TouringPlans calendar are working with different measurements, comparing their performance helps us understand how much error came from things that couldn’t be anticipated or controlled.
In 2021 our calendar was accurate two-thirds of the time, and almost all the error was predicting longer lines than we actually saw. Here are some suggestions so that you can get the best experience.
- Check crowd-level predictions shortly before your trip, since we make updates on a regular basis. Subscribers can use the crowd tracker and get notified automatically when we make updates to days they’re following.
- Take the time to look at the predicted attraction wait times for the park you plan to visit. Sometimes we get complaints from people who are in the parks on a level 3 day and are surprised by a 40-minute line; they don’t realize that what they’re seeing might be par for the course at level 3. Having realistic expectations can be the key to a great day.
- If you use a touring plan, reoptimize it every now and then during the day. Once the park opens our prediction is frozen in history, but we update our day-of wait time estimates frequently based on what we see in the parks. Even if our predicted crowd level turns out to have been way off, reoptimizing will help you to have an optimal day.
- Be careful with the Epcot crowd level. Our prediction is based on wait times for attractions, but Epcot has a lot of Festivals that can fill the World Showcase with people who are not riding any rides. If there’s a Festival going on then the difference between our prediction and what the crowd “feels like” will be most noticeable on weekends and in the late afternoons and evenings.
What are your best tips for using the crowd calendar? Should we make this retrospective showdown an annual event? Do we need to put an asterisk next to our victory over Disney in 2021? Let us know in the comments!

You May Also Like...
-

We have been holding off on doing any big Crowd Calendar updates until we saw how the crowds were in 2021.…
-
This Crowd Calendar update has updates going through 2022. For the rest of April and summer, the crowd levels are adjusted…
-

Disneyland Resort has been reopened for 25 days and crowds are already starting to build. After opening to mostly crowd level…
-
Wait times at Universal Orlando Resort are up, especially at the Universal Studios Florida park. We have seen crowd levels at…
Really interesting, glad I suggested it!
Me too! I didn’t call you out by name in the article because some people don’t like that, but I was hoping you saw this. 🙂
Do you know if/when the remaining days in the January 2022 crowd calendar will be update? Disney just made some changes to park hours. I’m wonder if that will make any changes to TP’s crowd calendar.
Hi Adam, we don’t currently plan to make any more updates before February. Disney actually makes changes to park hours only a couple of weeks in advance like this frequently, and the impact on calendar predictions is pretty small. Thanks for reading!
Great read. Was @Disney the 3rd week of November & thought the crowds levels were higher than predicted. Waited in lots of lines over 45 minutes even following a touring plan optimizating after if ride; also on Tuesday November 16 – 4 out of the 8 adult attractions were down for extended periods of time. Truly missed parades, shows & characters. With Disney’s starting Genie+ & LL the magic is gone, memories fewer & I will not be back for many years! I’m sure Walt is screaming down to the powers on high what have you done to my vision!!!
Hi Cindy, it’s definitely the case (in some parks more than others) that long lines even on low crowd-level days are the norm right now because there aren’t as many other things like parades etc. to do, just as you note. Glad you enjoyed the article.
I love me some numbers to munch on for desert! This was a great read. Disney clearly thought they’d be getting a lot more folks in October…but in a way that was accurate. They just weren’t getting on rides!
Thanks Maggie! Yes, usually the park with the biggest discrepancy between the “feels like” measurement and the line-based measurement is Epcot — and specifically the World Showcase in Festival Season. But Oct 1 in the Magic Kingdom proves it can happen anywhere!
Any chance the Disney heat map can be linked on the crowd calendar page annually? An excellent planning step would be to find the “value” days where the discrepancy between ticket price and crowd prediction are most favorable – that is, within a particular Disney price tier, what are the lowest crowd predictions?
Hi John,
That’s an interesting idea. In the meantime, you can find all the 2022 heatmaps (including for multi-day tickets) here: https://touringplans.com/blog/every-regular-disney-world-ticket-price-in-2022/
Well reasoned, well articulated, well done!
🙂
Great article! Thank you!