Disney Data Dump April 29 2026
We’re settling into one of the most reliably good stretches of the year at Walt Disney World! And if you’ve been following along, this week fits right in with what we’ve been seeing lately. Crowd levels are staying low, wait times are staying manageable, and there aren’t any major calendar events shaking things up. But that doesn’t mean everything is flat or predictable. This time of year is where smaller factors start to matter more. Like how different parks handle even modest crowds and how downtime shifts wait times around.
On paper, this looks like another calm, easy week. And in a lot of ways, it is. But there are a few patterns underneath the surface that are worth paying attention to, especially if you’re trying to make the most of a trip in this late April / early May window.
Observed Crowd Levels April 21 – 27
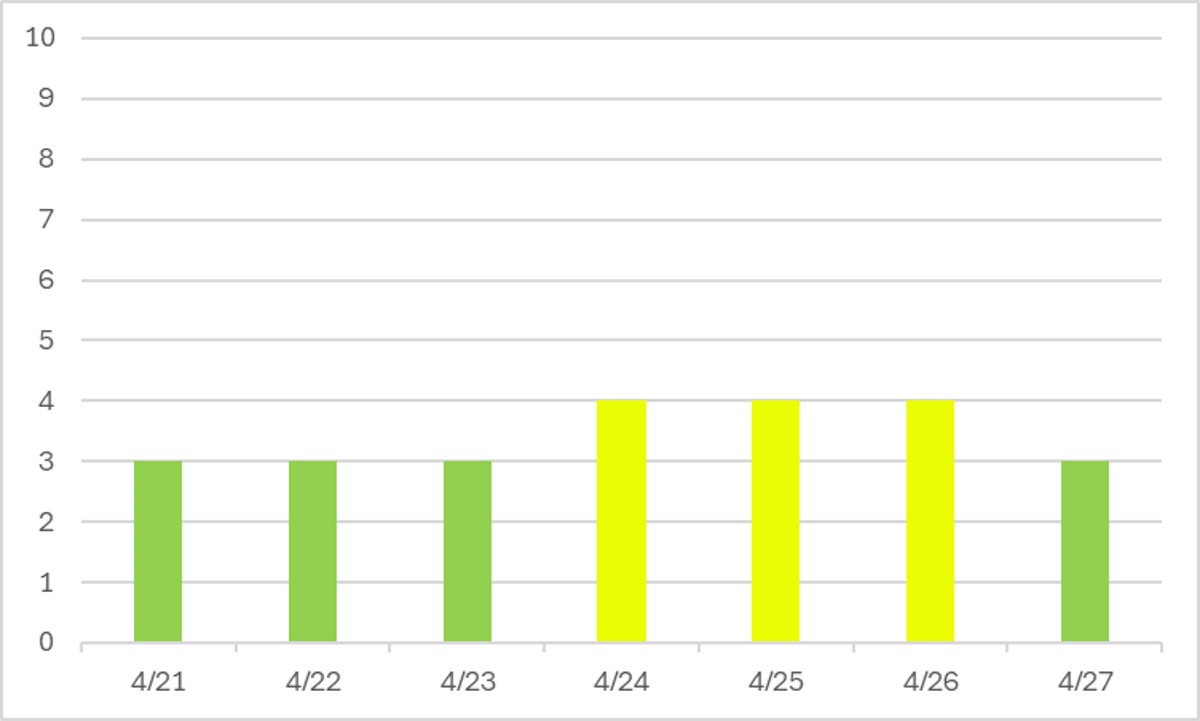
Last week I called that this week we wouldn’t get above a crowd level 4 … and I was right! I’m a little surprised that we also didn’t dip down to a crowd level 2 on any day, but this is still a pretty glorious late April week. The weather was perfect and the crowds were low.
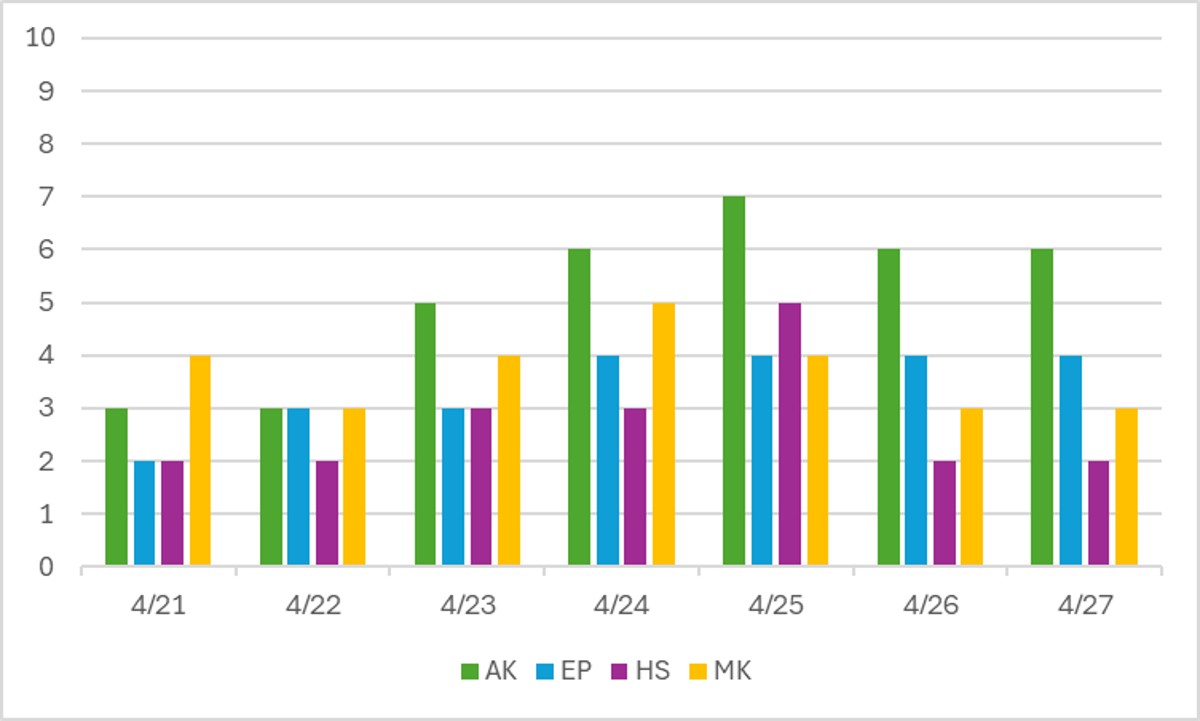
Once again, Animal Kingdom is our standout park of the week. Friday and Saturday saw the highest crowds overall, and Animal Kingdom felt the biggest impact to its wait times as a result. Capacity, capacity, capacity. No other park ever got above a crowd level 5 over the past seven days, but AK hit a 7 once, and a 6 three different times. The good news is that you can easily still plan an Animal Kingdom day without any long waits if you show up early or stay late.
Performance of Crowd Level Predictions
Each week, I give you a very transparent look into how the TouringPlans crowd level predictions performed. Each day at each park is one data point, so each week we have 28 different crowd level predictions to evaluate. Any time a prediction is within one or two crowd levels, things won’t really “feel” much different than what was predicted. Being off by 3 or more crowd levels is where you might feel that difference in wait times throughout the day.
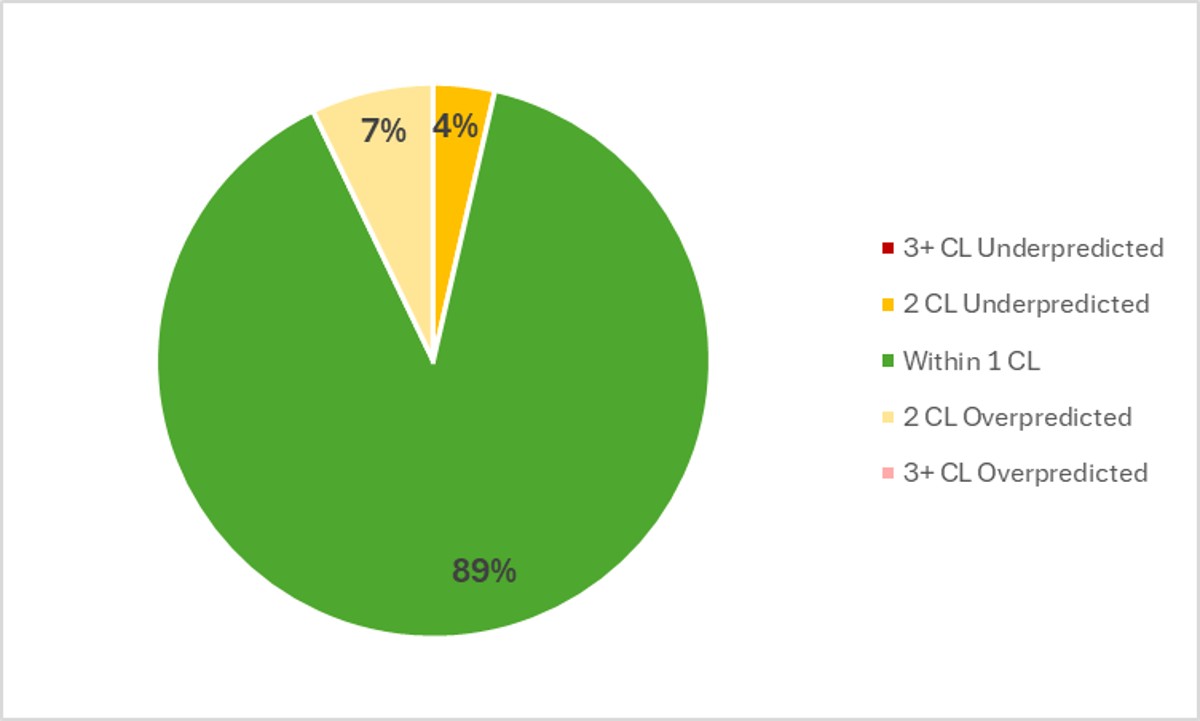
In the past week, Touring Plans predictions were either spot-on or within 1 crowd level 89% of the time, which is one of the best results we’ve seen in ages! And then 100% of the time Touring Plans predictions were within 2 crowd levels, so that’s a perfect score for the predictions over the past week! This is just about a perfect result, and something that we haven’t seen in a really long time. I’m not even going to call out the biggest miss of the week, because it wasn’t anything over 2 crowd levels.
Attraction Downtime April 21 – 27
If we average all of the capacity lost due to unexpected downtime over the past week, it comes out to 5% of attractions unexpectedly being down. That’s quite a bit higher than the past several weeks, which is what tends to happen when crowds go down and Disney isn’t feeling the intense pressure to keep everything online. In the past week, Animal Kingdom was once again the park with the most overall downtime, averaging 8.3% of its capacity lost to downtime. This definitely contributes to the higher wait times at the already-low-capacity park.
The worst day for attraction downtime in the past week was on April 26th. On that day, 7% of all capacity at WDW was lost due to unexpected downtime. But the worst park-day of the was actually at Animal Kingdom on April 27th, when a whopping 22% of that park’s capacity was lost due to unexpected downtime. Animal Kingdom was open for 11 hours on the 27th, so 22% downtime is the equivalent of the entire park shutting down for 145 minutes. Almost 2.5 hours out of the 11 hours the park was open. Big. Yikes.
Attraction Downtime Worst Offender
In the past week, after a one-week break from “winning” this category, Kali River Rapids is back as the WDW attraction with the worst overall downtime. It was unexpectedly down for 23% of the past week. Most significantly, it went down around 1:30 pm on the 26th, came back up for about an hour that afternoon, then went back down and stayed down for all of the 27th. And as I’m writing this on the morning of the 28th, it’s still not back open.

Rope Drop Downtime
Here are problematic offenders from the past week, with the percentage of downtime during the first hour of the day in parentheses:
- Magic Kingdom: Mickey’s PhilharMagic (30%), Journey Into Imagination (16%), The Many Adventures of Winnie the Pooh (13%), Space Mountain (13%), Tiana’s Bayou Adventure (10%)
- EPCOT: Test Track (22%), The Seas with Nemo (20%), Frozen Ever After (19%), Living with the Land (15%)
- Hollywood Studios: Runaway Railway (10%)
- Animal Kingdom: No rope drop downtime issues this week!
Okay … let’s give credit where credit is due. Hollywood Studios and Animal Kingdom both had certifiably awesome rope drop weeks. EPCOT is lagging a little behind, with Test Track and Frozen still showing up on the naughty list.
But the biggest deal here is Magic Kingdom. Our rope drop downtime list for MK has averaged just about double this length for the past month or so. So while we still have some significant headliner issues (looking at you, Space and Tiana), this is actually a pretty remarkable improvement over recent results.
Wait Times April 21 – 27
Attractions with the Highest Average Posted Wait at Each Park
- EPCOT: Cosmic Rewind, average posted wait of 82 minutes (was 72 minutes last week)
- Magic Kingdom: TRON, average posted wait time of 73 minutes (was 59 minutes last week)
- Hollywood Studios: Slinky Dog Dash, average posted wait of 65 minutes (was 59 minutes last week)
- Animal Kingdom: Flight of Passage, average posted wait time of 60 minutes (was 53 minutes last week)
Wait times at most headliners have rebounded a little compared to their post-Easter lows, but this is still a pretty great week for wait times. Cosmic Rewind was a little artificially high thanks to lots of Test Track downtime, and Tron was similarly impacted thanks to downtime at Space Mountain. But otherwise, there were still only 5 attractions in all of Walt Disney World with average posted waits of over an hour (the four above, plus Test Track).
Parks with the Highest and Lowest Average Wait
- Highest: Animal Kingdom, average park-wide posted wait of 35 minutes (was 32 minutes last week)
- Lowest: Magic Kingdom, average park-wide posted wait of 22 minutes (was 20 minutes last week)
For the second week in a row, Animal Kingdom has higher average waits than Hollywood Studios. This happened for most of last summer, and I expect that we’ll see this behavior stick around for a while, unless the opening of Bluey/Bingo and Rock’n’Roller Coaster and The Walt Disney Studios all combine to create some shifting crowd patterns.
Most Inflated Posted Wait Times
We all know that Disney inflates their posted wait times on purpose. They have many reasons for doing this. Some are totally understandable, and some are potentially more problematic. We can figure out how much posted wait times are being inflated by comparing submitted actual wait times from the Lines App and the posted wait time when the person timing their wait entered the line.
Over the past week, actual wait times in the Lines App averaged 72% of what was posted. That’s exactly our historical average in the era of Lightning Lanes. Overall, if the posted wait time at a popular attraction was 60 minutes, you could’ve expected to wait just about 43 minutes instead.
But the worst inflation offender for the past week was Zootopia: Better Zoogether. At this one attraction, submitted actual wait times were only 43% of posted wait times in the past week. That means that if Zootopia had a 30 minute posted wait, you probably would have actually only waited less than 13 minutes instead. Less than half of what was posted! Remember to always check the Lines app for predicted actual waits instead of making decisions based on what is posted.
This Week’s Wait Time Rock Star
Between April 21st and 27th, we had just under 1000 timed actual waits submitted through the Lines app. The one person who recorded the most actual waits during that time was Trac26, with 25 overall timed waits – 1 Lightning Lane wait and 24 standby waits. Thanks for all of that timing, Trac26! It unfortunately does not compete with the the 97 timed waits in a single week from our current timing champion, preef.
Looking Ahead: April 28 – May 11
I write this article on Tuesday evenings so that you all have the very freshest of data on Wednesdays. That means the 28th will already be in the past by the time you’ve read this, so congrats on making it to the future! And this also means we’ve got a break from the Disney Data Dump next week, since your humble author will be in Walt Disney World and won’t be taking time away from research in the parks to type this up for you all.
The crowd part of this look ahead is very easy – more of the same, again! There are no major events that should inspire large numbers of humans to descend upon Orlando. In fact, most families with school-age kids are even more likely to stay in school in early May as testing happens and the school year works on wrapping up. A few adults-only parties prioritize early May for visits so that they avoid most of the summer heat. And some college-age groups will head on vacation as soon as their semester wraps up, but that’s usually closer to mid-May. So we should stay in this lovely crowd level 2-4 range unless a bunch of downtime messes things up.
The weather is a bit more unpredictable as we look two weeks ahead. High temperatures are already hitting the 90s on some days, and the current forecast calls for mostly sun. The one exception right now is May 3rd, which looks to be a washout. I’ll be in Orlando on the 3rd, trying to catch Big Thunder Mountain on opening day … so I really need the weather to fix itself and be sunny that day instead.
Were you in the parks this past week? Or are you headed to Orlando soon? Let me know in the comments below!
You May Also Like...
-

If you’ve been waiting for a quiet spring window at Walt Disney World that waits until after the wild winter crowds,…
-

What we saw this past week is a really good reminder that Spring Break season isn’t one clean spike. It’s a…
We’re going to WDW in early June! Graduation trip for DD#1! Well, we were going anyways, but adding a nice label to our typical trip-LOL! Hoping to see some data with the reopening of BTMRR and BLSRS! Enjoy all!
I’ll be in the parks May 3-6! Especially thrilled about the TMRR reopening and using my Magic Kingdom AH ticket. I’ll try to remember to time some lines during that event.
I’ll be in WDW May 4-7 and have been checking the weather predictions. They seem to change daily! Fingers crossed for no rain!
Rope Drop Downtime – Journey Into Imagination is at EP, not MK. Oops!