Disney Data Dump August 2 2023
Welcome to August, folks! It’s apparently already Halloween season – meanwhile, my family and I are leaving on our summer vacation today. It must be fallmmer … or autummer? One of those will catch on for sure. But the Disney story of the week isn’t about the season. It’s about attraction downtime and how that impacts crowd levels. And maybe mix in a little Food & Wine there too.
Observed Crowd Levels July 25 – 31

It’s looking like a lovely end of the summer at Walt Disney World (especially if you ignore the weather …). Usually the beginning of the Food & Wine Festival provides at least a temporary bump in crowds. And that potentially still happened, but overall we’re still seeing what has now become our normal summer cadence – peak crowds on Monday/Tuesday decreasing throughout the week and then almost disappearing during the weekend. Enjoy one more week of this behavior before Halloween parties start shaking things up.

Here’s where we can see that Food and Wine bump. EPCOT was dead on the 25th and 26th, before the bloggers all descended on the 27th to kick things off, and then crowds stayed a little higher through the weekend – higher than they’ve been staying for the rest of summer. That might have just been locals coming out for the first weekend of the festival. I’ll keep an eye on whether it keeps happening.
Animal Kingdom stayed steady all week, like we’ve come to expect. And Magic Kingdom had the big rollercoaster like we’ve been seeing regularly. If you’re not going to Magic Kingdom on Sundays this summer, you’re doing it wrong. Summer Sundays are almost the equivalent of party days during party season.
Hollywood Studios is the outlier this week, with lots of steadily high crowd levels. A lot of this is due to downtime, which we’ll get into more later in this post.
A quick note that Disney very obviously sees the higher demand at Magic Kingdom and Hollywood Studios, as they just announced a new ticket deal for Florida residents that only covers Animal Kingdom and EPCOT. Given the popularity of Food and Wine with locals, this may be a bid to boost attendance at Animal Kingdom more than anything else.
Performance of Crowd Level Predictions
Each week, I’m giving you a very transparent look into how our crowd level predictions performed. Each day at each park is one data point, so this week we have 28 different crowd level predictions to evaluate each week. Any time a prediction is within one or two crowd levels, things won’t really “feel” much different than what we predicted. Being off by 3 or more crowd levels is where we’d like to be more accurate because you might feel that difference in wait times throughout the day.

In the past week, Touring Plans predictions were either spot-on or within 1 crowd level 82% of the time. This is remarkably great performance and near historic highs. 89% of the time Touring Plans predictions were within 2 crowd levels, and that means we earn a B+ for our predictions this past week! This is great performance. The biggest misses of the week all overestimated crowds by three crowd levels, and happened at EPCOT on the two pre-F&W days and at Magic Kingdom on that Summer Sunday.
Attraction Downtime July 25 – 31
If we average all of the capacity lost due to unexpected downtime over the past week, it comes out to 5.6% of attractions unexpectedly being down. Even worse than last week, and significantly worse than our historical average. And that average doesn’t tell the whole story. From the 25th through the 28th, downtime was only 3%. From the 29th through the 31st, that rocketed up to 9% downtime on average. The park with the biggest issues was Hollywood Studios, with 7.3% of its capacity lost due to unexpected downtime. And it was followed closely by Animal Kingdom, with 7% downtime over the past week. Both parks had higher-than-average crowds compared to the rest of summer, and this downtime helps point to why.
The worst day for attraction downtime in the past week was on July 30th. On that day, 10.5% of all capacity at WDW was lost due to unexpected downtime. The worst park-day of the week was at Animal Kingdom on July 31st. On that park day, a totally bonkers 21% of the capacity at the park was lost due to unexpected downtime. Animal Kingdom was open for 11 hours on the 31st, so 21% downtime is the equivalent of the whole park being down for almost 139 minutes. It’s almost the same as Disney deciding on a whim to shut the park down before 5 pm instead of letting it stay open until 7 pm. That’s a huge operational impact.
Attraction Downtime Worst Offenders
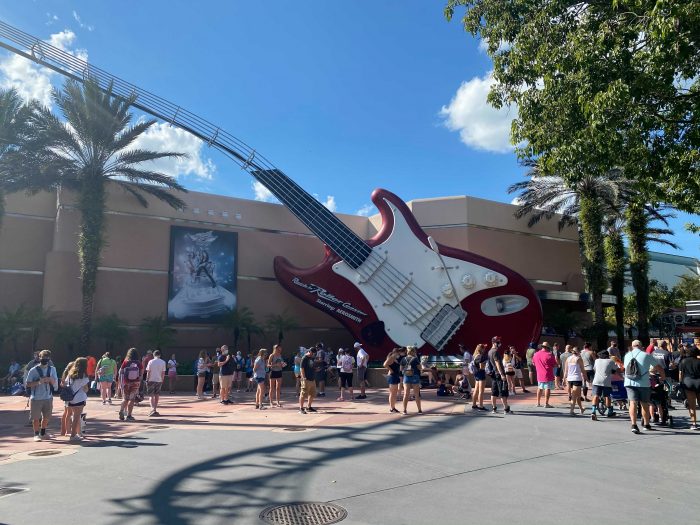
The worst offender of the past week was Rock’n’Roller Coaster, which was unexpectedly down for approximately 38% of the past week. More than a third of the whole week! The worst day for Aerosmith fans was on July 30th, when it was unexpectedly down for 97% of the day. But really the ride went down hard at 11 am on the 29th, basically stayed down all day on the 30th, and didn’t come back online until after 1 pm on the 31st.
A lot of people are pointing to weather as the reason for increased downtime this summer. And that certainly contributes. But this week’s “winner” shows that weather isn’t the only driving factor. (Limo pun, get it?) This is an attraction that just went through a lengthy refurbishment and is still having significant operational issues. Three out of the top four attractions with downtime this week (RNRC, plus Pirates of the Caribbean and Living with the Land) are indoor attractions where we can’t blame downtime on weather.
Rope Drop Downtime
Here are this week’s problematic offenders:
- Magic Kingdom: Pirates of the Caribbean (unavailable for 34% of its first hour of the day), The Barnstormer (unavailable for 21% of its first hour of the day)
- EPCOT: The Seas with Nemo and Friends (unavailable for 27% of its first hour of the day)
- Hollywood Studios: Rock’n’Roller Coaster (unavailable for 62% of its first hour of the day)
- Animal Kingdom: Expedition Everest (unavailable for 21% of its first hour of the day), Kali River Rapids (unavailable for 16% of its first hour of the day)
When rides were down for rope drop this week, they were really really down frequently. Take that 62% number for Rock’n’Roller Coaster, or 34% for Pirates. Thankfully, not too many headliners were impacted by downtime during rope drop this week, so the big backups of wait times that we saw last week weren’t as much of an issue.

Wait Times July 25 – 31
Attractions with the Highest Average Posted Wait at each park
- Animal Kingdom: Flight of Passage, average posted wait time of 100 minutes (102 minutes last week)
- Hollywood Studios: Slinky Dog Dash, average posted wait of 98 minutes (88 minutes last week)
- Magic Kingdom: Seven Dwarfs Mine Train, average posted wait time of 83 minutes (88 minutes last week)
- EPCOT: Frozen Ever After, average posted wait time of 66 minutes (62 minutes last week at Test Track)
These results match our overall park crowd levels column chart from above. Animal Kingdom stayed pretty steady. Hollywood Studios and EPCOT were both up compared to the past few weeks, and Magic Kingdom was nice and chill.
Parks with the Highest and Lowest Average Wait
These parks likely won’t change week-to-week unless something ridiculous happens, but these data points will give us a high-level view of how wait times are trending from week to week.
- Highest: Hollywood Studios, average park-wide posted wait of 45 minutes (43 minutes last week)
- Lowest: EPCOT, average park-wide posted wait of 26 minutes (24.5 minutes last week)
I love when our data is consistent! Wait times are up at EPCOT (thanks Food & Wine) and Hollywood Studios (thanks downtime). These still aren’t even what I would consider normal for summer in Disney. But they’re a little higher than we’ve seen recently.
Most Inflated Posted Wait Times
We all know that Disney inflates their posted wait times on purpose. They have many reasons for doing this. Some are totally understandable, and some are potentially more problematic. We can figure out how much posted wait times are being inflated by comparing submitted actual wait times from the Lines App and the posted wait time when the person timing their wait entered the line.
Over the past week, actual wait times in the Lines App averaged 65% of what was posted. This is very in line with our historical average. If the posted wait time was 60 minutes, you could’ve expected to wait just 39 minutes instead.
But the worst offender for the past week is the TTA PeopleMover. At this one attraction, submitted actual wait times were 49% of posted wait times in the past week. That means that if the PeopleMover had a 20 minute posted wait, you probably would’ve waited under 10 minutes instead. Less than half of what was posted. Remember to always check the Lines app for predicted actual waits instead of believing what is posted.

Actual Wait Time Rock Star
The Actual Wait Time Rock Star for the past week was … tandry, who submitted 39 actual wait times through the Lines App over the last 7 days! This includes 22 Lightning Lane waits, 15 Standby waits, and 2 virtual queue waits. Thank you for all of that timing, tandry! You didn’t quite make it to the all-time record of 78 recorded wait times in a single week, currently held by psymonds.
Looking Ahead: August 1 – 7
Food & Wine has already started up. Thunderstorms continue to roll through regularly. Party season isn’t quite here yet. So what should you except in the upcoming week?
I would expect to see something similar to last week:
- Lots of downtime all around every park. Make sure you have plans and backup plans!
- High early-week crowds at Magic Kingdom that decrease down to a lovely Summer Sunday
- Steady-ish crowds at Animal Kingdom, and maybe EPCOT now that the festival is old news 😉
- High-ish crowds at Hollywood Studios, if the attractions don’t play nicely. Medium crowds if they do.
Then we’ll be into party season, and we all know what that means. Right? Riiiiiiiiiight?! Our weekly roller coaster at Magic Kingdom will go into crazy mode, with really low crowds on party days, and higher crowds on non-party days. Always visit on a party day!
You May Also Like...
-

Anyone else feel like you can finally breathe a sigh of relief now that the school year is over with all…
-

In the world of Disney Data, this week was all good news. Wait times were the lowest we've seen since mid-September…
-

Just when you think we've made it through Spring Break season! The weather is getting warmer. The kids are getting antsy…
-

Anyone else ready for summer? If nothing else, we need something to shake up these Disney Data Dumps that have become…