
Disney Data Dump August 23 2023
If you’re a fellow Midwesterner, I would like to apologize on behalf of the weather that has finally decided to be summer-like right at the beginning of the “Disney fall” season. On the other hand, perhaps these triple-digit temps and 100% humidity are just telling us to run away to Florida, which is slightly less of a sauna every time you step outside. As the school year ramps up across the country and party season gets into its rhythm in Orlando, how is that impacting Walt Disney World crowds? Let’s find out!
Observed Crowd Levels August 15 – 21

On the whole, this is looking pretty nice, and somewhat comparable to last week. Nothing above a 5 is great for what is still considered to be summer season. Fingers crossed that this keeps trending down in the next couple of weeks!

Our lovely, predictable roller coaster of the summer is gone now! Each day of the week looks roughly the same, with a few exceptions. First, Magic Kingdom party days are really easy to pick out. We even got an exceedingly rare crowd level one on the 15th! And then Hollywood Studios had a bizarre peak on the 18th. Was it all of the people avoiding Magic Kingdom? Based on the results from the 15th and 20th … maybe, but probably not. Hollywood Studios lost 14% of its capacity to unexpected attraction downtime on the 18th, which definitely has an impact on wait times. Especially since the offending attractions were Slinky Dog Dash, Rise of the Resistance, Runaway Railway, and Tower of Terror. Boo.
Performance of Crowd Level Predictions
Each week, I’m giving you a very transparent look into how our crowd level predictions performed. Each day at each park is one data point, so this week we have 28 different crowd level predictions to evaluate each week. Any time a prediction is within one or two crowd levels, things won’t really “feel” much different than what we predicted. Being off by 3 or more crowd levels is where we’d like to be more accurate because you might feel that difference in wait times throughout the day.

In the past two weeks, Touring Plans predictions were either spot-on or within 1 crowd level 79% of the time. Not as good as the past few weeks, but still much better than most of the late spring and early summer. 92% of the time Touring Plans predictions were within 2 crowd levels, and that means we earn an A- for our predictions this past week. The biggest miss of the past two weeks underestimated crowds by three crowd levels, and that happened at Hollywood Studios on August 18th (aka, downtime day), when Touring Plans predicted a crowd level 5, which ended up only being a crowd level 8.
Attraction Downtime August 15 – 21
If we average all of the capacity lost due to unexpected downtime over the past two weeks, it comes out to 4.9% of attractions unexpectedly being down. Still worse than the historical average, but somewhat better than what we’ve been seeing for most of the summer. The park with the biggest issues was Hollywood Studios, with 6% of its capacity lost due to unexpected downtime.
The worst day for attraction downtime in the past week was on August 18th. On that day, 12% of all capacity at WDW was lost due to unexpected downtime. The worst park-day of the week was at both Hollywood Studios and Magic Kingdom on August 18th. On that park day, a terrible 14% of the capacity at both parks was lost due to unexpected downtime. Magic Kingdom was only open for 10 hours on the 18th since it was a party day, so 14% downtime is the equivalent of the whole park being down for almost 84 minutes. That’s brutal on an already-short park day. Hollywood Studios was open for 12.5 hours on the 18th, so 14% downtime is the equivalent of the whole park being down for almost 105 minutes. Combine the two, and that’s a bad day at Disney.
Attraction Downtime Worst Offenders
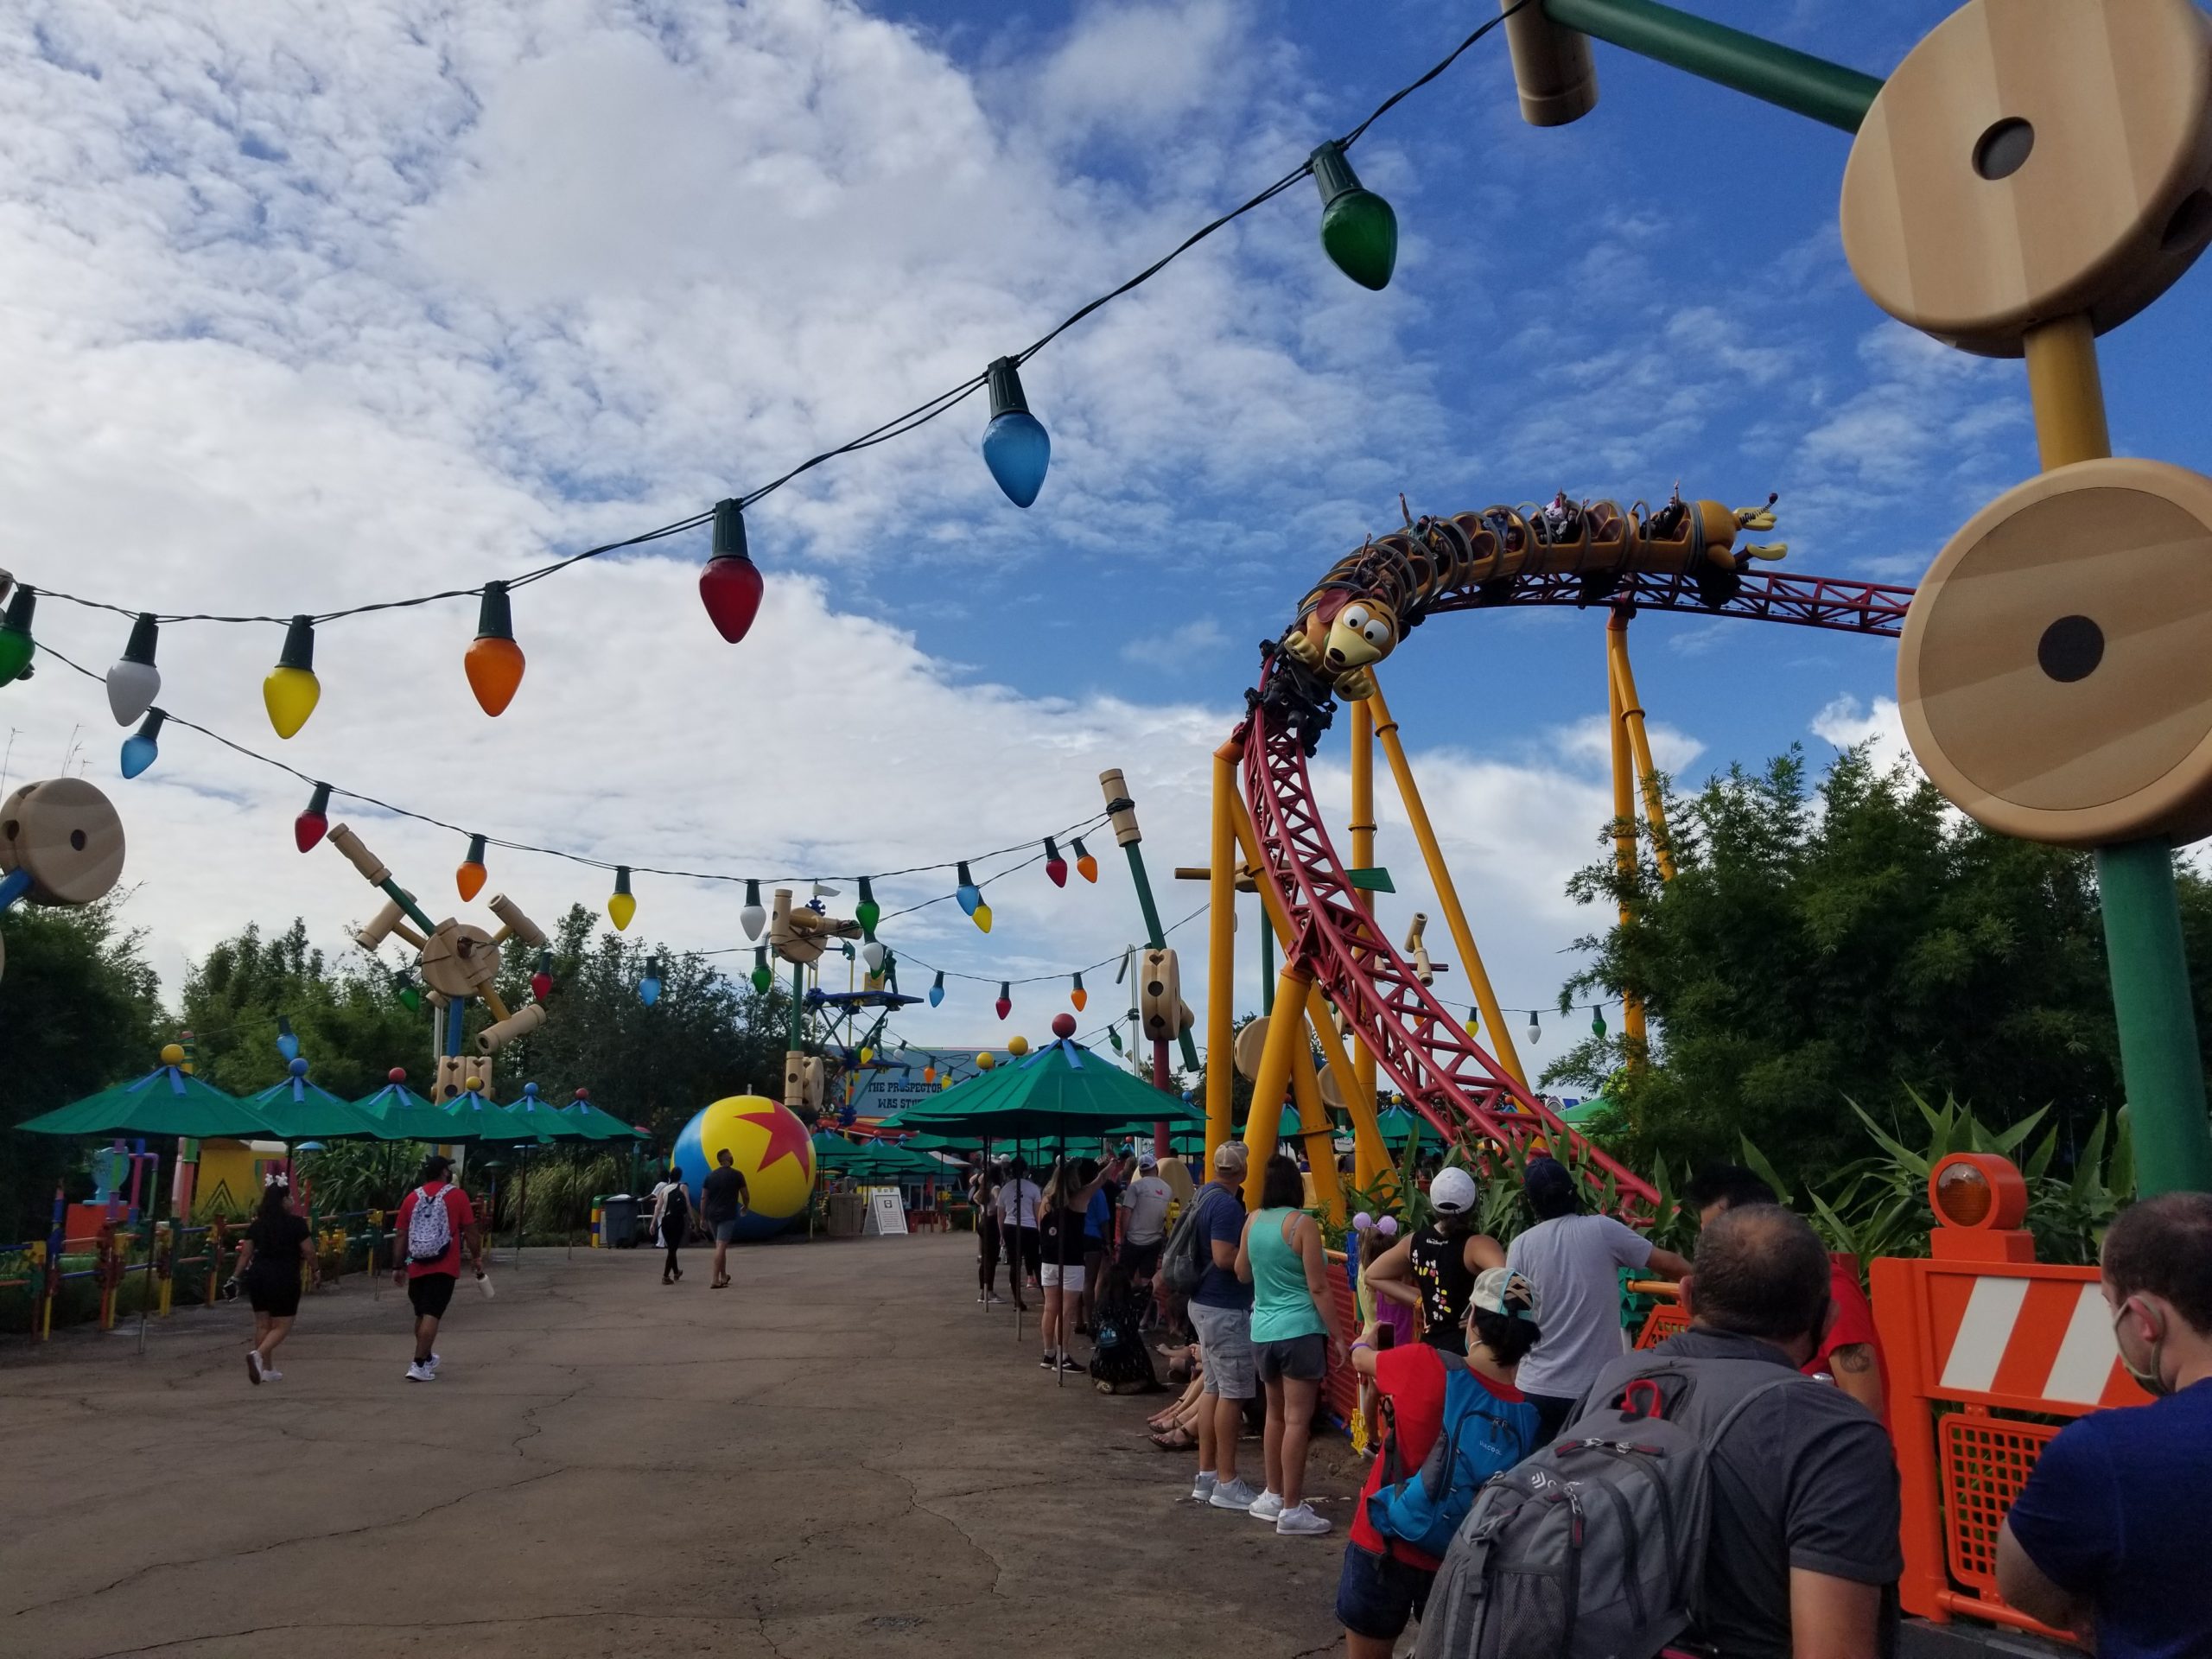
The worst offender of the past week was Slinky Dog Dash, which was unexpectedly down for approximately 22% of the past week. Almost a quarter of the whole week! And at a headliner that people sometimes plan their whole day around. The worst day for Slinky was on August 18th, when it was unexpectedly down for 62% of the day. Not a good day for Slinky fans.
Rope Drop Downtime
Here are this week’s problematic offenders:
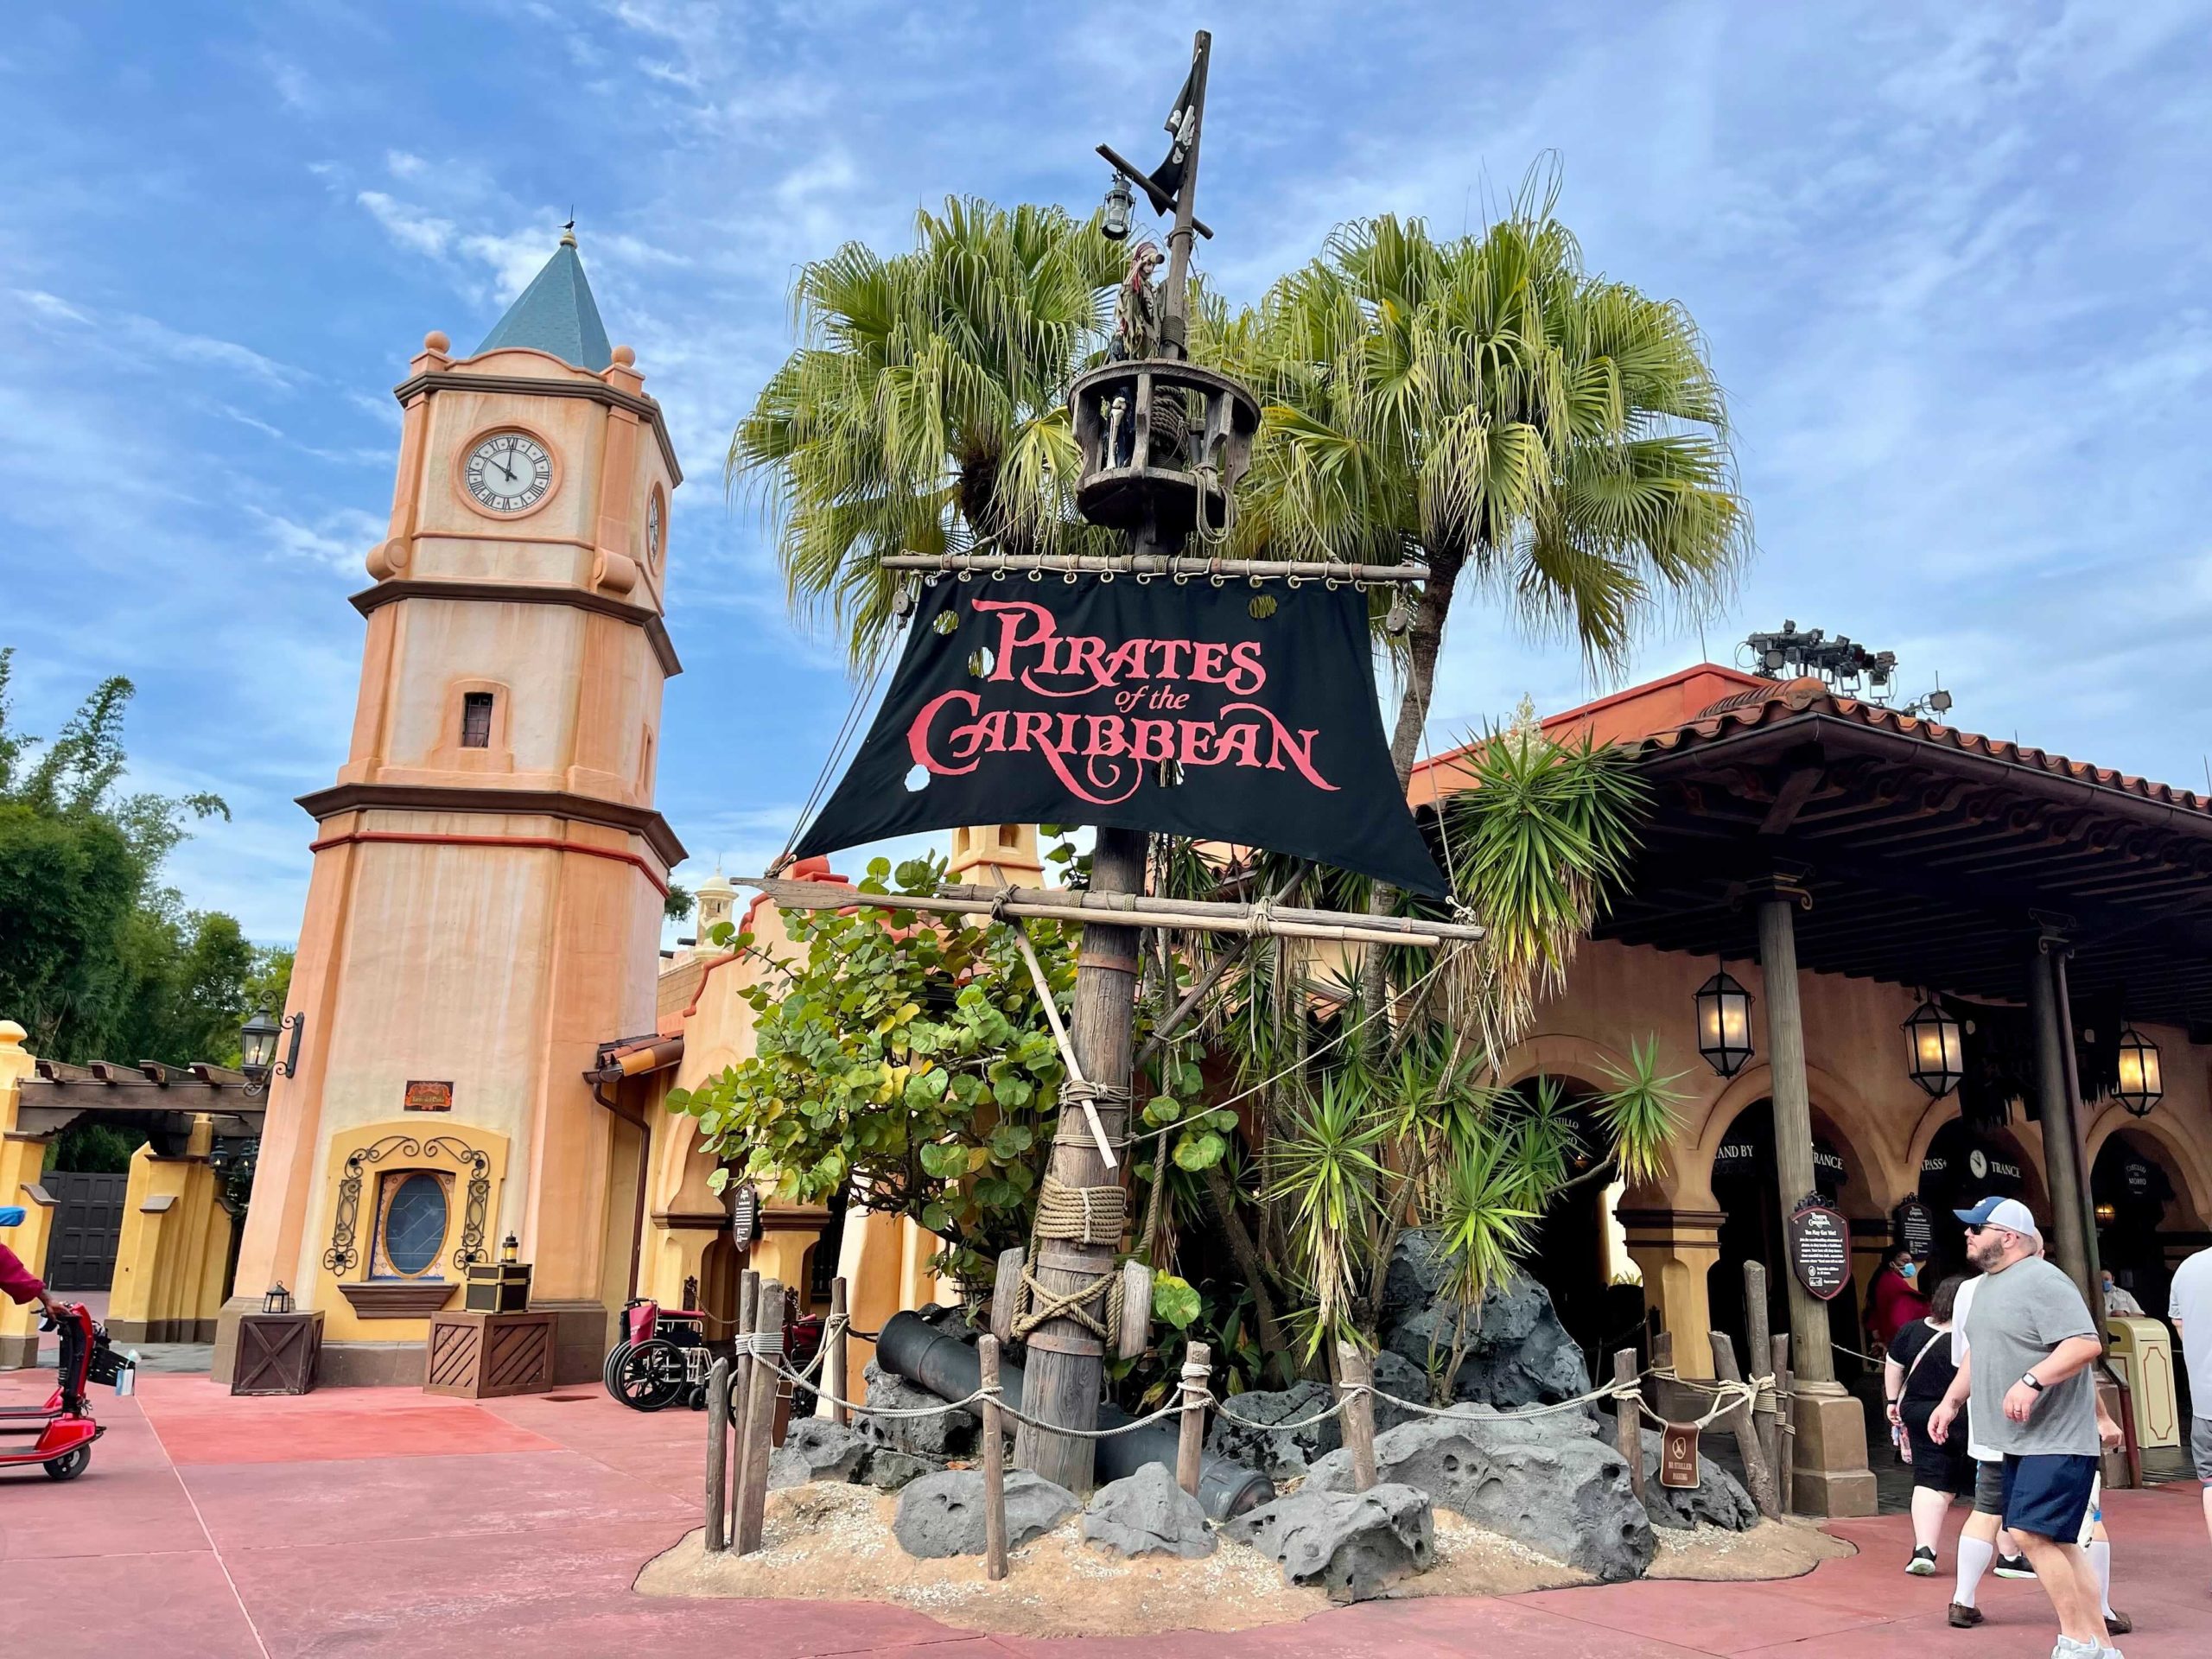
- Magic Kingdom: Pirates of the Caribbean (unavailable for 43% of its first hour of the day), Big Thunder Mountain Railroad (unavailable for 15% of its first hour of the day), TTA PeopleMover (unavailable for 15% of its first hour of the day)
- EPCOT: Test Track (unavailable for 28% of its first hour of the day), Journey Into Imagination (unavailable for 22% of its first hour of the day), The Seas with Nemo & Friends (unavailable for 14% of its first hour of the day)
- Hollywood Studios: Slinky Dog Dash (unavailable for 18% of its first hour of the day), Runaway Railway (unavailable for 17% of its first hour of the day)
- Animal Kingdom: Na’vi River Journey (unavailable for 13% of its first hour of the day)
This week is not a good look for Magic Kingdom or Hollywood Studios. If you don’t have early entry at Magic Kingdom, your general best bet is to head to Adventureland or Frontierland at park opening. But with Pirates and Big Thunder having significant issues first thing in the morning, that wouldn’t have worked very well. And Slinky is a prime rope drop candidate at Hollywood Studios, so that is a bummer too.
Wait Times August 15 – 21
Attractions with the Highest Average Posted Wait at each park
- Hollywood Studios: Slinky Dog Dash, average posted wait of 84 minutes (98 minutes last week)
- Animal Kingdom: Flight of Passage, average posted wait time of 83 minutes (82 minutes last week))
- Magic Kingdom: Seven Dwarfs Mine Train, average posted wait time of 65 minutes (78 minutes last week)
- EPCOT: Frozen Ever After, average posted wait time of 65 minutes (68 minutes last week at Test Track)
Pretty clean results this week! Other than Flight of Passage, every highest-wait attraction saw a drop in average posted wait time compared to last week. And Slinky had a pretty bad downtime week, so it could have dropped even further if it weren’t for the pent-up demand when it was in action.
Parks with the Highest and Lowest Average Wait
These parks likely won’t change week-to-week unless something ridiculous happens, but these data points will give us a high-level view of how wait times are trending from week to week.
- Highest: Hollywood Studios, average park-wide posted wait of 38 minutes (40 minutes last week)
- Lowest: Magic Kingdom, average park-wide posted wait of 24 minutes (25 minutes at EPCOT last week)
Oh heyyyyyyyyyy party people. Those party days and their relatively empty standby queues put Magic Kingdom firmly back in command of the race to lowest wait times. Expect it to stay in this spot through the end of the year.
Most Inflated Posted Wait Times
We all know that Disney inflates their posted wait times on purpose. They have many reasons for doing this. Some are totally understandable, and some are potentially more problematic. We can figure out how much posted wait times are being inflated by comparing submitted actual wait times from the Lines App and the posted wait time when the person timing their wait entered the line.
Over the past week, actual wait times in the Lines App averaged 65%of what was posted. This is very in line with what we’ve been seeing in recent weeks. If the posted wait time was 60 minutes, you could’ve expected to wait just 39 minutes instead.
But the worst offender for the past week is Gran Fiesta Tour. At this one attraction, submitted actual wait times were 42% of posted wait times in the past week. That means that if Gran Fiesta Tour had a 15 minute posted wait, you probably would’ve waited just over 6 minutes instead. Just over a third of what was posted. Remember to always check the Lines app for predicted actual waits instead of believing what is posted.

Actual Wait Time Rock Star
The Actual Wait Time Rock Star for the past week was … passesforsix, who submitted 39 actual wait times through the Lines App over the last 7 days! This includes 8 Lightning Lane waits, 25 Standby waits, 4 single rider waits, and 2 virtual queue waits. Thank you for all of that timing, passesforsix! You didn’t quite make it to the all-time record of 78 recorded wait times in a single week, currently held by psymonds.
Looking Ahead: August 22 – 28
You’ll be reading this one August 23rd, so the 22nd will already be in the past. But it takes me time to pull all of the data, crunch all of the numbers, and write all of the words. So I’m staying as timely as possible!
Including the 22nd, this upcoming week only has two Halloween parties, which should help distribute Magic Kingdom crowds slightly better than this week. We’ve also got two late evenings at EPCOT with After Hours and Extended Evening Hours.
Crowds should be winding down as we head into late August and then September, but we might see one last burst of summer activity from now until Labor Day. Nothing crazy, but still in the crowd level 3-5 range.
Temps are still high, but storms may (may) take a break this week, which should help somewhat with downtime – just for those outdoor attractions.
You May Also Like...
-

We can all breathe a collective sigh of relief! Last week's break from Disney Data Dump wasn't permanent. My family and…
-

Welcome to August, folks! It's apparently already Halloween season - meanwhile, my family and I are leaving on our summer vacation…
-

Anyone else feel like you can finally breathe a sigh of relief now that the school year is over with all…
-

We've made it through another week, Disney data fans! And as we progress through June and march toward July with its…