Disney Data Dump February 1 2023
Happy February! This last week of January may eventually look, in hindsight, like the calm between the storms for several reasons. Last week, Splash Mountain’s last day drew large crowds of onlookers and eBay-savvy water-bottlers, and next week previews of Tron begin. Last week we had a long weekend thanks to MLK day, and then we’ll have another one later in February. This week should have been a relatively calm one for crowds and wait times. But how did things actually play out?
Observed Crowd Levels 1/24 – 1/30

Let’s just get the obvious out of the way – crowds are weird. I’ve gone back and looked at everything to figure out why a random Wednesday and Sunday had such low crowds compared to the surrounding days. It wasn’t rainy. It wasn’t cold. Parks weren’t closing early (in fact, quite the opposite on the 25th). It’s like half of the folks that would normally be in the parks that day decided to have a resort day instead. I need pool crowd levels to compare. Ha!
The good news is, this means that late January crowds on the whole aren’t quite as bad as originally expected. It’s still not a big off-season, but you can apparently get lucky some days with low wait times. This is going to make things interesting going into February, which is already a month that already has reason to be a very swing-y time for crowds. But more on that later!

Each week, I’m giving you a very transparent look into how our crowd level predictions performed. Each day at each park is one data point, so we have 28 different crowd level predictions to evaluate each week. Any time a prediction is within one or two crowd levels, things won’t really “feel” much different than what we predicted. Being off by 3 or more crowd levels is where we’d like to be more accurate because you might feel that difference in wait times throughout the day.
In the past week, Touring Plans predictions were either spot-on or within 1 crowd level 82% of the time. This is is a new all-time record, so hooray for performing well even in the weirdness of the past week. 90% of the time Touring Plans were within 2 crowd levels, and that means we earn an A- for our predictions this past week. The biggest misses of the week were all on January 25th. On that day, crowds at EPCOT were 6 levels lower than expected, and crowds at Animal Kingdom and Magic Kingdom were both 5 levels lower than expected. Compare this to the entire past year, and these differences are huge. In 2022, the biggest overprediction at Magic Kingdom was just 4 crowd levels. These kind of unexpected drops in crowds are very, very rare.
Attraction Downtime 1/24 – 1/30
If we average out all of the capacity lost due to unexpected downtime over the past two weeks, it comes out to 3.0% of attractions unexpectedly being down. This is still mostly trending down from the peaks that we saw in late fall. The park with the biggest issues was Hollywood Studios, with 4.1% of its capacity lost due to unexpected downtime.
The worst day for attraction downtime in the past week was on January 30th. On that day, 5% of all capacity at WDW was lost due to unexpected downtime. The single worst park-day of the week was also on January 30th, at EPCOT. On that day, 8% of the the capacity at that park was lost due to unexpected downtime. EPCOT was open for 14 hours on that day (including Extended Evening Theme Park Hours), so 8% downtime is the equivalent of the whole park being down for 67 minutes – over an hour. Thankfully, it doesn’t seem like this downtime impacted the crowd level at EPCOT, which was expected to be an 6, and ended up right at a 6.
Attraction Downtime
The worst offender was the Frozen Ever After, which was unexpectedly down for approximately 21% of the week. This is a very large number compared to our “winners” of this category in past weeks. Its worst day was easily January 30th, when it was unavailable for 89% the park day. On that day, the ride never came up in the morning, other than it appears to have been operational from approximately 11 to 11:30. It then went back down, until it finally managed to come back online for about the last hour of Extended Evening Theme Park Hours, long after day guests had exited the park.

Rope Drop Downtime
Here are this week’s problematic offenders:
- Magic Kingdom: Pirates of the Caribbean (unavailable for 29% of its first hour of the day), Big Thunder Mountain Railroad (unavailable for 14% of its first hour of the day), Seven Dwarfs Mine Train (unavailable for 14% of its first hour of the day), Under the Sea (unavailable for 14% of its first hour of the day)
- EPCOT: Frozen Ever After (unavailable for 43% of its first hour of the day)
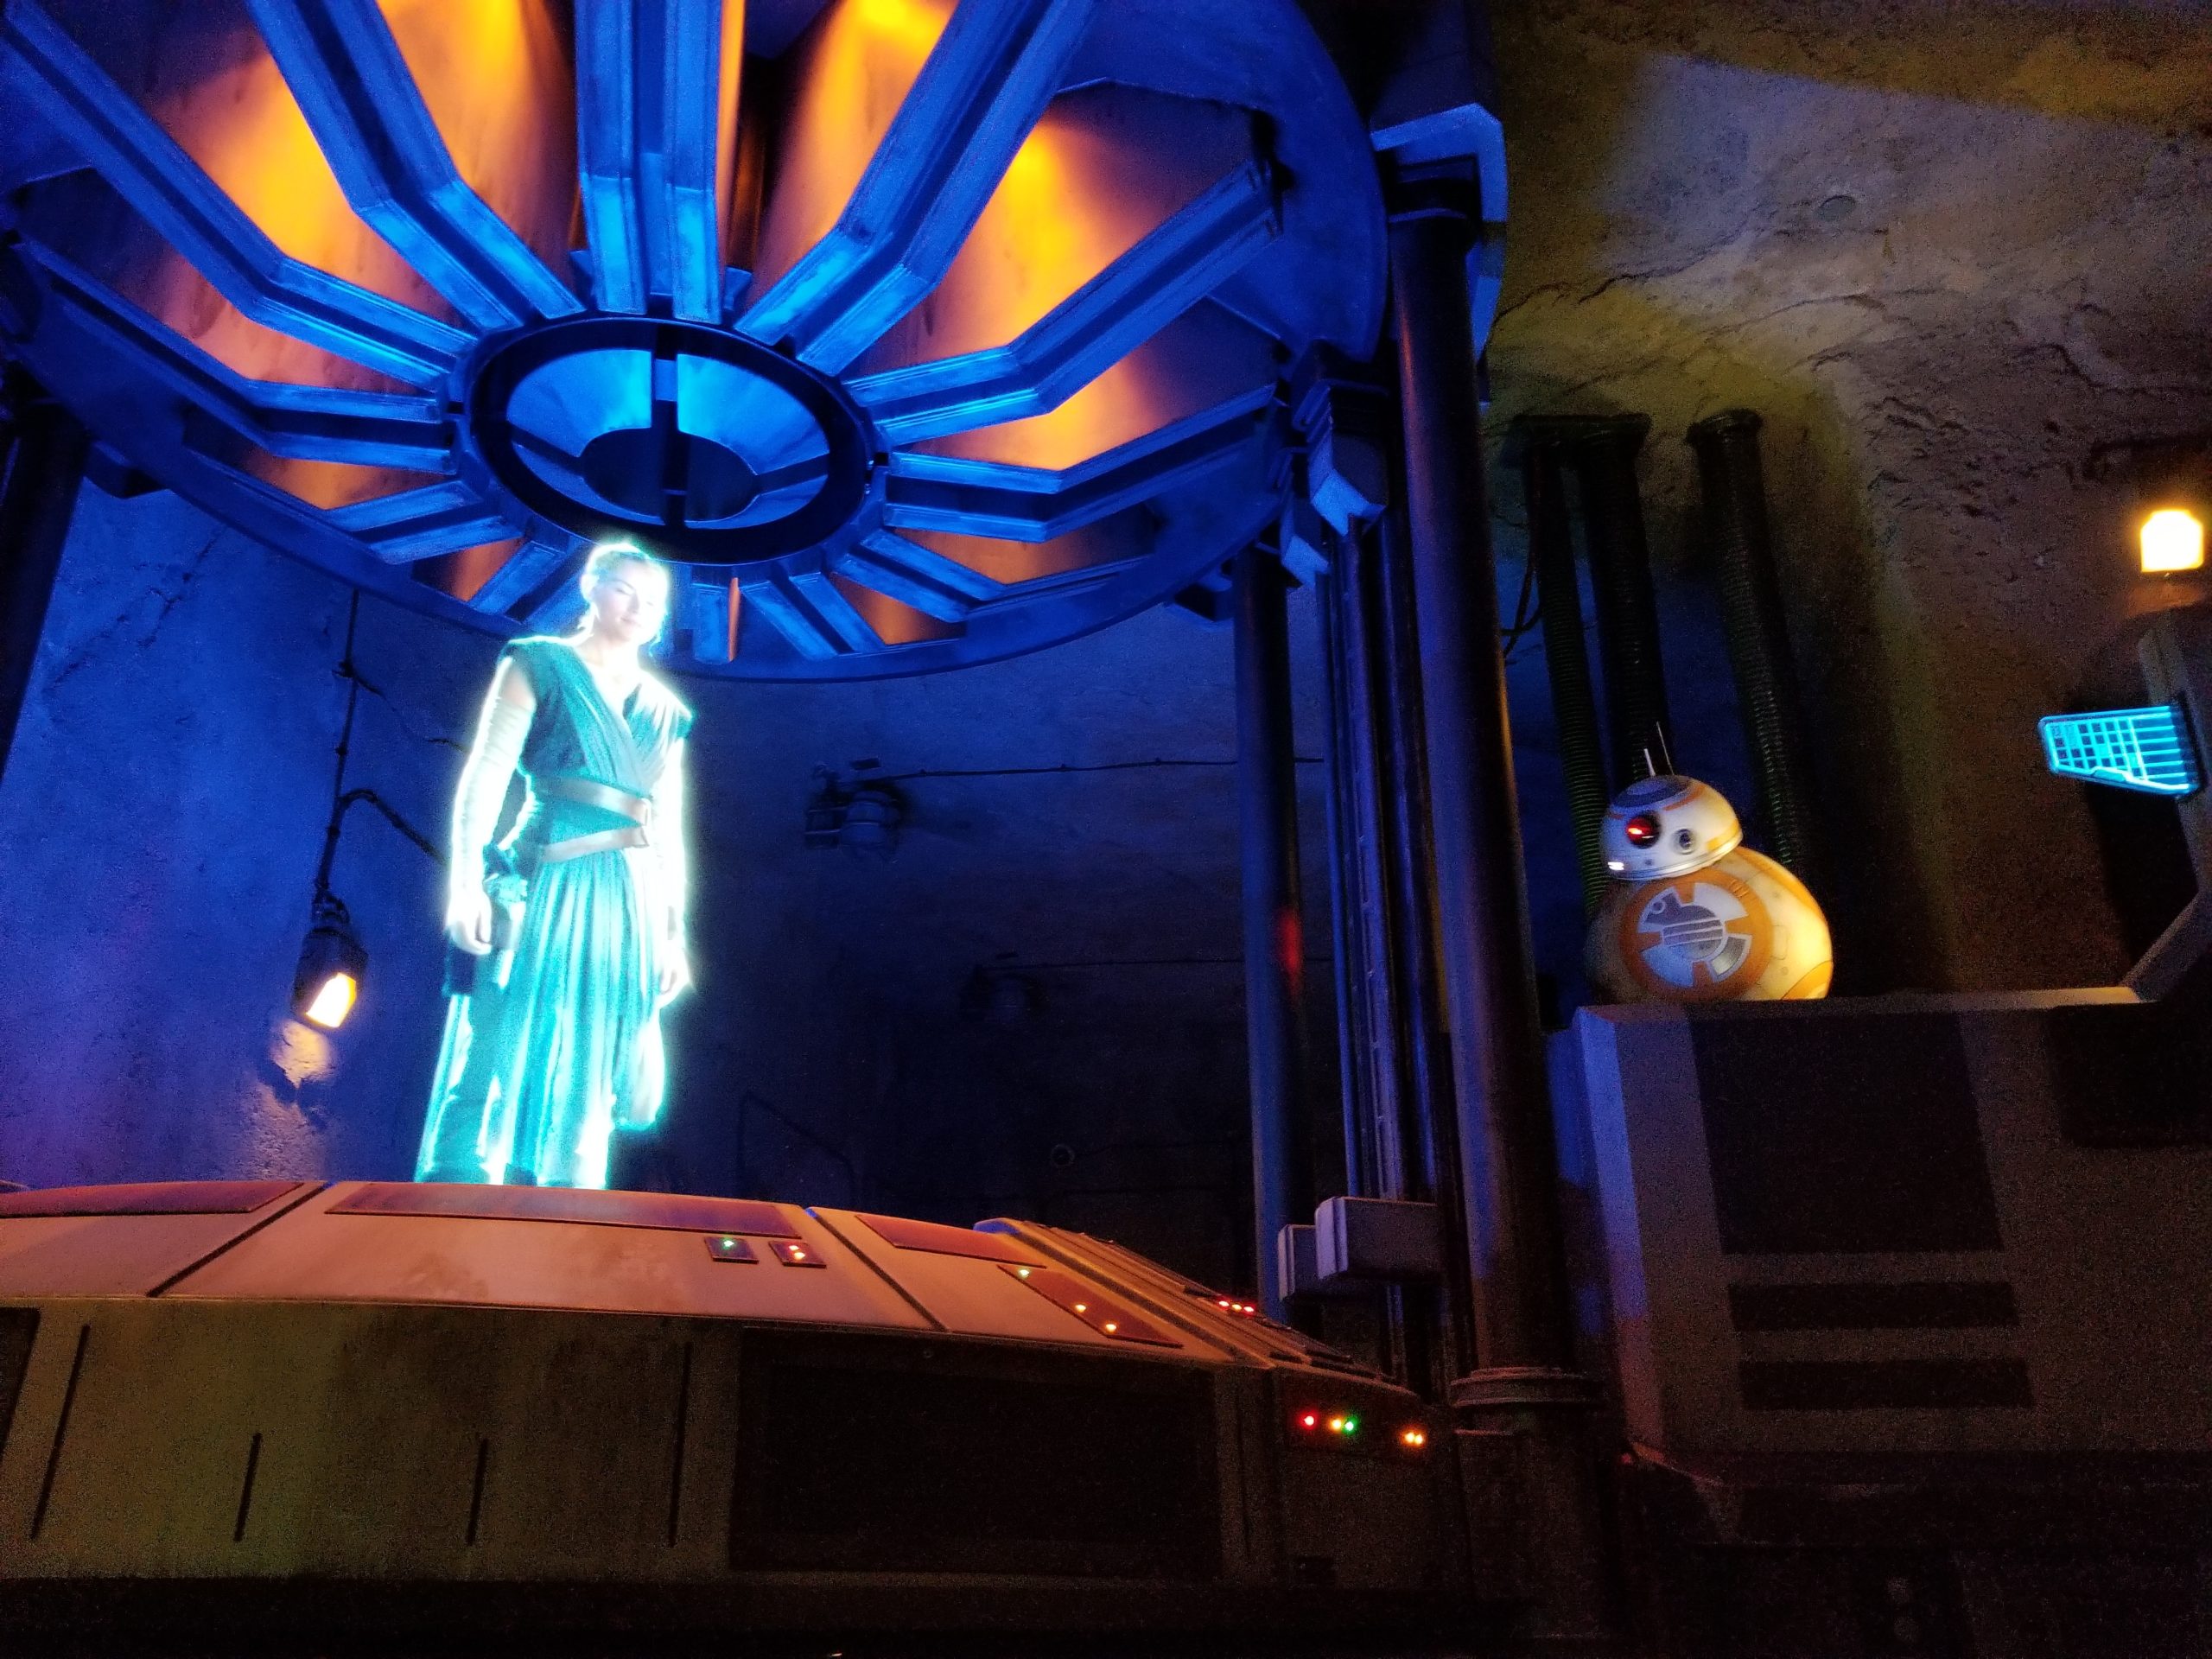
- Hollywood Studios: Rise of the Resistance (unavailable for 29% of its first hour of the day)
- Animal Kingdom: DINOSAUR (unavailable for 14% of its first hour of the day)
Apart from that horrid, horrid number for Frozen Ever After, none of these are particularly surprising. And the good news at EPCOT is that Remy and Test Track were actually reliable in the morning, so starting at either of those while watching for Frozen Ever After to wake up for the day could be a good strategy. Now that Splash Mountain is closed, bad starts for Pirates and Big Thunder Mountain Railroad make the “left side” rope drop plan difficult to recommend. If you don’t have early entry, it’s still undeniably the best option. But check to see if those attractions are online while you enter the park – if they aren’t, default to Tomorrowland instead.
Wait Times 1/24 – 1/30
Attractions with the Highest Average Posted Wait at each park
- Hollywood Studios: Tower of Terror, average posted wait of 94 minutes (102 minutes last week)
- Animal Kingdom: Flight of Passage, average posted wait time of 99 minutes (101 minutes last week)
- EPCOT: Remy’s Ratatouille Adventure, average posted wait time of 74 minutes (72 minutes last week)
- Magic Kingdom: Seven Dwarfs Mine Train, average posted wait time of 75 minutes (76 minutes last week)
A couple of interesting things to note, here. First, Tower of Terror finally gives up its reign as highest wait time on property to Flight of Passage – at least for this week. But Tower of Terror still has the second-highest average posted wait at WDW. We saw very small decreases for Flight of Passage and Seven Dwarfs Mine Train, as well as a slight increase in wait time for Remy. This increase in Remy wait time may not tell us anything about that ride or park, other than Frozen Ever After had a really terrible week, and those families with young kids had to go somewhere else.
Parks with the Highest and Lowest Average Wait
These parks likely won’t change week-to-week unless something ridiculous happens, but these data points will give us a high-level view of how wait times are trending from week to week.
- Highest: Hollywood Studios, average park-wide posted wait of 43 minutes (last week 45 minutes)
- Lowest: EPCOT, average park-wide posted wait of 25 minutes (last week 25 minutes)
For the second week in the row, with the end of party season at the Magic Kingdom, EPCOT has the lowest average wait time of any of the WDW parks. Things are mostly unchanged there, but the overall posted wait probably would have gone down slightly if Frozen Ever After hadn’t had such big issues, driving up wait times at other attractions.
Most Inflated Posted Wait Times
We all know that Disney inflates their posted wait times on purpose. They have many reasons for doing this. Some are totally understandable, and some are potentially more problematic. We can figure out how much posted wait times are being inflated by comparing submitted actual wait times from the Lines App and the posted wait time when the person timing their wait entered the line.
Over the past week, actual wait times in the Lines App averaged 64% of what was posted. This is very in line with our historical average. So if the posted wait time was 20 minutes, you could’ve expected to wait less than 13 minutes instead.
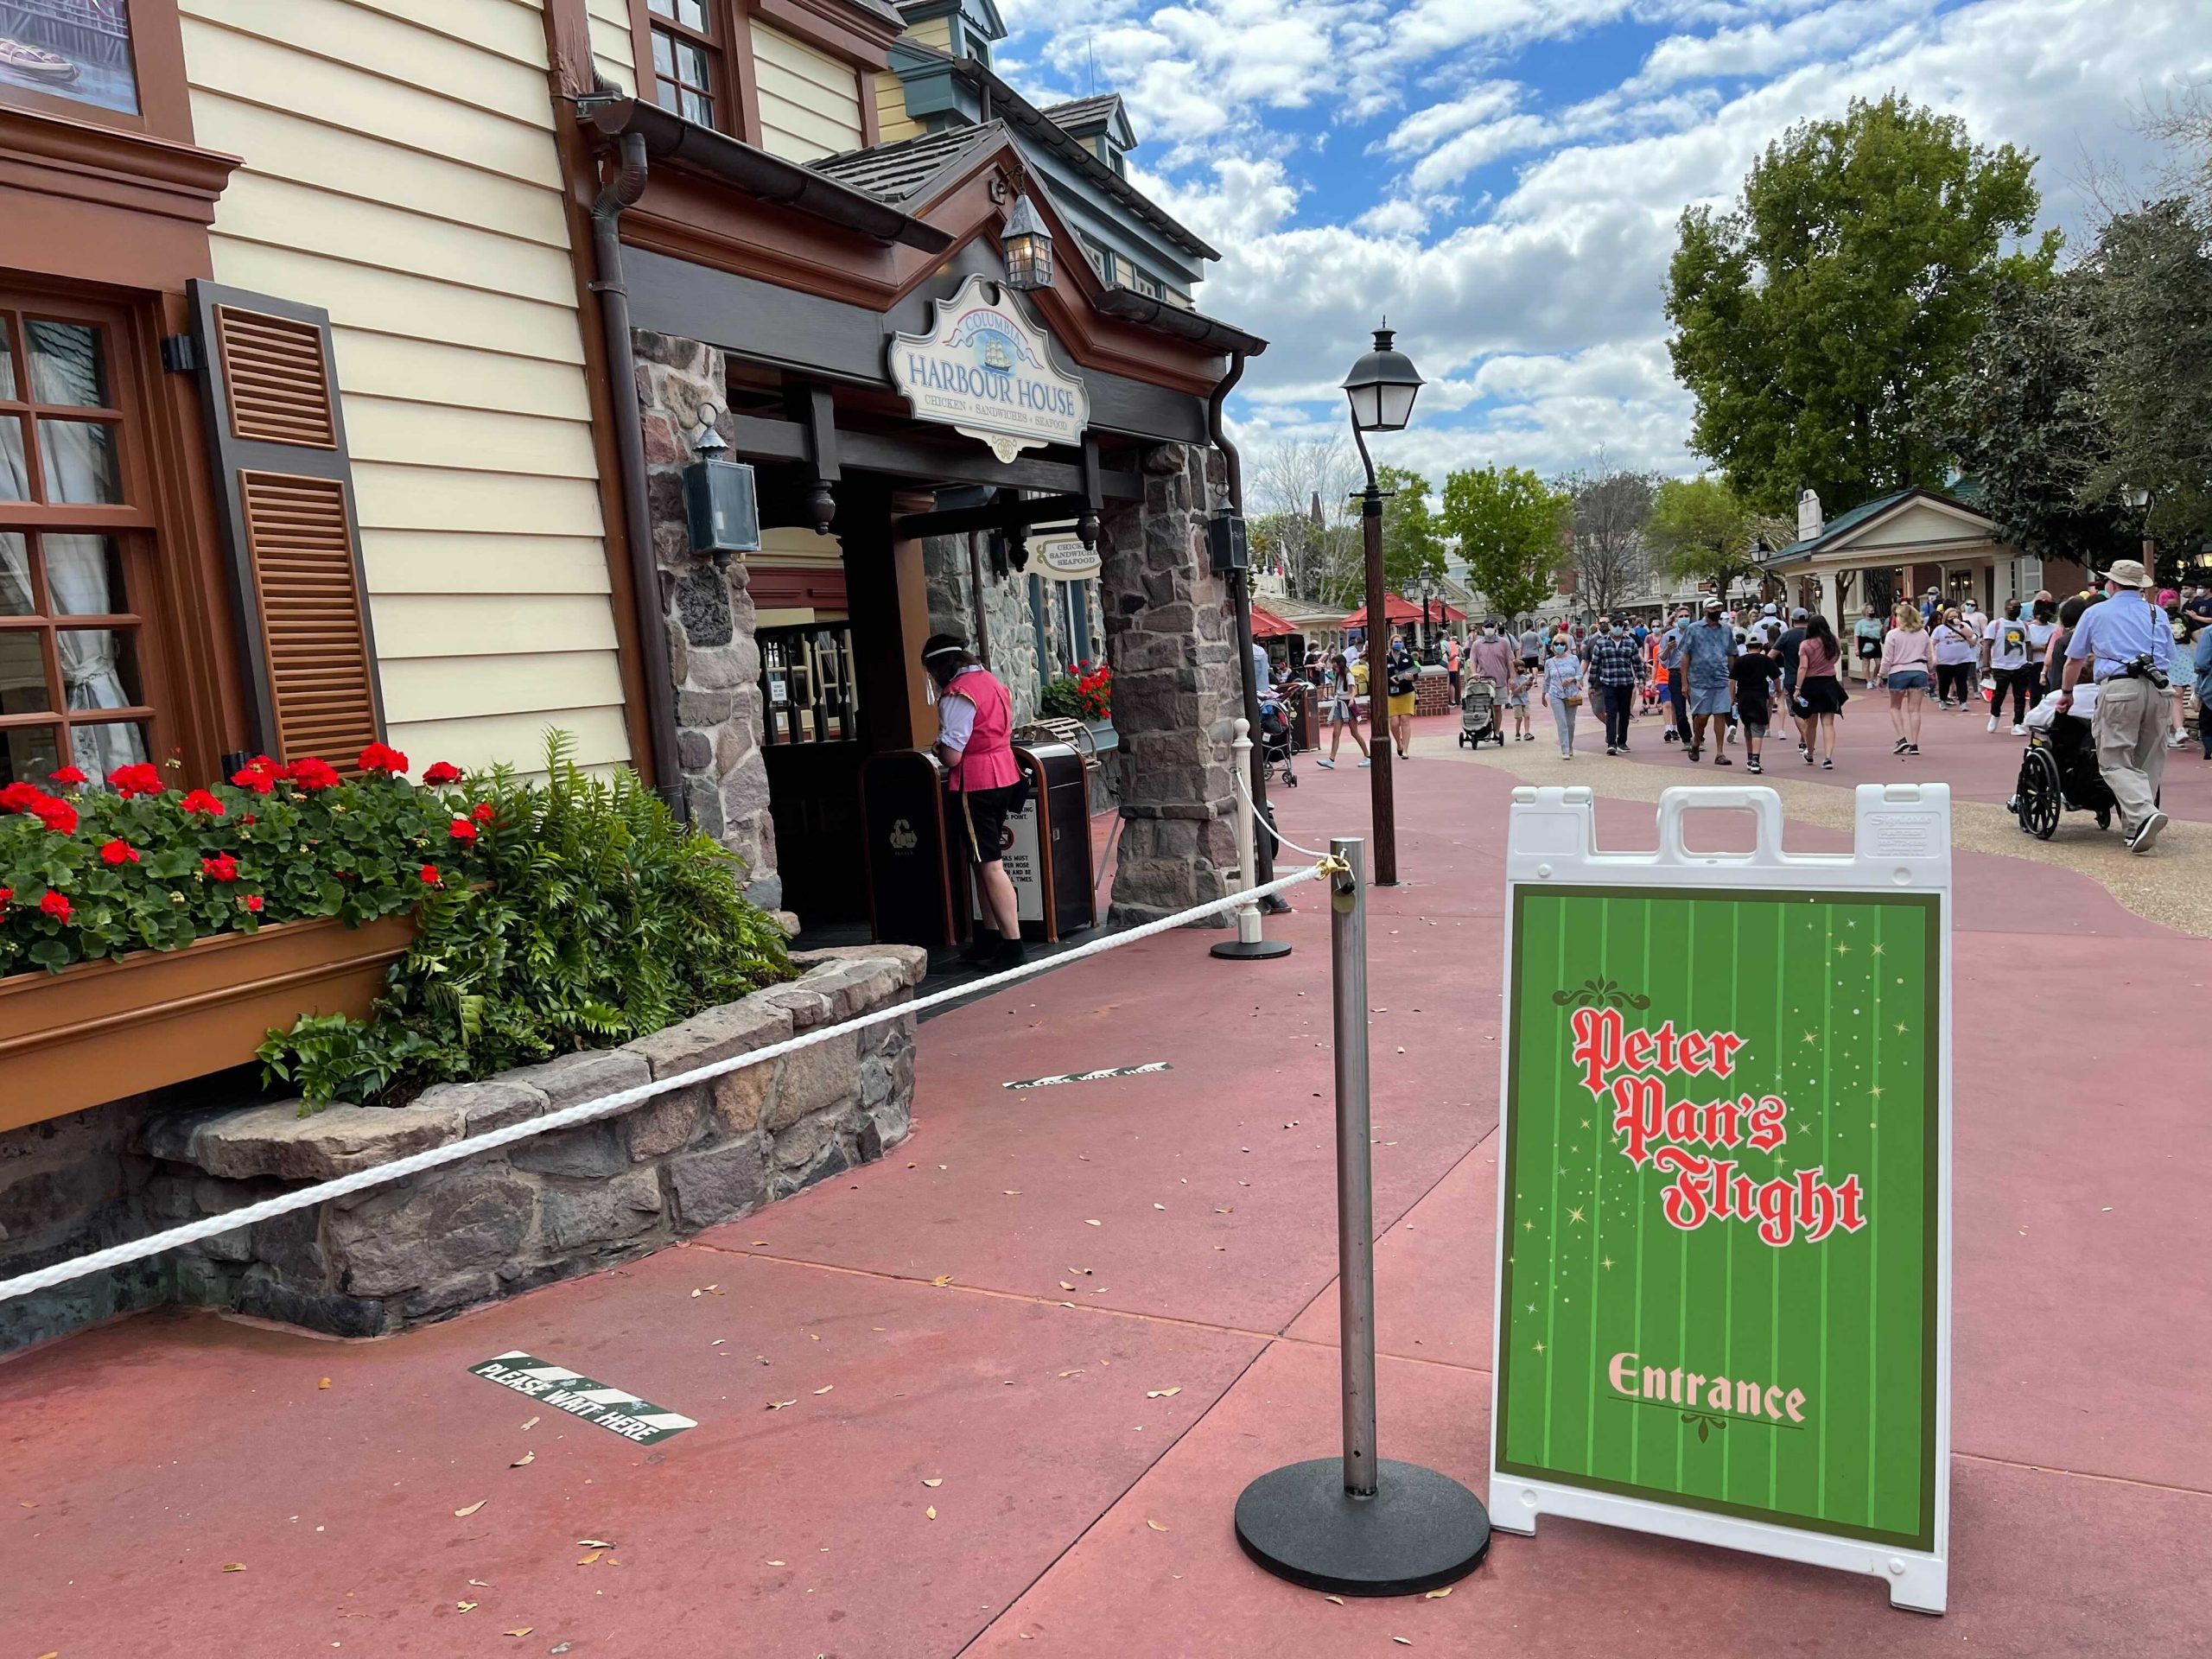
But the worst offender for the past week was Peter Pan’s Flight. At this one attraction, submitted actual wait times were only 43% of posted wait times, which means that if Peter Pan’s Flight had a 60 minute posted wait, you probably would’ve waited less than 26 minutes. Less than half of what was posted. Peter Pan’s Flight was also the “winner” for this category for the past two posts, so the inflated wait times are persistent. Remember to always check the Lines app for predicted actual waits instead of believing what is posted.
Actual Wait Time Rock Star
The Actual Wait Time Rock Star for this past week was shop.kgb, who submitted 50 wait times through the Lines App over the last 7 days. This includes 7 Lightning Lane waits, 42 Standby waits, and 1 Single Rider wait. Even more impressive, all of these wait times happened over just 3 days total. Including one day in the Magic Kingdom with 28 individually recorded actual wait times – all in standby. Thanks for your hard work, shop.kgb! You also get the all-time record.
In the next week, we could especially use standby wait times for the newly reopened character meet and greets, and lightning lane wait times for all characters.
Looking Ahead: January 31st through February 6th
Since it takes time to pull data and write a post, you’ll be reading this on February 1st, when January is already in the past. But we’re staying as close to real-time as possible.
Early February should be a relatively lovely time to visit the parks. Especially in this very first week, you can expect to see some crowd levels in the 4, 5 and 6 range. Not much is going on other than Festival of the Arts. Schools are in session. And there is only one dance competition happening February 3-5. But don’t let that lull you into a false sense of security! Late February is a much different story. And while I usually only look about a week into the future for you readers planning trips … I want to fast forward a bit here.
The week of President’s Day has a bunch of events that could combine to create a series of days with very heavy crowds and high wait times. First, President’s Day Weekend itself is a big draw, especially for locals. Pretty much any time you have a long weekend, you’ll see crowd levels trend upward. Compounding that this year are two larger competitions being hosted at the Wide World of Sports. One is gymnastics and the other is soccer. These happen exactly over President’s Day weekend, and many families with participating children will choose to extend the trip.
Then, Mardi Gras this year falls on February 21st. The day after President’s Day. Mardi Gras generally inspires a bunch of travel to Orlando from folks that already live in the Southeast. Combine it with a long weekend, and … yikes. And finally, the Princess Half Marathon happens from February 23rd through 26th. Once again, quite a few families will take advantage of the already shortened week of school thanks to President’s Day, and will stay all week, wrapping things up with the Half Marathon.
If you’re going to be at WDW in the second half of February, plan ahead now and prepare yourself for those larger crowds.
You May Also Like...
-

Welcome to 2023, Disney data friends! A time for setting goals and dreaming big dreams. A time for reviewing where we've…
-

And we're back! It's been two whole weeks since you've gotten your dose of Disney data, and I know you've all…
-

After all of the excellent news coming from Disney yesterday, I think we all just need a minute to do a…
-

New blog series, who dis? We know that you come to TouringPlans because of all of our data. And other than…
Hi Becky, your Data Dumps are very informative! I was wondering if you have found that the days with After Hours events at Hollywood Studios have the same/higher/lower wait times as days without After Hours. Thanks!
So far, no noticeable trend. Park hours are essentially the same, so it generally doesn’t discourage people from attending or force them to other days.
Great, thanks for the info!