
Disney Data Dump February 15 2023
We made it past Valentines Day! I hope your day was full of chocolate and love and data. What? Not enough data? Well, we’ll take care of that today. While preparing this week’s article, I happened upon a lot of interesting numbers, including the most inflated posted wait times that I’ve seen in a week at a single attraction, the highest capacity lost due to downtime in a week at a single attraction, a new attraction with the highest average posted wait time at Hollywood Studios for the first time in many months, and some very different rope drop downtime than we’ve seen recently. Read on to share in my excitement over all of these numbers!
Observed Crowd Levels 2/7 – 2/13
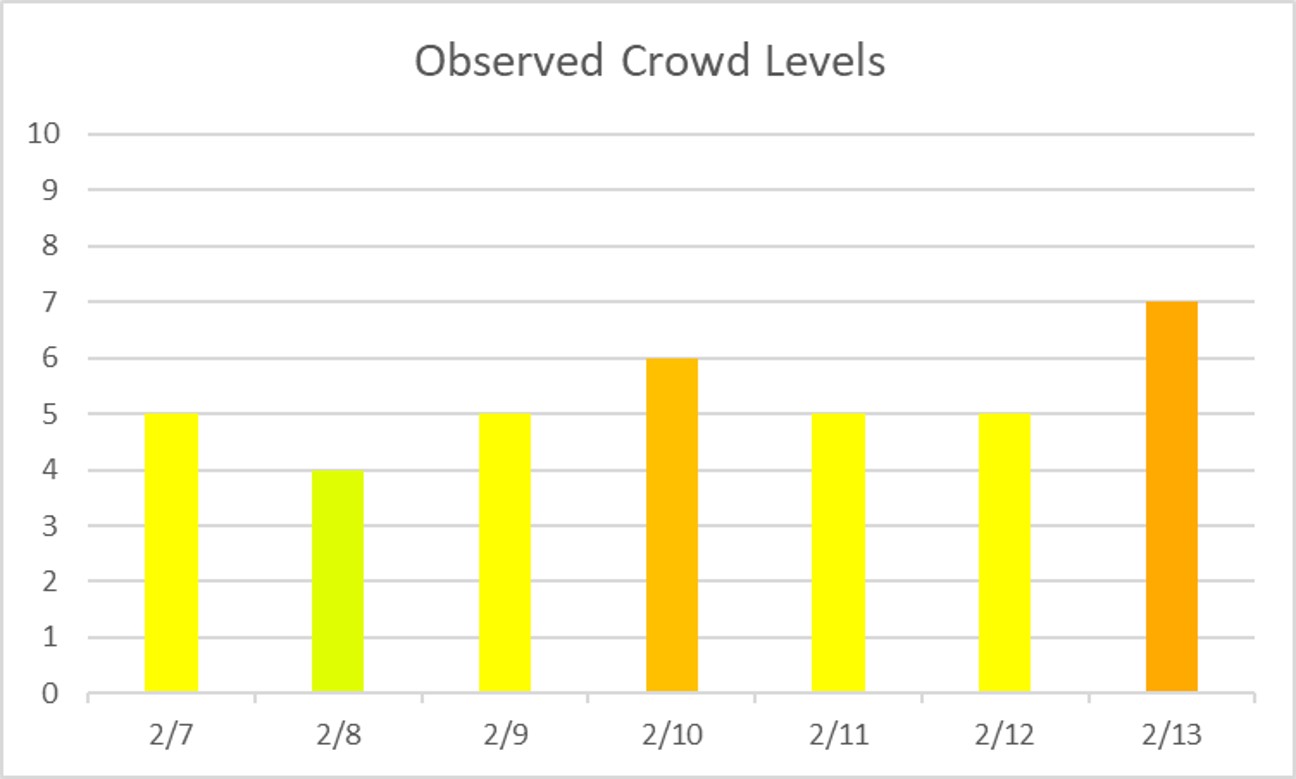
As predicted last week, this middle of February is pretty pleasant! Not winter doldrums like in years past, but nothing crazy either. February is saving its crazy for the week of President’s Day. Most of the week held steady at crowd level 5 for the resort as a whole. But as we’ve seen before, this big picture doesn’t tell the whole story, so let’s dig a little deeper.

Look at EPCOT! Good, old, walking-heavy, dependable EPCOT. The thing is, the crowd level never really captures how EPCOT feels. Specifically, the evening of the 8th was next-level bonkers-crazy thanks to Moonlight Magic. Participants ended up flooding the park early, when they were allowed into the park at 7 pm. And the lines at all of the booths for Festival of the Arts got slammed, because they closed before the official event started. So beware on any of those future Moonlight Magic dates (including the day this posts)!

And our friend, Magic Kingdom – the antithesis to EPCOT’s chill. Magic Kingdom continues to be all over the place. Let me give you a peek into the crazy of how I try to figure out why things are so all over the place at Magic Kingdom. Are weekends popular? No, the busiest days were a Tuesday and Monday. Did different park hours drive behavior? Well, the 8th and the 13th were the days when the park was open 8-10 instead of 9-11 like “normal” … and those days had very different crowd levels. Did weather have an impact? Hm, it was sunny on the 7th, 8th, and 13th. Maybe sun drives crowds … except for the 8th? So I don’t know. Magic Kingdom be crazy, y’all.

Each week, I’m giving you a very transparent look into how our crowd level predictions performed. Each day at each park is one data point, so we have 28 different crowd level predictions to evaluate each week. Any time a prediction is within one or two crowd levels, things won’t really “feel” much different than what we predicted. Being off by 3 or more crowd levels is where we’d like to be more accurate because you might feel that difference in wait times throughout the day.
In the past week, Touring Plans predictions were either spot-on or within 1 crowd level 71% of the time. This is ever-so-slightly better than last week. 89% of the time Touring Plans were within 2 crowd levels, and that means we earn a B+ for our predictions this past week. Down from the very high score last week, but still better than average. The biggest miss of the week was on February 11th. On that day, crowds at Magic Kingdom were 4 levels lower than expected. The same thing happened on February 5th last week. Come on, Magic Kingdom crowds, pull yourself together.
Attraction Downtime 2/7 – 2/13
If we average out all of the capacity lost due to unexpected downtime over the past two weeks, it comes out to 4.1% of attractions unexpectedly being down. This is continuing to trend up from the lows we saw over the holidays. Hm, maybe I should start including a trending graph. I like that idea! Next week. The park with the biggest issues was easily Hollywood Studios, with 6.7% of its capacity lost due to unexpected downtime. This was almost double the average capacity lost at the other three parks.
The worst day for attraction downtime in the past week was on February 11th. On that day, almost 6% of all capacity at WDW was lost due to unexpected downtime. The worst park-days of the week were both at Hollywood Studios, on the 11th and 12th. On those days, 10% of the the capacity at that park was lost due to unexpected downtime. Hollywood Studios was open for 12.5 hours on those days, so 10% downtime is the equivalent of the whole park being down for almost 75 minutes each day – two days in a row of over an hour of the whole park being down. Thankfully, on neither day did this appear to significantly impact crowd levels, since the park came in either at or slightly below predictions.
Attraction Downtime
The worst offender was the Rock’n’Roller Coaster, which was unexpectedly down for approximately 32% of the week. This is the third week in a row where the “winner” of this category was down for 20% or more of the week. And this 32% is the biggest downtime we’ve seen for any attraction in a given week since we’ve started tracking it. Ouch! I guess those rock stars are stereotypically unreliable, so maybe we all should have seen this coming. The worst day for the coaster was February 11th, when it was down for 66% of the day – but the 12th came in close behind with 64% capacity lost that day. Rock’n’Roller Coaster goes down for a lengthy refurbishment starting February 20th, so I guess that is well-timed.
Rope Drop Downtime
Here are this week’s problematic offenders:
- Magic Kingdom: TTA PeopleMover (unavailable for 29% of its first hour of the day), Peter Pan’s Flight (unavailable for 23% of its first hour of the day)
- EPCOT: Test Track (unavailable for 14% of its first hour of the day)
- Hollywood Studios: Rise of the Resistance (unavailable for 34% of its first hour of the day), Rock’n’Roller Coaster (unavailable for 28% of its first hour of the day), Tower of Terror (unavailable for 22% of its first hour of the day)
- Animal Kingdom: No rope drop downtime issues!
What a rough week for Hollywood Studios! Rise of the Resistance not coming up in the morning a third of the time is really not-great. It’s easily the best pick for rope dropping and avoiding lines, partially because its reliability issues create some very spiky waits throughout the day. And then the Rock’n’Roller Coaster/Tower of Terror combo basically forces early morning crowds all into Toy Story Land or maybe Runaway Railway. Hopefully some of this resolves itself quickly. The other parks are not nearly as problematic.
Wait Times 2/7 – 2/13
Attractions with the Highest Average Posted Wait at each park
- Hollywood Studios: Slinky Dog Dash, average posted wait of 89 minutes (90 minutes last week at Tower of Terror last week)
- Animal Kingdom: Flight of Passage, average posted wait time of 113 minutes (99 minutes last week)
- EPCOT: Remy’s Ratatouille Adventure, average posted wait time of 68 minutes (67 minutes last week)
- Magic Kingdom: Seven Dwarfs Mine Train, average posted wait time of 72 minutes (71 minutes last week)
Two big things to note from this data this week! First, Flight of Passage bucks the trend of mostly-flat highest average posted wait times compared to last week. Instead, its average posted wait increased by almost 15%! And second, for the first time in months, Tower of Terror lost its top spot at Hollywood Studios. Slinky Dog Dash took over, while Tower of Terror slipped into second place instead.

Parks with the Highest and Lowest Average Wait
These parks likely won’t change week-to-week unless something ridiculous happens, but these data points will give us a high-level view of how wait times are trending from week to week.
- Highest: Hollywood Studios, average park-wide posted wait of 44 minutes (last week 42 minutes)
- Lowest: EPCOT, average park-wide posted wait of 24 minutes (last week 24.5 minutes at Magic Kingdom)
Last week I predicted that EPCOT would come and reclaim its title for lowest park-wide average posted wait, and thankfully the data (barely) proved me right. Technically EPCOT only beat out Magic Kingdom by something ridiculous like 0.15 minutes. But I’m still claiming it as a victory. Those couple of very-low crowd days did skew Magic Kingdom lower than I expected, though.
Most Inflated Posted Wait Times
We all know that Disney inflates their posted wait times on purpose. They have many reasons for doing this. Some are totally understandable, and some are potentially more problematic. We can figure out how much posted wait times are being inflated by comparing submitted actual wait times from the Lines App and the posted wait time when the person timing their wait entered the line.
Over the past week, actual wait times in the Lines App averaged 66% of what was posted. This is ever-so-slightly above our historical average, and a couple of percentage points above what we’ve seen the past two weeks. If the posted wait time was 20 minutes, you could’ve expected to wait just over 13 minutes instead.
But the worst offender for the past week was Peter Pan’s Flight. It was dethroned after a three-week reign of terror, but now it’s back! At this one attraction, submitted actual wait times were only 38% of posted wait times, which means that if Peter Pan’s Flight had a 60 minute posted wait, you probably would’ve waited less than 23 minutes. Just over a third of what was posted. This is the worst inflation we’ve seen for any ride since we started checking weekly. Remember to always check the Lines app for predicted actual waits instead of believing what is posted.
Actual Wait Time Rock Star
The Actual Wait Time Rock Star for this past week was … passesforsix, who submitted 40 wait times through the Lines App over the last 7 days! This includes 17 Lightning Lane waits, 19 Standby waits, 2 Single Rider waits, and 2 Virtual Queue waits. Thanks for your hard work, passesforsix! But you didn’t reclaim that all-time record, when is still held by shop.kgb, with 50 recorded wait times in a single week.
In the next week, we could especially use lightning lane wait times for characters. We have very small sample sizes for those at this point. Thanks!
Looking Ahead: February 14th through February 20th
Okay, the time is now. Our week ahead starts to include what should be some of the worst crowds of the winter, thanks to the arrival of President’s Day Weekend. A federal holiday that strikes fear into the heart of anyone who hates crowded parks. Or at least it should be, anyway. Not only do we have a long weekend, but we also have Mardi Gras (which draws many visitors to Orlando from throughout the southeast), two large sports competitions on property, and an upcoming marathon weekend. Even the forecast is conspiring against us, with plenty of sunny, warm days that will draw out any locals that can get into the parks too. Prepare yourselves.
On the other hand, I’ve been beating this drum for several weeks now, so maybe everyone will have listened to me and the parks will be empty. I don’t think that will be the case, though. I’m not that important. Plus, park passes are already “sold out” for Magic Kingdom on the 17th (Friday) and Magic Kingdom plus Hollywood Studios on the 21st (Tuesday, Mardi Gras). We haven’t seen park passes sell out in quite some time, so you know that means that the crowds are coming.
Otherwise, the upcoming week is pretty “normal”. Two After Hours events at Magic Kingdom, one at Hollywood Studios, Moonlight Magic at EPCOT, and Extended Evening Theme Park Hours at Magic Kingdom and EPCOT.
You May Also Like...
-

Happy February, Disney Data fans! I have to start out this special February 8 post by giving a shout-out to my…
-

Happy February! This last week of January may eventually look, in hindsight, like the calm between the storms for several reasons.…
-

And we're back! It's been two whole weeks since you've gotten your dose of Disney data, and I know you've all…
-

After all of the excellent news coming from Disney yesterday, I think we all just need a minute to do a…
I was in Magic Kingdom on Feb 11th and it was lovely! So fantastic. I even commented on the chat that it was super quiet for a Saturday. I wonder if it’s because Cheerleaders were out of the parks/not very interested in Magic Kingdom? Anyway, we did so many rides that day.
Hi! I love your posts and videos! Several months ago you posted an early entry and genie plus strategy for each of the Disney World parks is that still what you recommend? I’m asking because I’m traveling in March and it seems somethings have changed with genie plus and the touring plan for my day with the algorithm didn’t recommend a top ride first thing in the morning which is confusing me. TIA for any advice you can share.
The Touring Plans Genie+ integration takes a pretty conservative approach with LL that might sell out quickly. So while those appear early in my plan because I assume you can get them, most of the plans will have you bypass them. I unfortunately haven’t updated those plans, but am working toward it. I got updated time savings last week, will try for updated availability charts this week, and then updated priority lists and plans the week or two after that.