
Disney Data Dump February 8 2023
Happy February, Disney Data fans! I have to start out this special February 8 post by giving a shout-out to my biggest kid, who turns 7 years old today. I’ll probably sprinkle in some photos of her throughout the post, as they relate to the data. But other than big birthdays, it’s a rather calm week in the world of Disney data. No major events. No party season. One early park closure. Some operational issues. We’ll get to all of that. But on the whole, early February seems to have been a lovely time to be at Walt Disney World.
Observed Crowd Levels 1/31 – 2/6
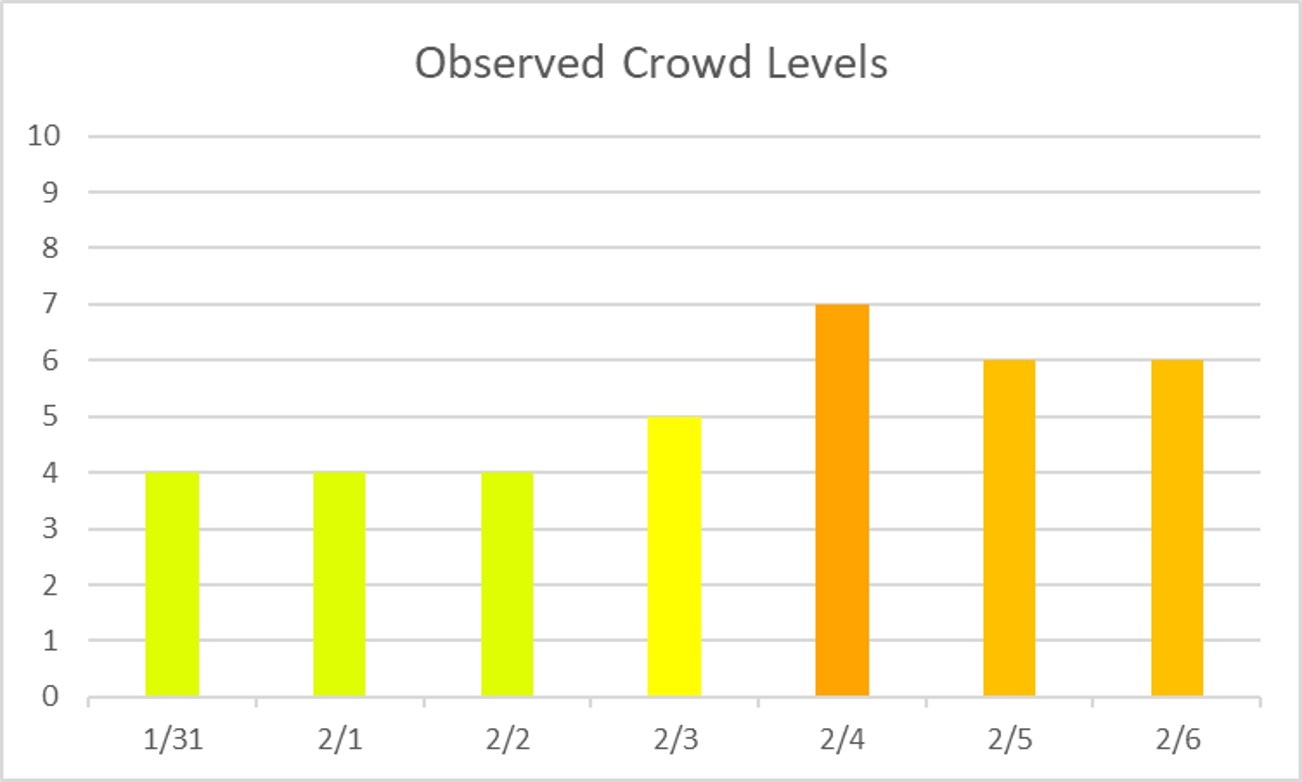
Let’s start with the good news this week – things are slightly more predictable! We ended January and started February with moderately low crowds, and then things picked up a little as we moved through early February. Again, you’re not seeing ghost town types of non-crowds like you do after Labor Day. But these are manageable crowd levels that should make touring pretty easy. But as we know, the overall numbers don’t always show the full picture.

If we “zoom in” to just the Magic Kingdom, things get a lot weirder. We end January with a crowd level one day. On this day, the Magic Kingdom closed early for a cast member appreciation event. If you didn’t mind missing the evening entertainment, this was pretty much an ideal day for touring the Magic Kingdom. Very, very low wait times. Then on the 4th, 5th, and 6th we have a very odd pattern. There was no good reasons for crowds to disappear from the Magic Kingdom on the 5th. No good reason. Similarly, there was no real reason for them to magically reappear in big quantities on the 6th. The crowd level on the 6th is actually somewhat inflated thanks to a very large amount of unexpected downtime that day. But that random selection of “should we go to Magic Kingdom on the 5th or the 6th”, picking between what should have been two very similar days, ended up yielding very different experiences.

Each week, I’m giving you a very transparent look into how our crowd level predictions performed. Each day at each park is one data point, so we have 28 different crowd level predictions to evaluate each week. Any time a prediction is within one or two crowd levels, things won’t really “feel” much different than what we predicted. Being off by 3 or more crowd levels is where we’d like to be more accurate because you might feel that difference in wait times throughout the day.
In the past week, Touring Plans predictions were either spot-on or within 1 crowd level 68% of the time. This is a big drop from the previous week, and more in line with our historical average. 96% of the time Touring Plans were within 2 crowd levels, and that means we earn an A for our predictions this past week. The biggest miss of the week was on February 5th. On that day, crowds at Magic Kingdom were 4 levels lower than expected. Again, this is … interesting and seemingly unexplainable.
Attraction Downtime 1/31 – 2/6
If we average out all of the capacity lost due to unexpected downtime over the past two weeks, it comes out to 3.7% of attractions unexpectedly being down. This is a decent uptick from the lows we saw over the holiday season. The park with the biggest issues was Magic Kingdom, with 4.9% of its capacity lost due to unexpected downtime.
The worst day for attraction downtime in the past week was, by far, on February 6th. On that day, 8% of all capacity at WDW was lost due to unexpected downtime. The single worst park-day of the week was also on February 6th, at Magic Kingdom. On that day, 13% of the the capacity at that park was lost due to unexpected downtime. Magic Kingdom was open for 14 hours on that day , so 13% downtime is the equivalent of the whole park being down for almost 110 minutes – just short of TWO HOURS. The entire park! And, if you read the crowd level section above, you know that this most certainly impacted wait times and crowd level, which was predicted to be a 6 and ended up an 8.
Attraction Downtime
The worst offender was the Haunted Mansion, which was unexpectedly down for approximately 20% of the week. This is once again a very large number, thankfully slightly lower than Frozen Ever After‘s all-time high of 21% last week. Its worst day was easily February 6th, when it was unavailable for all day. All the live-long day.

Rope Drop Downtime
Here are this week’s problematic offenders:
- Magic Kingdom: Haunted Mansion (unavailable for 33% of its first hour of the day), The Many Adventures of Winnie the Pooh (unavailable 22% of its first hour of the day), Astro Orbiter (unavailable for 16% of its first hour of the day), TTA PeopleMover (unavailable for 16% of its first hour of the day)
- EPCOT: Spaceship Earth (unavailable for 29% of its first hour of the day), Test Track (unavailable for 17% of its first hour of the day)
- Hollywood Studios: Rock’n’Roller Coaster (unavailable for 27% of its first hour of the day)
- Animal Kingdom: No rope drop problems!
The weirdness has arrived! None of these entries (except for Test Track) make regular appearances on our rope drop downtime reports. So I guess the Disney Downtime Deciders thought that we were getting to comfortable with our strategy. Instead of the “left side” of Magic Kingdom struggling to wake up in the morning, it’s Tomorrowland with the issues this week. Pirates and Big Thunder were just fine. And for once, rope drop at Hollywood Studios was a decently easy strategy to plan. Rise of the Resistance to Slinky Dog Dash, with little downtime at either.

Wait Times 1/31 – 2/6
Attractions with the Highest Average Posted Wait at each park
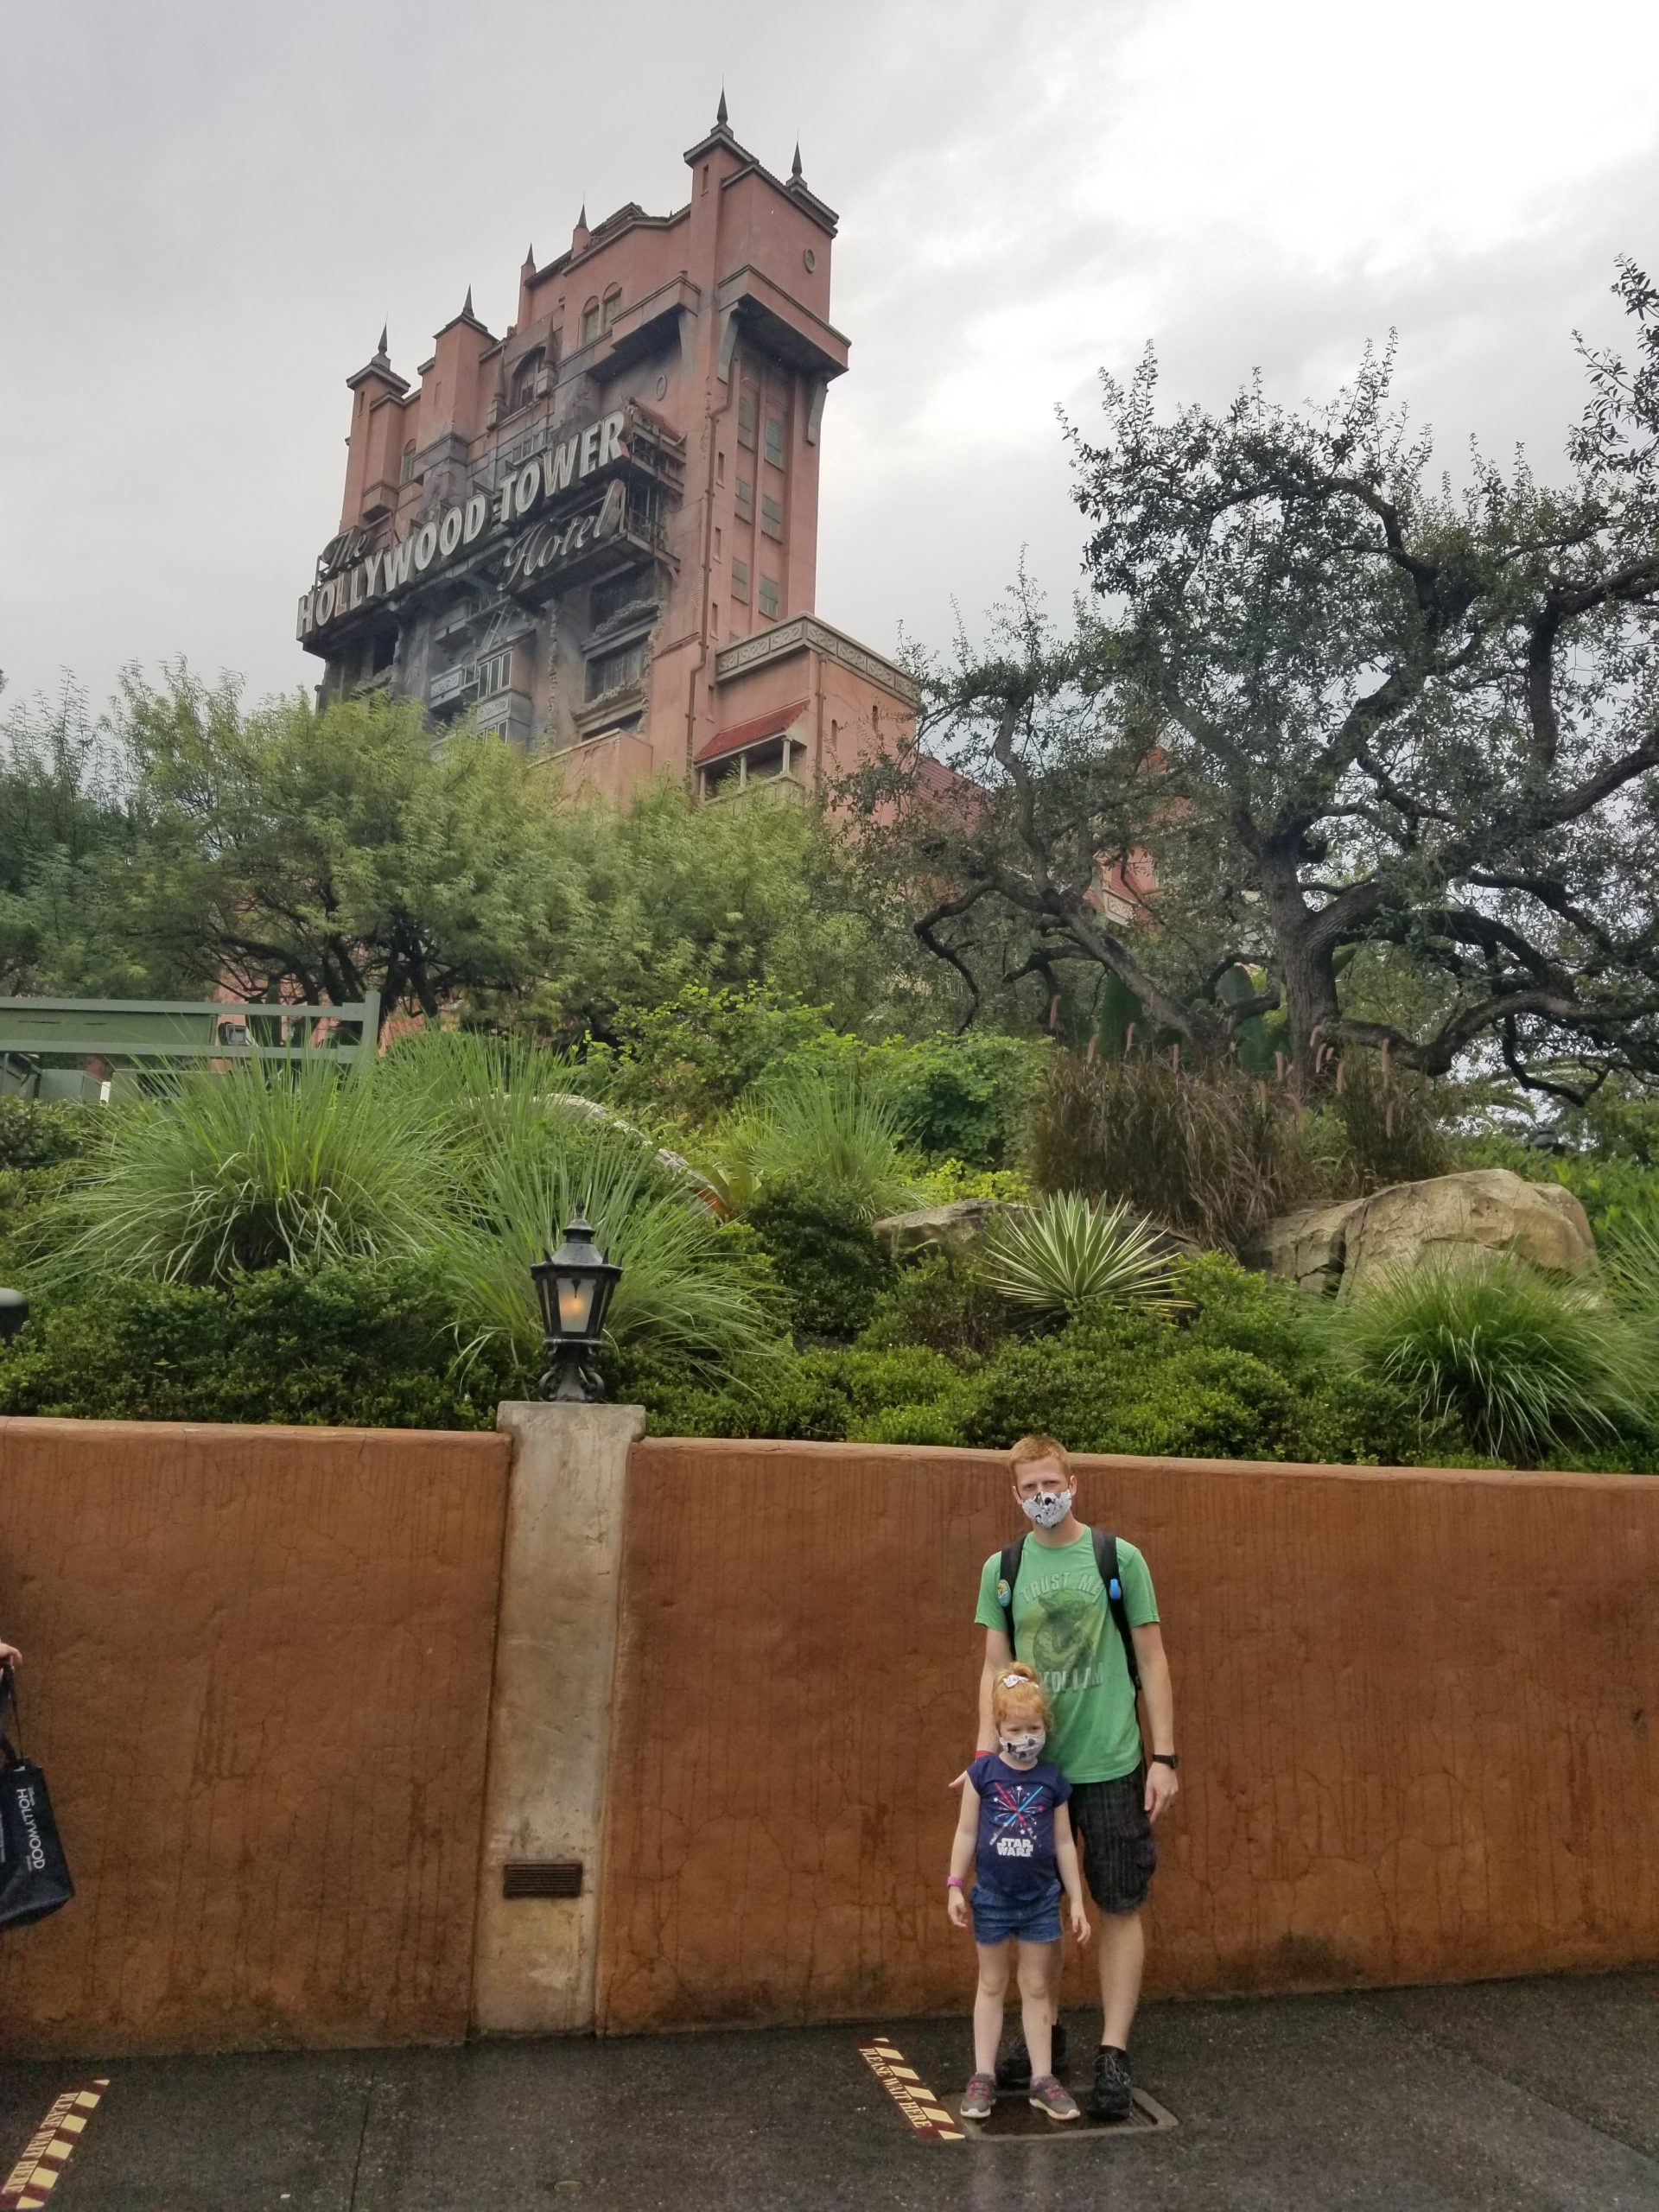
- Hollywood Studios: Tower of Terror, average posted wait of 90 minutes (94 minutes last week)
- Animal Kingdom: Flight of Passage, average posted wait time of 99 minutes (99 minutes last week)
- EPCOT: Remy’s Ratatouille Adventure, average posted wait time of 67 minutes (74 minutes last week)
- Magic Kingdom: Seven Dwarfs Mine Train, average posted wait time of 71 minutes (75 minutes last week)
The world continues to be alright now that Flight of Passage keeps its longest wait time crown. Every other big headliner at each park saw its average posted wait time decrease slightly this week compared to last week. Expect this trend to continue for maybe one more week, before the big Mardi-President-Marathon-Competition crowds descend upon the parks.
*Got shaken and dropped in a laundry basket. Y’know, safely.
Parks with the Highest and Lowest Average Wait
These parks likely won’t change week-to-week unless something ridiculous happens, but these data points will give us a high-level view of how wait times are trending from week to week.
- Highest: Hollywood Studios, average park-wide posted wait of 42 minutes (last week 43 minutes)
- Lowest: Magic Kingdom, average park-wide posted wait of 24.5 minutes (last week 25 minutes at EPCOT)
Chalk this one up to the very low crowds on the early closing day at Magic Kingdom, followed the rather shocking lack of crowds at the same park on February 5th. The difference between overall average posted wait times between Magic Kingdom and EPCOT this week was almost negligible, so I suspect that EPCOT will once again become the lowest-wait-time park next week.
Most Inflated Posted Wait Times
We all know that Disney inflates their posted wait times on purpose. They have many reasons for doing this. Some are totally understandable, and some are potentially more problematic. We can figure out how much posted wait times are being inflated by comparing submitted actual wait times from the Lines App and the posted wait time when the person timing their wait entered the line.
Over the past week, actual wait times in the Lines App averaged 64% of what was posted. This is very in line with our historical average, and the exact same as the number last week. So if the posted wait time was 20 minutes, you could’ve expected to wait less than 13 minutes instead.
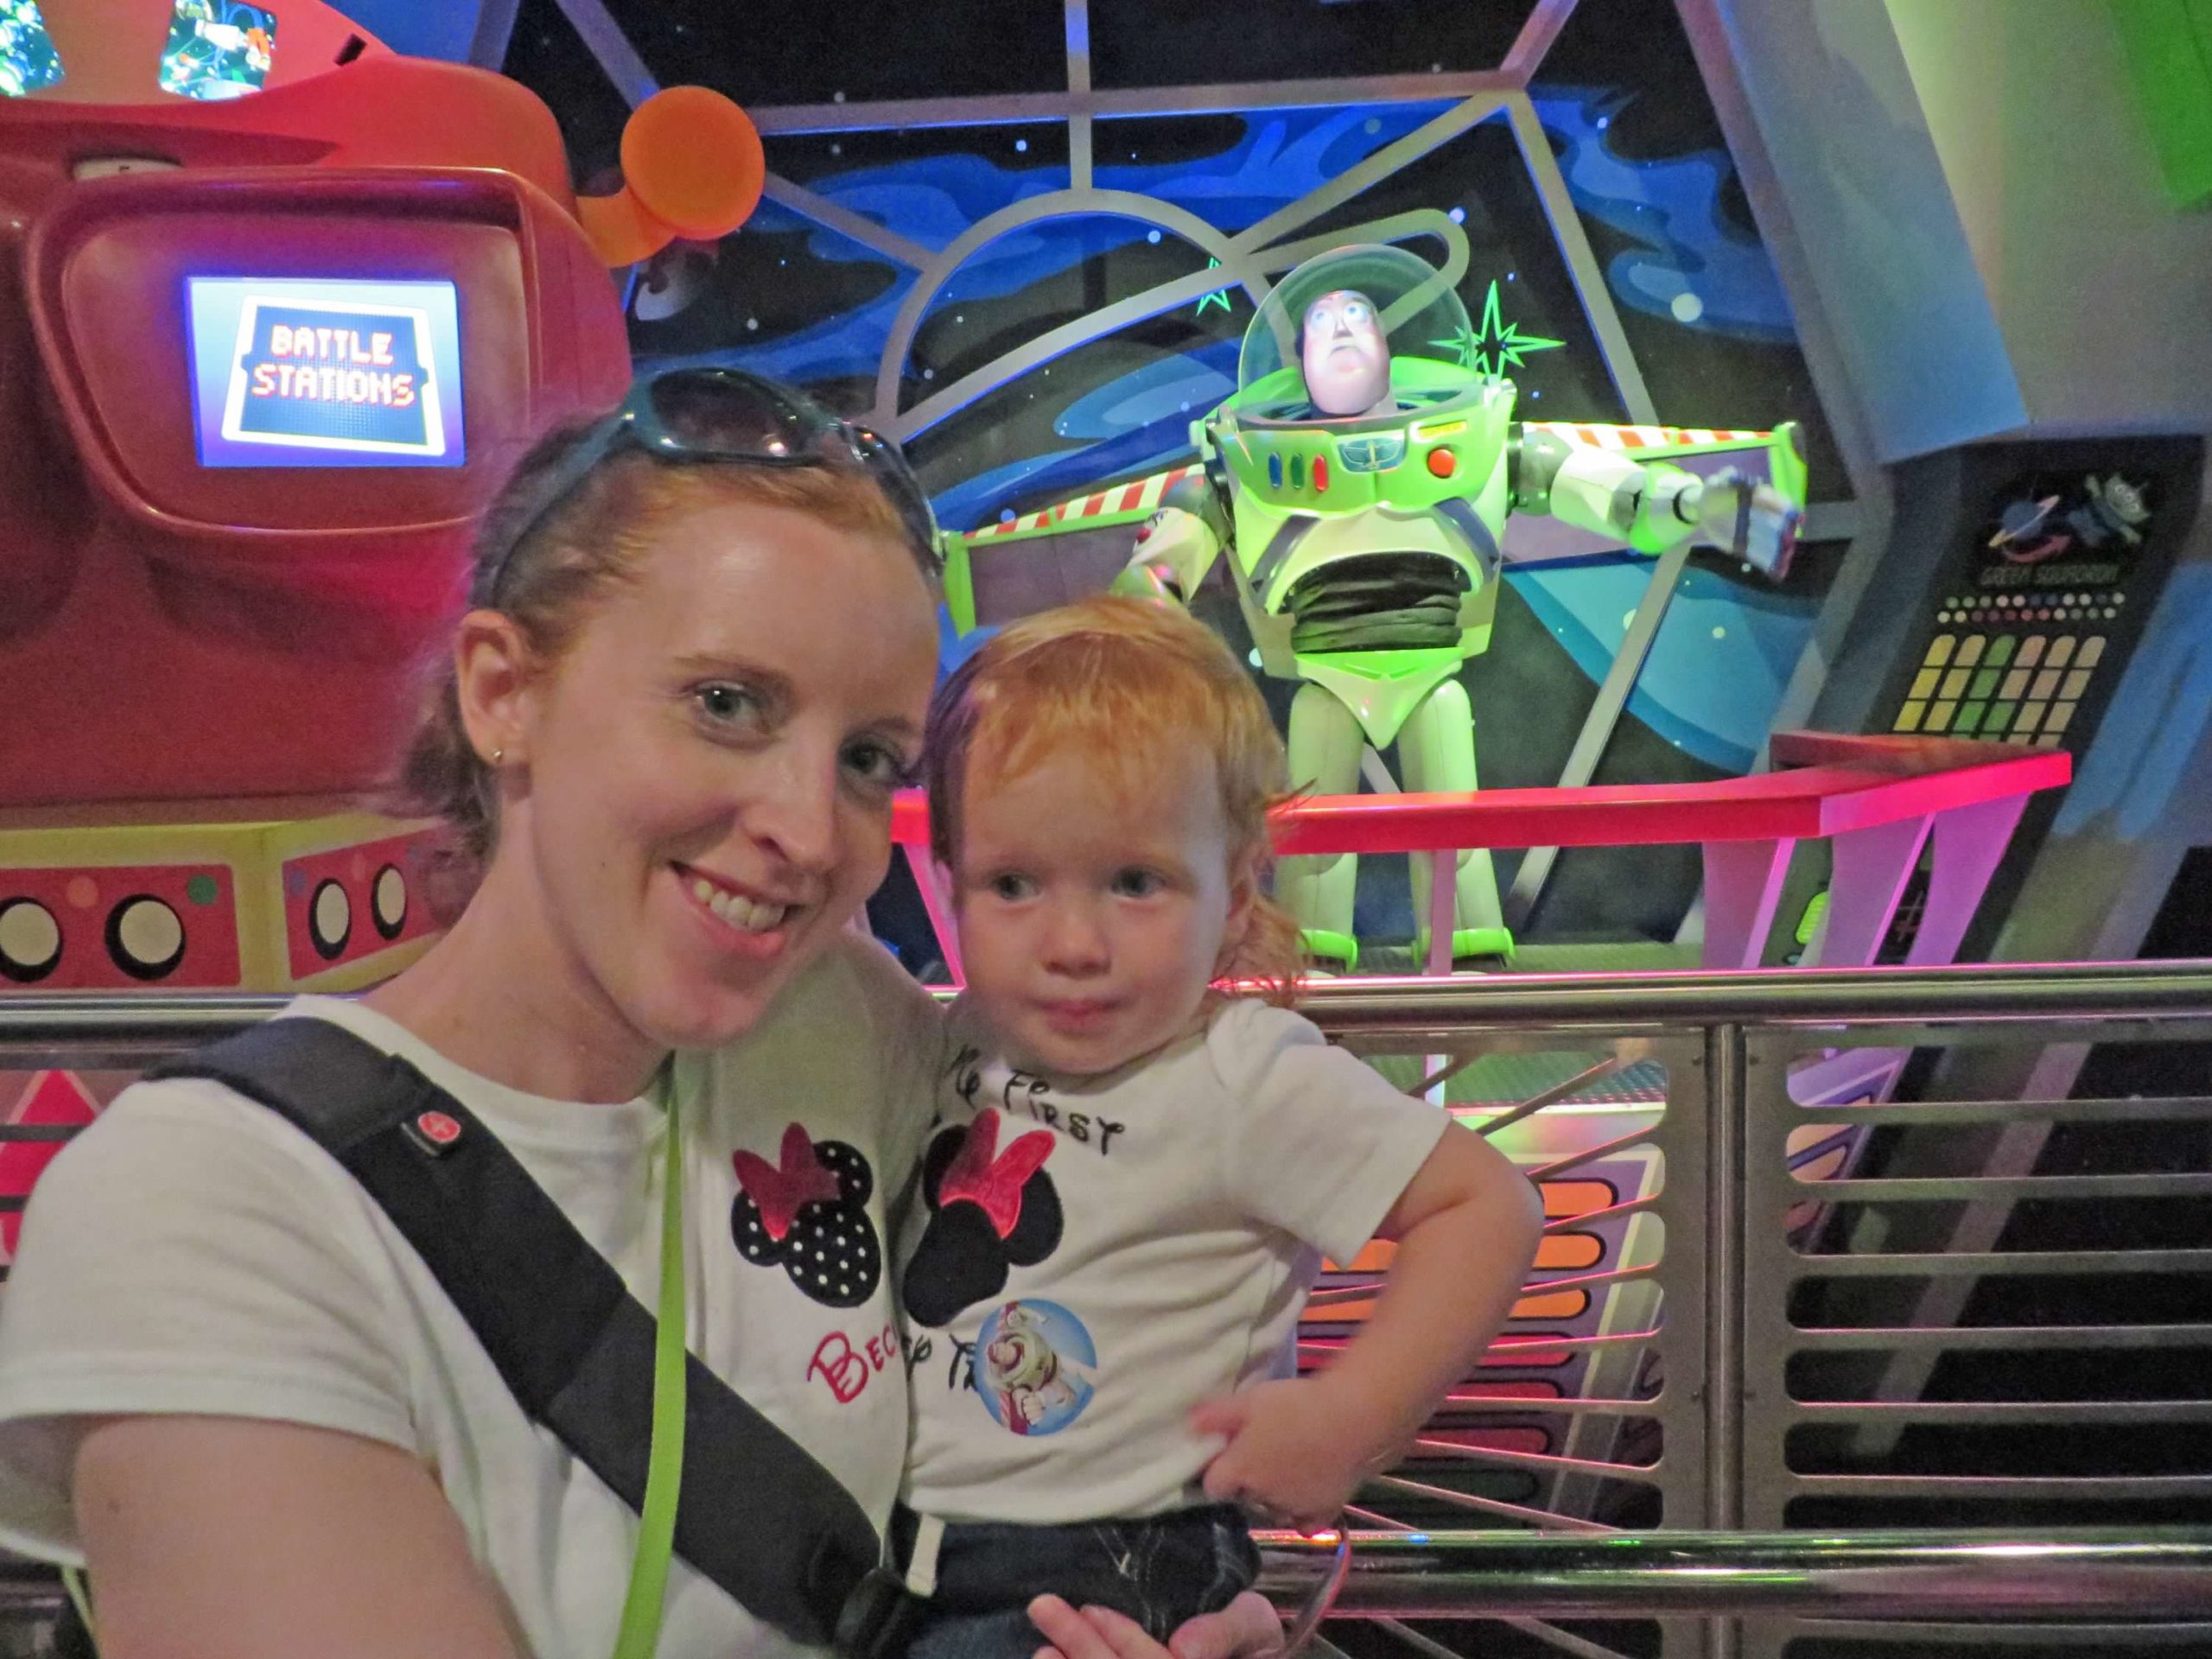
But the worst offender for the past week was Buzz Lightyear’s Space Ranger Spin. At this one attraction, submitted actual wait times were only 46% of posted wait times, which means that if Buzz Lightyear had a 30 minute posted wait, you probably would’ve waited less than 14 minutes. Less than half of what was posted. Buzz Lightyear dethrones Peter Pan’s Flight after an impressive 3-week reign. Remember to always check the Lines app for predicted actual waits instead of believing what is posted.
Actual Wait Time Rock Star
The Actual Wait Time Rock Star for this past week was … mbcollins, who submitted 32 wait times through the Lines App over the last 7 days! This includes 17 Lightning Lane waits, and 15 Standby waits. Thanks for your hard work, mbcollins! But you didn’t reclaim that all-time record, when is still held by shop.kgb, with 50 recorded wait times in a single week.
In the next week, we could especially use single rider wait times for attractions that have that option, as well as all wait time types at Cosmic Rewind. Thanks!
Looking Ahead: February 7th through February 13th
Next week should remain relatively calm at Walt Disney World. Other than Extended Evening Theme Park Hours at EPCOT on the 13th (start your Galentines Day with Liege waffles, end it with an empty late-night stroll around World Showcase? Ideal day), and the ongoing Festival of Fine Arts, no special events are happening. TRON previews continue, but shouldn’t really impact crowds.
Temperatures will stay pretty high (she says as she writes from the frozen tundra of Missouri) for the rest of the week before cooling back off over the weekend. Not much rain is in the forecast, so that shouldn’t force any game-day decisions on whether to chill at the resort or brave the parks. Overall, if you’re going to Walt Disney World in February, this is a pretty great time to do it. I have some friends headed to Orlando this weekend to take their daughter to Festival of the Arts, and I’m big enough to admit that I’m jealous 🙂
Keep in mind, as we edge toward President’s Day Weekend, things are going to get worse. Barring some freak February hurricane (I’m not ruling anything out anymore), the combination of a long weekend with Mardi Gras, a couple of large competitions, and then a half-marathon weekend means lots of humans in the parks. Go in prepared with a plan and some patience.
You May Also Like...
-

Happy February! This last week of January may eventually look, in hindsight, like the calm between the storms for several reasons.…
-

How did park closures and airport shakeups impact crowds in the parks in the past week? And what can we expect…
-

Happy November! This change of month means that it is officially holiday season at Walt Disney World. Decorations are up, the…
-

New blog series, who dis? We know that you come to TouringPlans because of all of our data. And other than…
That header photo is so freakin cute.
Thanks Andy! One of my all-time favorite Disney photos.
I want to comment on Touring Plans new Format, and I am not sure if this is the place to do it or not, but your new format for the Crowd Calendar is terrible. Much more difficult to navigate. Where can you find Historical crowds and if you want to do a personalized Touring Plan you have to go through more steps than before.
Hi John! I wasn’t involved in the redesign, but I appreciate what you’re saying. I will pass it along to that team.
Hi John, thanks for the feedback. The new redesign is attempting to resolve some common complaints we get about the calendar, but of course we’d like that to mean better for everybody. Your comments are important to helping us evaluate that. Becky has already passed this along to the team, but here is a link to a historical day. If you bookmark this, you’ll be able to get to the Historical Crowds – they’re still there, just without direct links from the calendar.
https://touringplans.com/walt-disney-world/crowd-calendar/date/2023-01-18
Another way is to track one day and then access the Crowd Tracker from the bottom of your dashboard. At this time, the crowd tracker is still the same format as the old calendar and you can navigate the historical crowds from there.
Thanks again for taking the time to write.
On Saturday 2/4, Sunday 2/5 was looking like a washout. Even at midnight when I went to bed it was still looking like a washout. I made a reservation for HS around midnight. Seeing as MK has the most attractions total and the most outdoor attractions that will close for rain, I think that’s a pretty good reason why MK was slow on Sunday. Granted, by 7 am the rain had pushed back to mid afternoon and continued to push back all day, but it did look nasty just a few hours before. With the cooler/wetter day on Friday I’m sure lots of folks didn’t want to repeat that again so soon.
Thanks for the insight, CJ! I saw the actual weather, and didn’t know how it developed through the night/day. That makes more sense now.