Disney Data Dump July 5 2023
Usually I use this intro to write a few clever lines about the current season, and then tease the fact that you need to actually read the article to get the data you need. But sometimes … sometimes the data just yells in your face. And this is one of those weeks. What is the data yelling? THE CROWDS DON’T EXIST. The crowd levels over July 4th weekend looked more like September crowds. This should have been one of the busiest weeks of the year, and instead it looks like early May or mid-September. That’s great news for all of us who have upcoming trips planned, and terrible news for Disney.
Observed Crowd Levels June 27 – July 3

What. The. Heck. Okay, we’re calling it now. This is not normal. These are not peak summer crowds. These are shockingly low crowds. Yes, the weather was brutal. And that means smart locals probably stayed home. But there should be so, so many families travelling to Orlando in July. It seems as if at least 75% of families fled the STL area in the past week. But I guess they weren’t going to Walt Disney World. So if you’re in Orlando, enjoy the heat and empty parks. If you aren’t in Orlando … maybe plan a Disney trip. Because the parks aren’t going to be crowded any time soon. More on that later.

This is madness in a chart. We have a park at a crowd level 8 and a park at crowd level 1 just three days apart. We almost never see that, outside of party season at Magic Kingdom. And our roller coaster behavior that we’ve been seeing ever since late spring is a little bit muted – but only because that holiday Monday didn’t see the huge crowd peaks that our other Mondays have seen. Our big holiday weekend was empty. Almost empty. The crowds on July 1st and 2nd look more like Labor Day than July 4th. This is absolutely crazy.
Performance of Crowd Level Predictions
Each week, I’m giving you a very transparent look into how our crowd level predictions performed. Each day at each park is one data point, so this week we have 28 different crowd level predictions to evaluate each week. Any time a prediction is within one or two crowd levels, things won’t really “feel” much different than what we predicted. Being off by 3 or more crowd levels is where we’d like to be more accurate because you might feel that difference in wait times throughout the day.

Remember last week when the long-awaited crowd calendar update took us from constantly underpredicting to something more even? Well, the crowds dropped even lower than the calendar update attempted to handle. Amazing.
In the past week, Touring Plans predictions were either spot-on or within 1 crowd level 25% of the time. Really really rock-bottom low. 79% of the time Touring Plans predictions were within 2 crowd levels, and that means we earn a C+ for our predictions this past week. The real problem is the skew back to overpredicting. In the past week, there was only one park-day underpredicted by 2 or more crowd levels. And there were 20 park-days that were overpredicted by 2 or more crowd levels. We’re overpredicting 20x more than underpredicting. Too skewed. That means that our calendar update already recognized the drop in crowds and adjusted for it … and then crowds dropped EVEN MORE. There were actually no huge misses in the past week – just a bunch of times crowds were overpredicted by 3 crowd levels.
Attraction Downtime June 27 – July 3
If we average out all of the capacity lost due to unexpected downtime over the past week, it comes out to 4.6% of attractions unexpectedly being down. Significantly up from the past two weeks. The park with the biggest issues was Magic Kingdom, with 5.1% of its capacity lost due to unexpected downtime. And EPCOT and Hollywood Studios weren’t too far behind. Animal Kingdom was most reliable this week!
The worst day for attraction downtime in the past week was on July 3rd. On that day, 7% of all capacity at WDW was lost due to unexpected downtime. The worst park-day of the week was at EPCOT on June 29th. On that park day, wait for it … 14% of the capacity at the park was lost due to unexpected downtime. EPCOT was open for 12 hours on the 29th, so 14% downtime is the equivalent of the whole park being down for over 100 minutes. Basically the whole park took a nap for an hour and 40 minutes. I mean, we all need naps. I get it. But pull yourself together, EPCOT.
Attraction Downtime Worst Offenders
The worst offender of the past week was Space Mountain, which was unexpectedly down for approximately 22% of the past week. The worst day for Space was on June 28th, when it was unexpectedly down for 30% of the day. But there were quite a few days where it was down 20% or more of the day. Not great for a big headliner at Magic Kingdom. Thankfully … the park apparently didn’t need the capacity anyway.

Rope Drop Downtime
Here are this week’s problematic offenders:
- Magic Kingdom: Big Thunder Mountain Railroad (unavailable for 25% of its first hour of the day), TTA PeopleMover (unavailable for 22% of its first hour of the day), Seven Dwarfs Mine Train (unavailable for 14% of its first hour of the day)
- EPCOT: Gran Fiesta Tour (unavailable for 16% of its first hour of the day), The Seas (unavailable for 15% of its first hour of the day)
- Hollywood Studios: Rise of the Resistance (unavailable for 38% of its first hour of the day), Rock’n’Roller Coaster (unavailable for 21% of its first hour of the day)
- Animal Kingdom: No rope drop downtime issues!
Rise of the Resistance. Seriously. almost 40% of the first hour of the day. That’s a serious blow to a smart rope-drop plan at Hollywood Studios, where a good early entry plan can make all of the difference in your day. Thankfully EPCOT and Animal Kingdom had better weeks. But Magic Kingdom had its own issues with two major headliners seeing some serious rope drop downtime.

Wait Times June 27 – July 3
Attractions with the Highest Average Posted Wait at each park
- Hollywood Studios: Slinky Dog Dash, average posted wait of 96 minutes (92 minutes last week)
- Animal Kingdom: Flight of Passage, average posted wait time of 84 minutes (101 minutes last week)
- Magic Kingdom: Seven Dwarfs Mine Train, average posted wait time of 80 minutes (84 minutes last week)
- EPCOT: Frozen Ever After, average posted wait time of 58 minutes (69 minutes last week)
Check out those wild holiday weekend crowds … or not. Every super headliner, other than Slinky Dog Dash, saw decreased posted wait times compared to last week. And last week’s posted wait times weren’t even that high. We especially see this at EPCOT, where the average wait time of the most popular attraction didn’t even break an hour.
Parks with the Highest and Lowest Average Wait
These parks likely won’t change week-to-week unless something ridiculous happens, but these data points will give us a high-level view of how wait times are trending from week to week.
- Highest: Hollywood Studios, average park-wide posted wait of 39 minutes (43 minutes last week)
- Lowest: EPCOT, average park-wide posted wait of 23 minutes (27 minutes last week)
A 4 minute drop in average posted wait time at each attraction for both the highest and lowest parks is next level bonkers for the weekend leading up to July 4th. It probably doesn’t seem like much, but 1) wait times shouldn’t be dropping at all and 2) it’s definitely significant across the course of a day or a week-long vacation.
Most Inflated Posted Wait Times
We all know that Disney inflates their posted wait times on purpose. They have many reasons for doing this. Some are totally understandable, and some are potentially more problematic. We can figure out how much posted wait times are being inflated by comparing submitted actual wait times from the Lines App and the posted wait time when the person timing their wait entered the line.
Over the past week, actual wait times in the Lines App averaged 62% of what was posted. This is slightly below our historical average, which means wait times are more inflated than usual. If the posted wait time was 60 minutes, you could’ve expected to wait over 37 minutes instead.
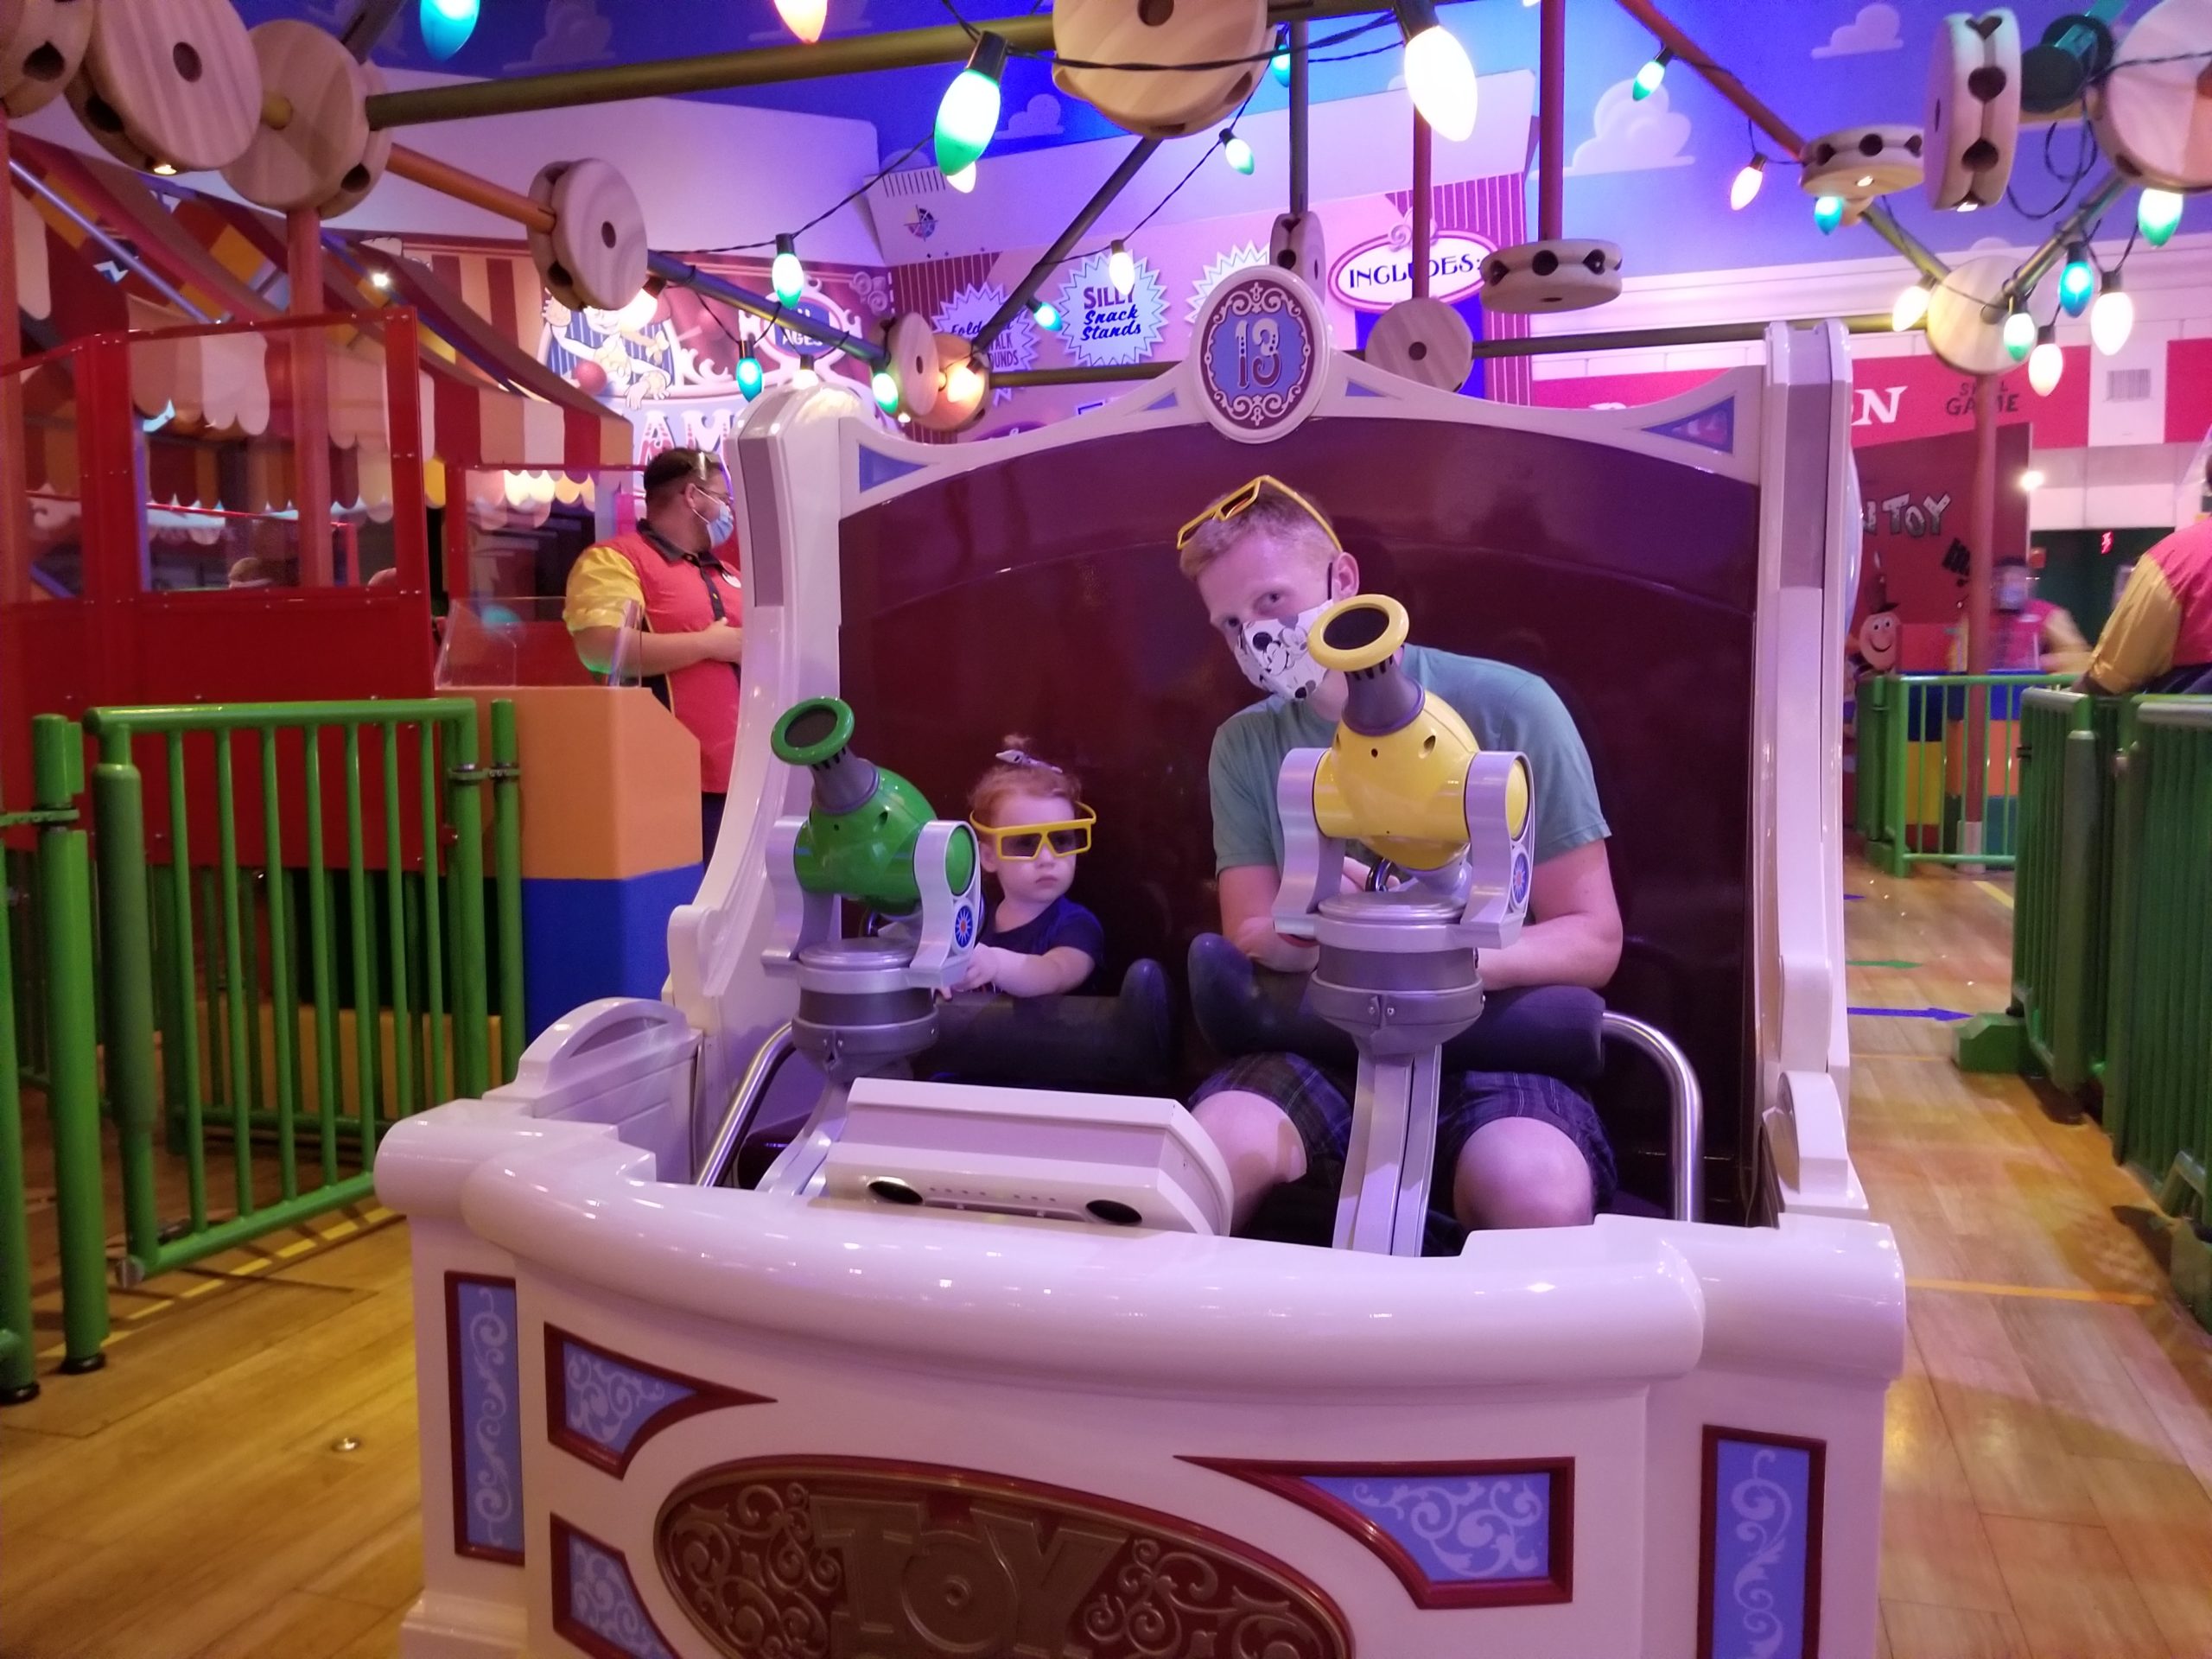
But the worst offender for the past week is Toy Story Mania! At this one attraction, submitted actual wait times were 48% of posted wait times in the past week. That means that if Toy Story Mania had a 60 minute posted wait, you probably would’ve waited less than 29 minutes instead. About half of what was posted. Remember to always check the Lines app for predicted actual waits instead of believing what is posted.
Actual Wait Time Rock Star
The Actual Wait Time Rock Star for the past week was … smayer, who submitted 23 actual wait times through the Lines App over the last 7 days! This includes 1 Lightning Lane wait and 22 Standby waits. Thank you for all of that timing, smayer! You came pretty close to the all-time record of 50 recorded wait times in a single week, currently held by shop.kgb and ccsademko.
In the upcoming week, keep timing those opening hour waits for us! The closer to rope drop, the better.
Looking Ahead: July 4 – July 10
Let’s face it. If this weekend didn’t turn crowds around at Walt Disney World … crowds aren’t going to turn around. Our recent crowd calendar update adjusted predictions down in line with what has been happening for the past couple of months. But even the downward adjustments couldn’t compensate for all of the people that neglected to appear for the normally packed holiday weekend.
All signs point to this continuing in the short and long term. How do I know? In the short term, it looks like the next week will be a hot and stormy one. More locals will choose to stay home. And if all of the vacationing families didn’t show up this week, there’s no reason to expect them to travel to Orlando next week.
As we look forward to the fall and the remainder of 2023, deals are plentiful. That’s not because Disney is feeling generous. That’s because bookings are low and Disney is scrambling to lure people to the parks. Between now and the start of the party season, I fully expect weekends to continue to be relative ghost towns. Prioritize Hollywood Studios and Magic Kingdom on those days. Avoid Magic Kingdom on Mondays. But otherwise … enjoy your uncrowded parks.
And if we peer even further into 2024, it’s not hard to read between the lines and see that Disney expects low crowds. They brought the Dining Plan back to earn themselves more money and create more demand for table service dining. They rolled back the unpopular park reservation requirements. And, perhaps most importantly, bounceback offers are back that deeply discount 2024 vacations for people that are visiting in 2023. We haven’t seen bounceback offers since before the pandemic, and the ones popping up now are better than what we saw in 2019. Better deals are rare. And it shows just how many mountains Disney is trying to move to get people to visit and come back.
Welcome to the post-revenge-travel era, folks. I hope we all can take advantage of all of the deals heading our way!
You May Also Like...
-

Anyone else feel like you can finally breathe a sigh of relief now that the school year is over with all…
-

In the world of Disney Data, this week was all good news. Wait times were the lowest we've seen since mid-September…
-

Just when you think we've made it through Spring Break season! The weather is getting warmer. The kids are getting antsy…
-

Anyone else ready for summer? If nothing else, we need something to shake up these Disney Data Dumps that have become…
Give out free tickets to families or a group of 10-20 then let them. Buy something in the park. With discount of foods and drinks
I was at Epcot on 6/30 and 7/1. The “observable crowd” was not appreciable different in any way. With regard to wait times, I think the thing largely being overlooked is that I suspect there was an algorithmic change to the standby/LL ratios. They do that sometimes, and if you’re using wait times as a proxy to crowd size, that’s a flaw.
This is not to go political but Disney has scared many families away, I find no other consistent explanation for surprisingly low crowds while other destinations are full. People who sought the Disney bubble now feel they have to watch what their children may be exposed to and aren’t willing to spend big vacation dollars, people are tempted to overpay for the dining plan just to have some control of the extra costs, just to feel like they are being lectured. Then having to be on their phone the whole time with Genie+ (may not be necessary with these crowds) can add more stress. It is unfortunate, we went annually for 13 years but haven’t been tempted to return since our late 2020 trip. Liked not having to get a car, arrange for airport transportation, planning was simple with Fastpass+ and feeling like I could enjoy myself while my teenager enjoyed the search for new Fastpasses.
It is certainly easy to put a political narrative on this, but we aren’t actually finding the numbers supporting that story – or that other destinations are “full”. Universal and Disneyland are also seeing significantly lower crowds right now than we would expect based on history and the last couple of years. And our reporters in the parks aren’t seeing a lot of intrusion into the “bubble” either. To the extent that WDW is seeing a slightly bigger drop than UOR and DLR, we think it’s probably what you cite in the second half of your comment – increased costs and complexity that have exceeded visitors’ tolerance for vacation planning.
Becky – Thanks. I wasn’t actually thinking other Themeparks so much as the difficulty we have had finding good reservations in the national parks but I would agree that if UOR is seeing a big downturn as well that would point to other causes. In general, does a downturn at WDW impact UOR as in people going to UOR for part of their WDW trip versus planning a separate trip only for UOR? Just curious as to how much of UOR’s attendance has been from folks traveling to WDW in the past, I appreciate your thoughts.