
Disney Data Dump May 17 2023
Say it with me! Walt Disney World is totally empty right now. Okay, not totally. But none of us are surprised by now about the lower-than-originally-expected crowds. We had multiple popular lightning lanes not sell out at all this week. Afternoon virtual queues for Cosmic Rewind and Tron stayed open for hours and hours. We saw a crowd level 1 park-day! And Disney is seeing the same slowdown and offering bunches of new deals and “improvements to guest experience”. Now, I love Disney. But we all know they don’t do anything out of the kindness of their hearts. They offer deals when demand gets soft. And demand is currently the consistency of marshmallow fluff. Keep those deals coming.
Observed Crowd Levels 5/9 – 5/15

Hold. The. Phone. Who fast-forwarded to September? This is complete and utter nonsense. Never have I ever seen an all-green crowd level summary since the week of Labor Day. In fact, the average crowd level in the past 7 days was 2.85. The all-time low since the beginning of 2022 was the week after Labor Day, when the average was 2.71. Total chaos, and what a blessing for all of you that are able to travel right now. I will keep my jealousy contained. For now.
If we dig a little deeper and look at the park-by-park numbers, we see some even more crazy trends:
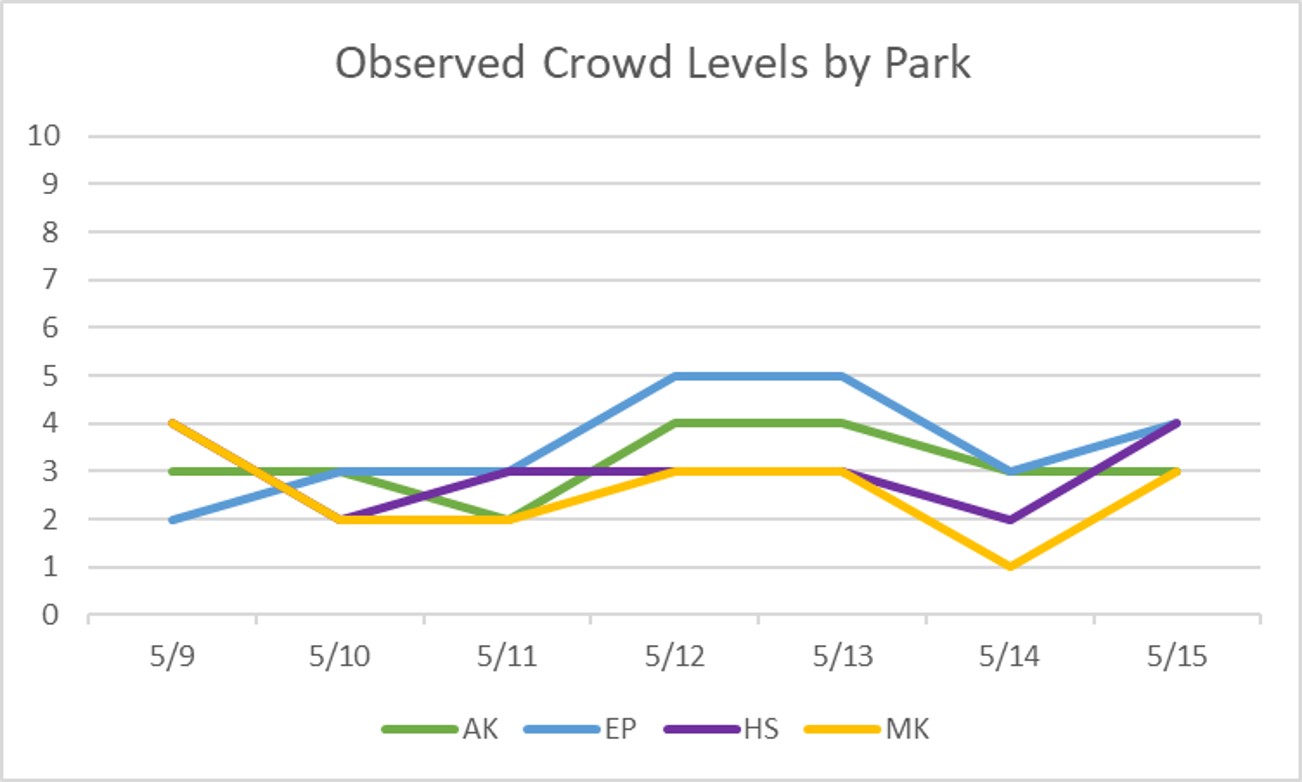
Friends. Only one park even hit a 5 at all this week, and that park was EPCOT. EPCOT! Hollywood Studios was at a 3 or lower other than the 9th and 15th. For four days of the past week, EPCOT and Animal Kingdom were relatively more crowded than Hollywood Studios. We are officially in upside-down crazy-bonkers times. That’s the only explanation.

Each week, I’m giving you a very transparent look into how our crowd level predictions performed. Each day at each park is one data point, so this week we have 28 different crowd level predictions to evaluate each week. Any time a prediction is within one or two crowd levels, things won’t really “feel” much different than what we predicted. Being off by 3 or more crowd levels is where we’d like to be more accurate because you might feel that difference in wait times throughout the day.
This is ugly. I’m not going to sugar-coat it. In upside-down crazy-bonkers times, predictions get ugly. In the past week, Touring Plans predictions were either spot-on or within 1 crowd level 21% of the time. That’s a new all-time low (imagine a gif of Jean-Ralphio singing “the woooorrrrrrrrrrst” right here). 53% of the time Touring Plans predictions were within 2 crowd levels, and that means we earn a F for our predictions this past week. Another all-time low. Predictions were, once again (broken record), just about as skewed as possible this week. Even every single “within 1 crowd level” prediction this week overpredicted the crowds by one crowd level. We had not a single-park day that was estimated exactly correctly or under-estimated. 100% over-estimated. The biggest misses of the past week over-predicted crowds by 5 crowd levels. That happened on three different days each at a different park. And there were a bunch for 4-crowd-level misses too.
Attraction Downtime 5/9 – 5/15
If we average out all of the capacity lost due to unexpected downtime over the past two weeks, it comes out to 3.9% of attractions unexpectedly being down. This is a little bit of an uptick from last week – we’ll keep an eye on if that trend continues. The park with the biggest issues was Magic Kingdom, with 5.6% of its capacity lost due to unexpected downtime.
The worst day for attraction downtime in the past week was on May 11th. On that day, 7% of all capacity at WDW was lost due to unexpected downtime. The worst park-day of the week was at Magic Kingdom on May 12th. On that park day, 10% of the capacity at the park was lost due to unexpected downtime. Magic Kingdom was open for 14 hours on the 12th, so 10% downtime is the equivalent of the whole park being down for almost an hour and a half.
Attraction Downtime
The worst offender of the past week is … (any guesses? any guesses?) … the Magic Carpets of Aladdin, which was unexpectedly down for approximately 58% of the past week. This is the third win in a row for the Carpets, after 38% downtime the last two weeks. The worst day for our the Carpets was on May 9th, when it was unexpectedly down for 87% of the day. And this was closely followed by four other days with downtime in the 70-75% range. I’m telling you people, something is up with the camels. They’re stomping on the carpets or something.

Rope Drop Downtime
Here are this week’s problematic offenders:
- Magic Kingdom: TTA PeopleMover (unavailable for 34% of its first hour of the day), Magic Carpets of Aladdin (unavailable for 28% of its first hour of the day), Pirates of the Caribbean (unavailable for 28% of its first hour of the day), Space Mountain (unavailable for 17% of its first hour of the day)
- EPCOT: Spaceship Earth (unavailable for 28% of its first hour of the day)
- Hollywood Studios: Rise of the Resistance (unavailable for 46% of its first hour of the day), Millennium Falcon (unavailable for 21% of its first hour of the day)
- Animal Kingdom: TriceraTop Spin (unavailable for 14% of its first hour of the day)
Rise! How could you do us like that?! Down almost half of the first hour of the day. And then Falcon playing right along and being down too. That’s just rude. Thankfully, the parks have been uncrowded enough that maybe it doesn’t matter as much. Maybe. Magic Kingdom is seeing some big issues too, in Adventureland and Tomorrowland, which are excellent regular-rope-drop options.

Wait Times 5/9 – 5/15
Attractions with the Highest Average Posted Wait at each park
- Hollywood Studios: Slinky Dog Dash, average posted wait of 60 minutes (70 minutes last week)
- Animal Kingdom: Flight of Passage, average posted wait time of 68 minutes (81 minutes last week)
- EPCOT: Frozen Ever After, average posted wait time of 56 minutes (59 minutes last week)
- Magic Kingdom: Seven Dwarfs Mine Train, average posted wait time of 62 minutes (66 minutes last week)
Yes yes yes, the weirdness continues. The weirdness is becoming less weird and more expected at this point. So in the past 7 days, the average posted wait time at Seven Dwarfs Mine Train has been higher than Slinky Dog Dash. You heard that right. Slinky had an average posted wait time of an hour. So you know the actual waits were less than that.

Parks with the Highest and Lowest Average Wait
These parks likely won’t change week-to-week unless something ridiculous happens, but these data points will give us a high-level view of how wait times are trending from week to week.
- Highest: Hollywood Studios, average park-wide posted wait of 30 minutes (34 minutes last week)
- Lowest: EPCOT, average park-wide posted wait of 20.5 minutes (22 minutes last week)
Hollywood Studios is continuing to have amazingly low average waits, breaking that 30 minute mark for the first time in … a very long time. And EPCOT saw its already crazy-low waits go even more crazy-lower this week, mostly thanks to continued decreases at Remy and Test Track.
Most Inflated Posted Wait Times
We all know that Disney inflates their posted wait times on purpose. They have many reasons for doing this. Some are totally understandable, and some are potentially more problematic. We can figure out how much posted wait times are being inflated by comparing submitted actual wait times from the Lines App and the posted wait time when the person timing their wait entered the line.
Over the past week, actual wait times in the Lines App averaged 61% of what was posted. This is much lower than our historical average, which means posted wait times are more inflated than normal. So those low wait times … are actually much lower because the posted wait times are more inflated than usual! If the posted wait time was 60 minutes, you could’ve expected to wait under 37 minutes instead.
But the worst offender for the past week is Peter Pan’s Flight. It’s back in the drivers seat, y’all! At this one attraction, submitted actual wait times were 38% of posted wait times in the past week. Ope! That means that if Peter Pan’s Flight had a 60 minute posted wait, you probably would’ve waited under 23 minutes. Much, much less than half of what was posted. Remember to always check the Lines app for predicted actual waits instead of believing what is posted.

Actual Wait Time Rock Star
The Actual Wait Time Rock Star for the past week was … ccsademko, who wasn’t messing around last week and submitted 50 actual wait times through the Lines App over the last 7 days! (That makes 96 timed waits over the past 14 days). This includes 25 Lightning Lane waits, 23 Standby waits, and 2 virtual queue waits. Thank you for all of that timing, ccsademko! You get to co-claim the all-time record, which was originally set by shop.kgb. Woohoo!!!!
In the upcoming week, wait times for virtual queues, especially at TRON, would be very very helpful for us.
Looking Ahead: May 16th through May 22nd
Like I called out at the beginning of this post, Disney releasing a large number of deals and “guest experience improvements” means that demand has to be really really low for the summer. Really low. So even when schools start to release kids to their summer vacations, we probably won’t see a huge bounce-back in the crowds levels from our current near-rock-bottom.
Anyway – while some colleges are already done for the summer, many public schools still stay in session through the end of the month. I expect to begin to see some real movement in crowd levels the weekend of Memorial Day … but until then, it’s all blue skies and sunshine and rainbows. Enjoy it if you’re there in the upcoming week. Bring me with you, please.
You May Also Like...
-

In the world of Disney Data, this week was all good news. Wait times were the lowest we've seen since mid-September…
-

Just when you think we've made it through Spring Break season! The weather is getting warmer. The kids are getting antsy…
-

What a busy week we've all had! May the Fourth, Cinco de Mayo, Revenge of the Fifth. Also important holidays like…
-

We're officially in the period of the calm before all of the Spring Breaks. Since Easter is in April this year,…
Because it was soooo busy the last times we’ve been we had decided to give Florida a miss for a while – there’s also the politics around it at the moment that makes us unsure what us going to happen. We wondered if everyone who had missed WDW during the pandemic were rushing to get their Disney fix – and now that a lot of people who wanted to visit have managed to, the crowd numbers gave died down. I also wonder, now it’s been announced that the Star Wars hotel is due to close in September, whether there might be a bit if a rush for Star Wars enthusiasts to experience this experience before it disappears.
I was there May 13-May 16. Waits were super low. I only bought G+ for MK on the 13th since we wouldn’t arrive at the park until about 11:30 and for DHS on May 15. From 9:00AM until 6:00pm, we were able to ride every attraction in DHS with back to back LLs, had time to eat at Sci Fi for lunch and Woody’s lunchbox for breakfast, meet Woody, Jessie, Buzz, Frozone, Mr. and Mrs. Incredible, Edna Mode, and Sully, see Frozen Sing Along, Muppets, Beauty and the Beast, and the Vacation movie–all before 6:00. We did have an ILL for Rise. We had accomplished so much that we were able to take a 2 hour break in the room. From 8:00pm until park closed, we ate dinner at Woodys, rode TSMM and MMRR again and then had an after park closed Oga’s at 10:30. Wait times at 9:05pm were 10 minutes for Rise, Smugglers Run, TSMM and 15 for ToT.
Epcot (5/14) and AK (5/16) were easily done without G+.
Perfect, perfect, quick 4 day, 4 park trip.
This sounds AMAZING. So glad you had a great trip, and thank you for making me incredibly jealous.
Just got back from WDW (5/14-5/16). Brought our grandson on his first trip to Disney. The unexpectedly low crowds (based on projections) was definitely a ‘good-news / bad-news’ situation. I planned the heck out of the trip and gave Disney waaaay more money than I wanted (3 * Genie+ & 1 ILL), plus rope dropped every day, but none of that was really needed. Given that the crowd levels have been low for a fairly long time, are the models / algorithms being adjusted? Or is more data needed?
Hi PauandCarrie, glad your trip went well and you experienced lower than expected crowds. This trend is strong and seems to be persistent. Whether it continues into June, July and August remains to be seen. Our current updates (we update our attraction forecasts daily but only update the Calendar every few months) show that the slowdown will likely cause a drop in crowd level of a point or a two across the board. We plan to push that update sometime in the next few weeks.
Is it possible Disney is purposely keeping Magic Carpets closed since there are so few people in the MK as of late to cut down on staff?
Theory: Are politics leading people to not want to visit Disney or the state of Florida?
My theory is that Universal is actually the reason. With Universal opening an entire new park in 2025 (and they are also running ticket specials) that vacationers are holding off until then.
These are both interesting hypotheses, but actually if you look at the travel industry as a whole, things are very slow right now thanks to the potential economic slowdown. That extraneous expenditure is one of the first things to get cut. Expensive vacations like Disney are being harder hit, but it’s not just a Florida thing or a Disney thing.
Becky, if it’s true this isn’t a Florida-specific consideration, I think that merits its own blog post. Most of my friends feel unsafe traveling to Florida now that health care workers are permitted to refuse to treat us for virtually any perception we may belong to a group they disapprove of. True, there may be other considerations (Hippocratic Oath, Disney’s liability risk management) but the new has removed the legal safety net guaranteeing even emergency care. So if my anecdotal sense that fewer LGBTQ folks will travel to FL is confirmation bias or otherwise not supported by data, I really would like to see data-based analysis of that. I’m a big fan of your data science presentations, so this is a sincere wish, not a snarky comment. And second comment/question: how do you adjust your projections for external factors like an economic downturn or Disney price increases, on top of the calendar-based factors? I think that’s another fascinating potential post. Thanks!
Becky, if it’s true this isn’t a Florida-specific consideration, I think that merits its own blog post. Most of my friends feel unsafe traveling to Florida now that health care workers are permitted to refuse to treat us for virtually any perception we may belong to a group they disapprove of. True, there may be other considerations (Hippocratic Oath, Disney’s liability risk management) but the new law has removed the legal safety net guaranteeing even emergency care. So if my anecdotal sense that fewer LGBTQ folks will travel to FL is confirmation bias or otherwise not supported by data, I really would like to see data-based analysis of that. I’m a big fan of your data science presentations, so this is a sincere wish, not a snarky comment. And second comment/question: how do you adjust your projections for external factors like an economic downturn or Disney price increases, on top of the calendar-based factors? I think that’s another fascinating potential post. Thanks!