Disney & Universal Crowd Calendar Updates for Feb 10 – Mar 31, 2026
We’ve updated our crowd calendar predictions for Walt Disney World, Disneyland, and Universal Orlando for February 10 through March 31, 2026. Below is a summary of the changes, the reasons behind the changes, and some observations we’ve seen in the parks so far this year that will affect how long you’re standing in lines.
As a reminder, our crowd levels are based on the average wait times you see posted on each ride’s Standby (i.e., normal) line entrances during mid-day. So if we were over-predicting crowds, that also means we were overestimating wait times in lines.
Our next crowd calendar update should be mid-March, assuming we don’t get any big news between now and then.
Walt Disney World Crowd Calendar Updates
Most of the Walt Disney World crowd adjustments were to lower crowd levels:
- The average Magic Kingdom crowd level is reduced by 1.7 points
- EPCOT’s average crowd levels are reduced by 0.9 points
- Hollywood Studios’ average crowd levels are reduced by 1.9 points
- Animal Kingdom’s average crowd levels are reduced by 1 point
As of this Monday we’d over-predicted crowds at Animal Kingdom and Hollywood Studios for 29 of the past 30 days. We’ve over-predicted crowds at Magic Kingdom for 27 of the past 30 days, and EPCOT for 24. We could’ve adjusted to that amount of over-prediction sooner.
I don’t think these lower crowd levels and wait times are related to large drops in attendance. Disney’s quarterly earnings call this week noted a 1% year-over-year increase in domestic park attendance for October through December, 2025. However, the same period in 2024 was affected for 3 to 5 days by Hurricane Milton, which decreased attendance in Walt Disney World. So it’s possible that without that 2025 hurricane that 2025’s attendance numbers would’ve been flat or down slightly.
We also know from the earnings call before this one that Disney’s domestic park attendance was down 1% for fiscal year 2025. But a tiny drop in attendance doesn’t explain the drop in wait times we’re seeing. So I suspect it’s a combination of three things we’ve mentioned before:
- The change in DAS eligibility has removed a large number of guests from the Lightning Lane lines. This makes the Standby wait times lower. We saw these effects as early as Christmas 2024.
- Around April of 2025, Disney modified the ratio of Lightning Lane guests to Standby guests at the merge point to more favorable treatment of Standby guests. This also reduced wait times for Standby guests.
- There’s some evidence – and this is really preliminary analysis – that Disney’s trying to make the posted wait time the “average” wait time at certain attractions, so that half the people in line will wait less than that number, and half will wait more.
Here’s an example for that last point. Since the DAS changeover in mid-2024 we’ve got 2,505 actual wait times at the Magic Kingdom’s Tron Lightcycle/Run, from users who’ve timed their wait in line using our Lines app.
One way to analyze those actual wait times is to compare them to Disney’s posted wait time. The graph below does this.
The graph’s x-axis is the number of minutes the Magic Kingdom has been open. This normalizes the data across days where the Magic Kingdom has different opening times. So if the park opens at 8:30 a.m. or 9:00 a.m., we can still ask “What’s the actual wait time like at 15 minutes after the park is open?”
The graph’s y-axis is the average of the actual wait times we’ve received, divided by the posted wait shown on TRON’s entrance at the moment our user got in line. So if the sign said the wait was 100 minutes when our user got in line, and the user actually waited 80 minutes to ride, then the actual-to-posted ratio is 80 / 100 = 0.8. For simplicity we’ll call this “the ratio.”
The dashed, horizontal blue line is a ratio of 1.0. If every dot was on that line it would mean that everyone’s actual wait was EXACTLY the posted wait on the sign in front of the ride.
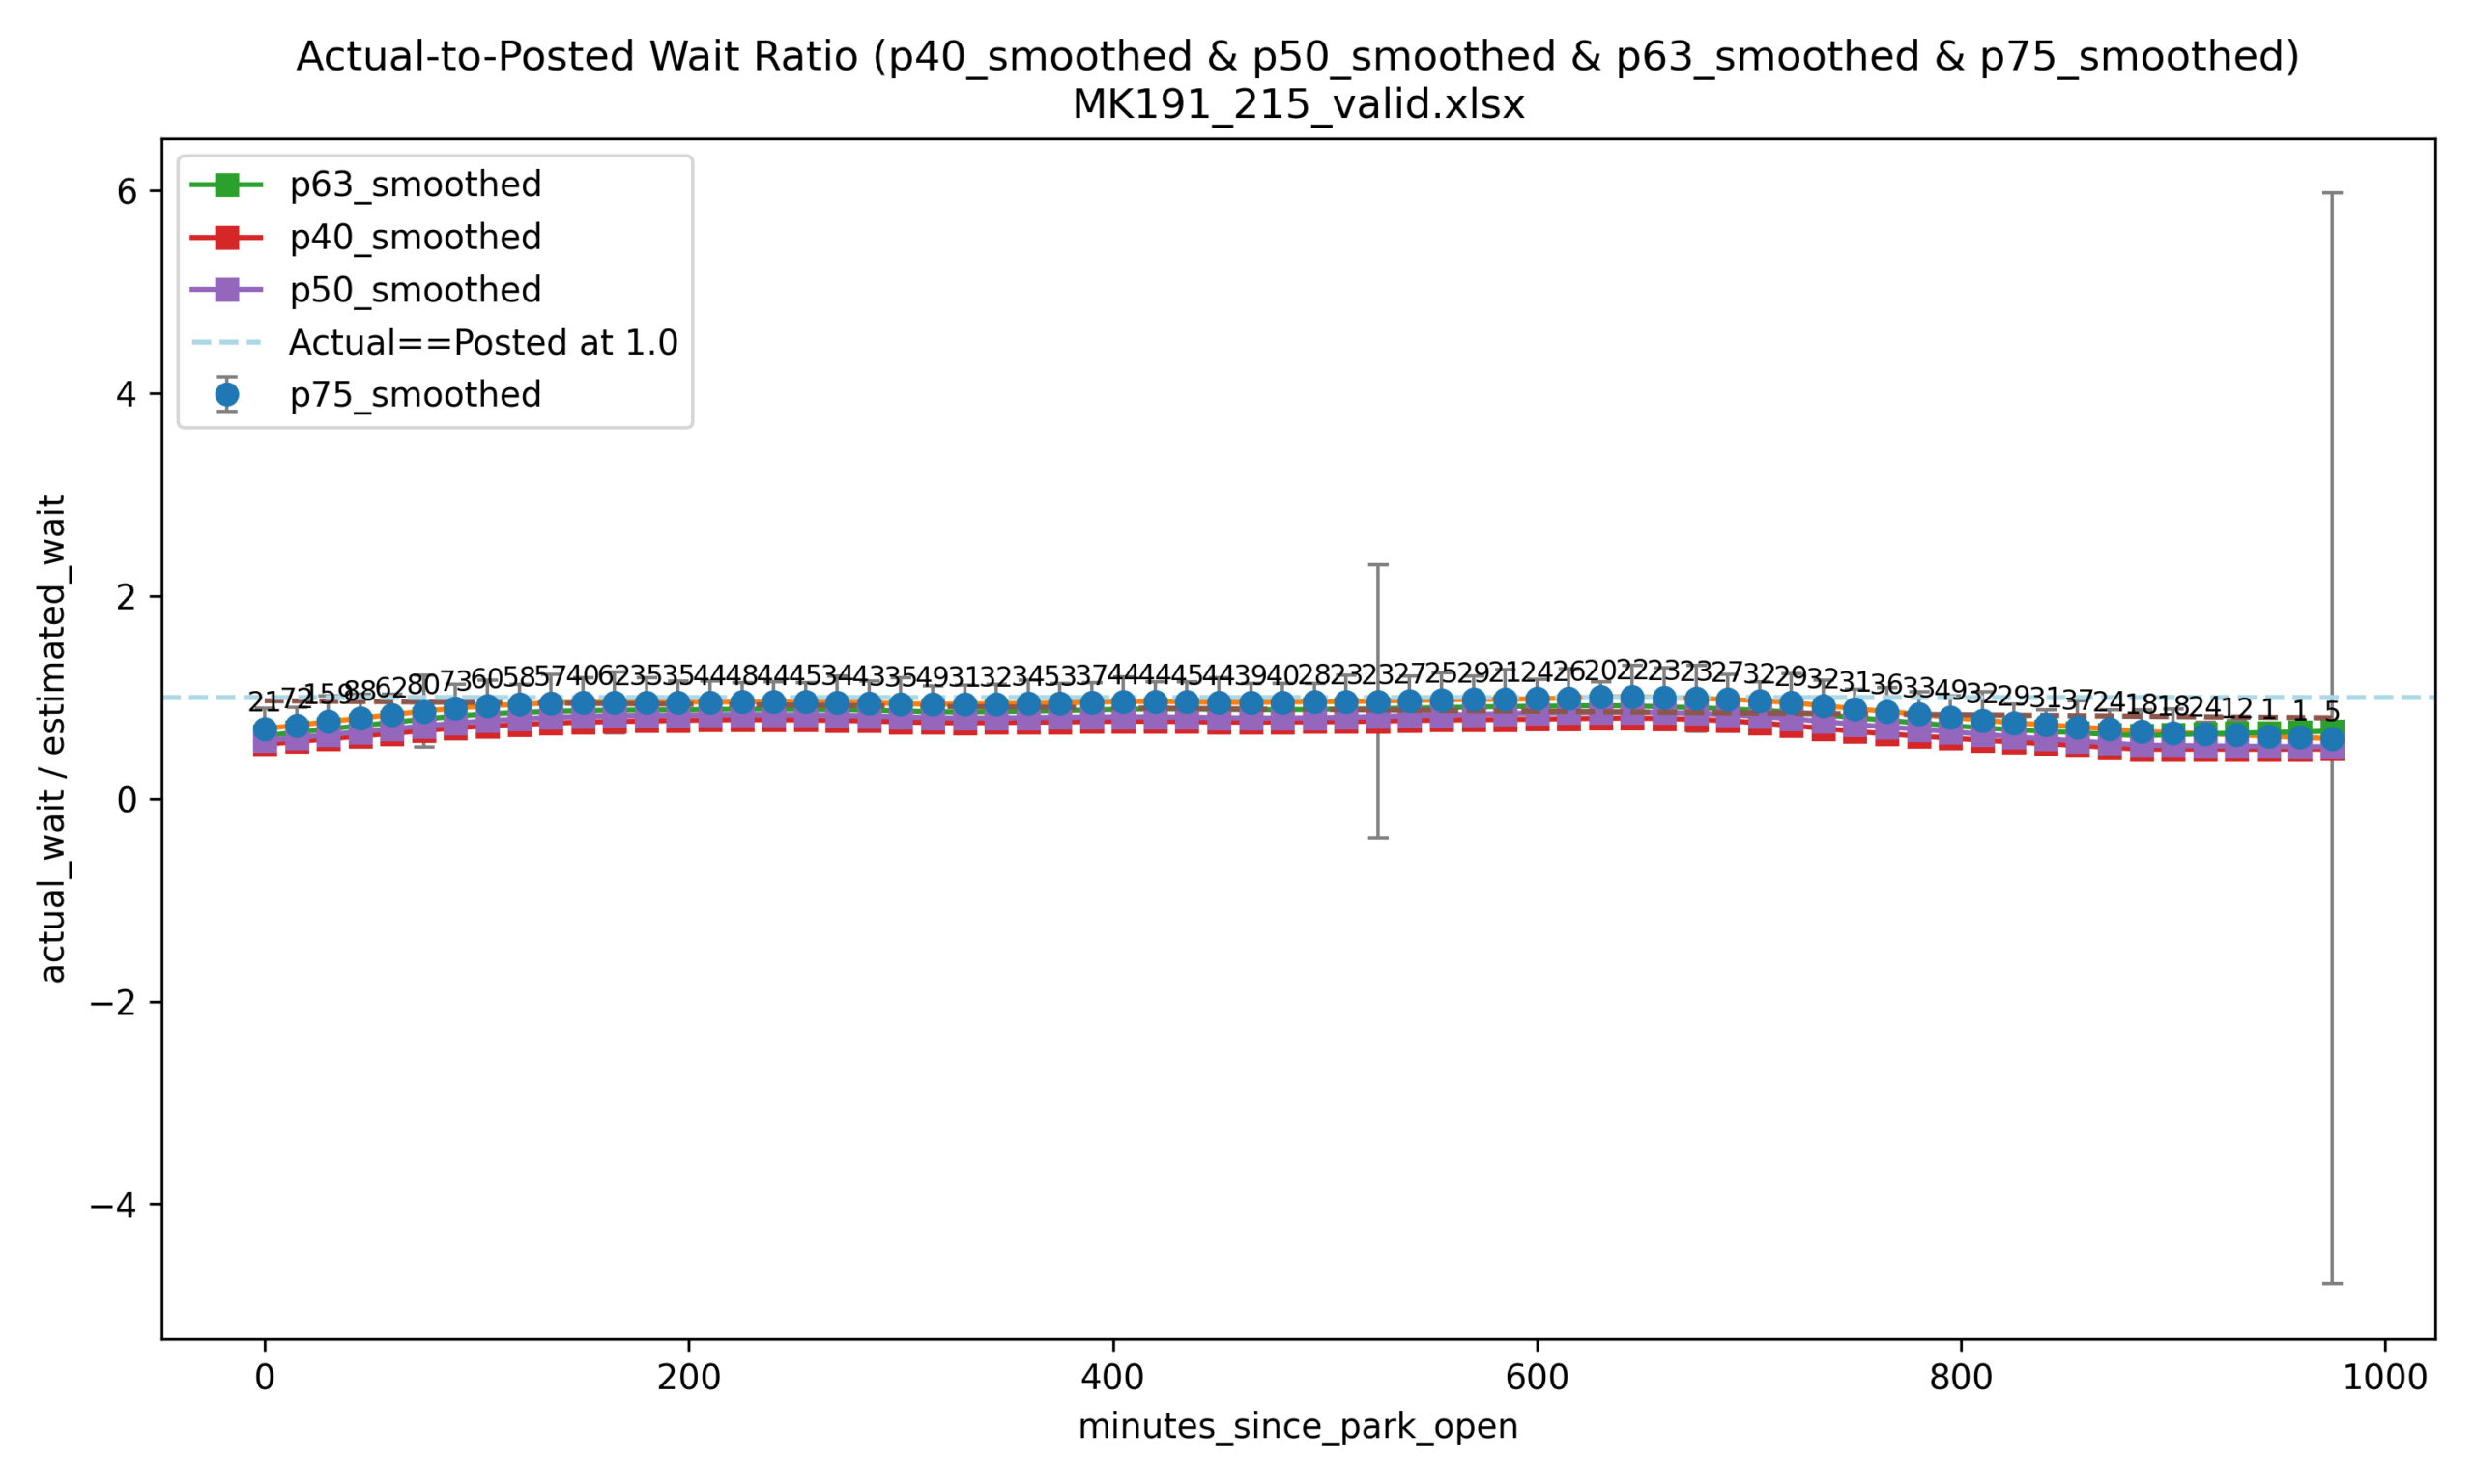 The other colored lines represent the 40th percentile of those ratios: 40% of the actual waits we get are below the red squares, and 60% are above them. Likewise, the blue dots are the 75th percentile: 75% of actual waits we get are below those blue dots. (The number above the blue dot is how many actual wait times we have from that specific time of day; there are a lot of them.)
There are other lines for the 50th and 63rd percentiles all smooshed in there.
The important things to note are:
- These lines are all really close together
- They all track the 1.0 ratio line really well
So this graph seems to indicate that most people who get in the Standby line at TRON Lightcycle/Run are probably waiting roughly the time shown on the sign outside the ride.
That’s not true at every ride, and it’s not true at every time of day. But it might be consistent across attractions that offer Lightning Lane Single Pass, for example. I suspect this is intentional, so that Disney isn’t accused of artificially inflating posted wait times to sell Lightning Lanes. (Which, for the record, I don’t think there’s any evidence of that happening. And I suspect the people I know in these areas would quit before doing something like that.)
Walt Disney World Crowd Notes
We still don’t know when Big Thunder Mountain or Buzz Lightyear Space Ranger Spin will re-open. I expect the days around those openings to be slightly busier than they would be otherwise. We’ll update the calendar when we know those dates.
Disneyland Crowd Calendar Updates
Average Disneyland crowd levels stayed mostly the same with this update. We’ve over-predicted Disneyland’s crowd level for 22 of the past 30 days, and 7 for California Adventure. Many of those overpredictions were on very slow days in January – we’re doing better on medium- and high-crowd days. Abd the second half of February has Presidents Day, and March has Spring Break, which are busier.
Universal Orlando Crowd Calendar Updates
The big update with the Universal Crowd Calendar update is to increase estimated crowd levels at Epic Universe. We’ve underestimated crowds at Epic for 25 of the last 30 days, by fairly wide margins. This adjustment takes that into account.
A couple of things to note about Epic Universe. Comcast’s last earnings call mentioned longer visits and higher spending because of Epic Universe. Just eyeballing the survey data we have, I suspect guests who visit Epic Universe are spending more time in the park and spending more on food and merchandise as well. They have some ride reliability and capacity issues to work through, to be sure, but Epic looks like a success at this point.
Our estimates for Universal Studios Florida and Islands of Adventure have been decent recently, so changes there should be relatively minor.
Universal Orlando Crowd Notes
Based on the actual waits we’re collecting from people in lines at Epic Universe, it looks like the park is prioritizing low waits for guests who purchase Express Pass. That means that guests who use the Standby line will wait longer when the Express Pass line is backed up.
Express Pass is expensive, but I think you can make a case for it at Epic Universe, and not just because of the priority it gets you in line. As I mentioned above, ride reliability is still an issue for many attractions in Epic. And I suspect the park’s most popular ride, Harry Potter and the Battle at the Ministry, does not regularly run at full capacity. In this case I’d look at Express Pass as an insurance policy that gives you a good chance of seeing everything in the park with low waits in line.
On a recent walk through the parks, I noticed new technology installed in some standby lines around the parks. This might be Universal installing a new system for estimating waits in line based on crowd density. And that might affect the ratio of standby wait to posted wait time. We’re keeping an eye on it.
You May Also Like...
-

Universal Orlando Crowd Calendar Update: What You Need to Know The Universal Orlando Crowd Calendar has been updated through the end…
-

Welcome to the fourth week of 2025, when we’re finally getting around to reviewing how our crowd calendar predictions performed for…
I think you need to adjust your y-axis range.
Good stuff as always, Len.
Have international guests begun their return to Orlando, or could that be another reason for lower crowds?