
The Wait Time Secret That Disney Won’t Tell You
We’ve gotten many variations of a single question (or complaint) recently, and they all go something like this: “I used Lines for my family’s day in the Magic Kingdom. It said that I should expect a 24 minute wait at Big Thunder Mountain, but I got there and the sign said it was going to be 60 minutes! I swear that TouringPlans used to get much closer to those waits, and now I’ve wasted hours of my vacation walking to rides that I expect to have short waits only to be turned off by the high wait times on the signs. I’m giving up.”
So what’s going on here? I’ll walk you through why the predicted time on your app looks so much different than the time on the sign. The reality is that if you can learn the secret behind Disney’s posted times, you can plan your day much more effectively. You can be a smarter WDW visitor, and take full advantage of TouringPlans’ predictions.
Explain the Math!
There are two very different kinds of wait times you’ll experience when you plan for and make a trip to Walt Disney World:
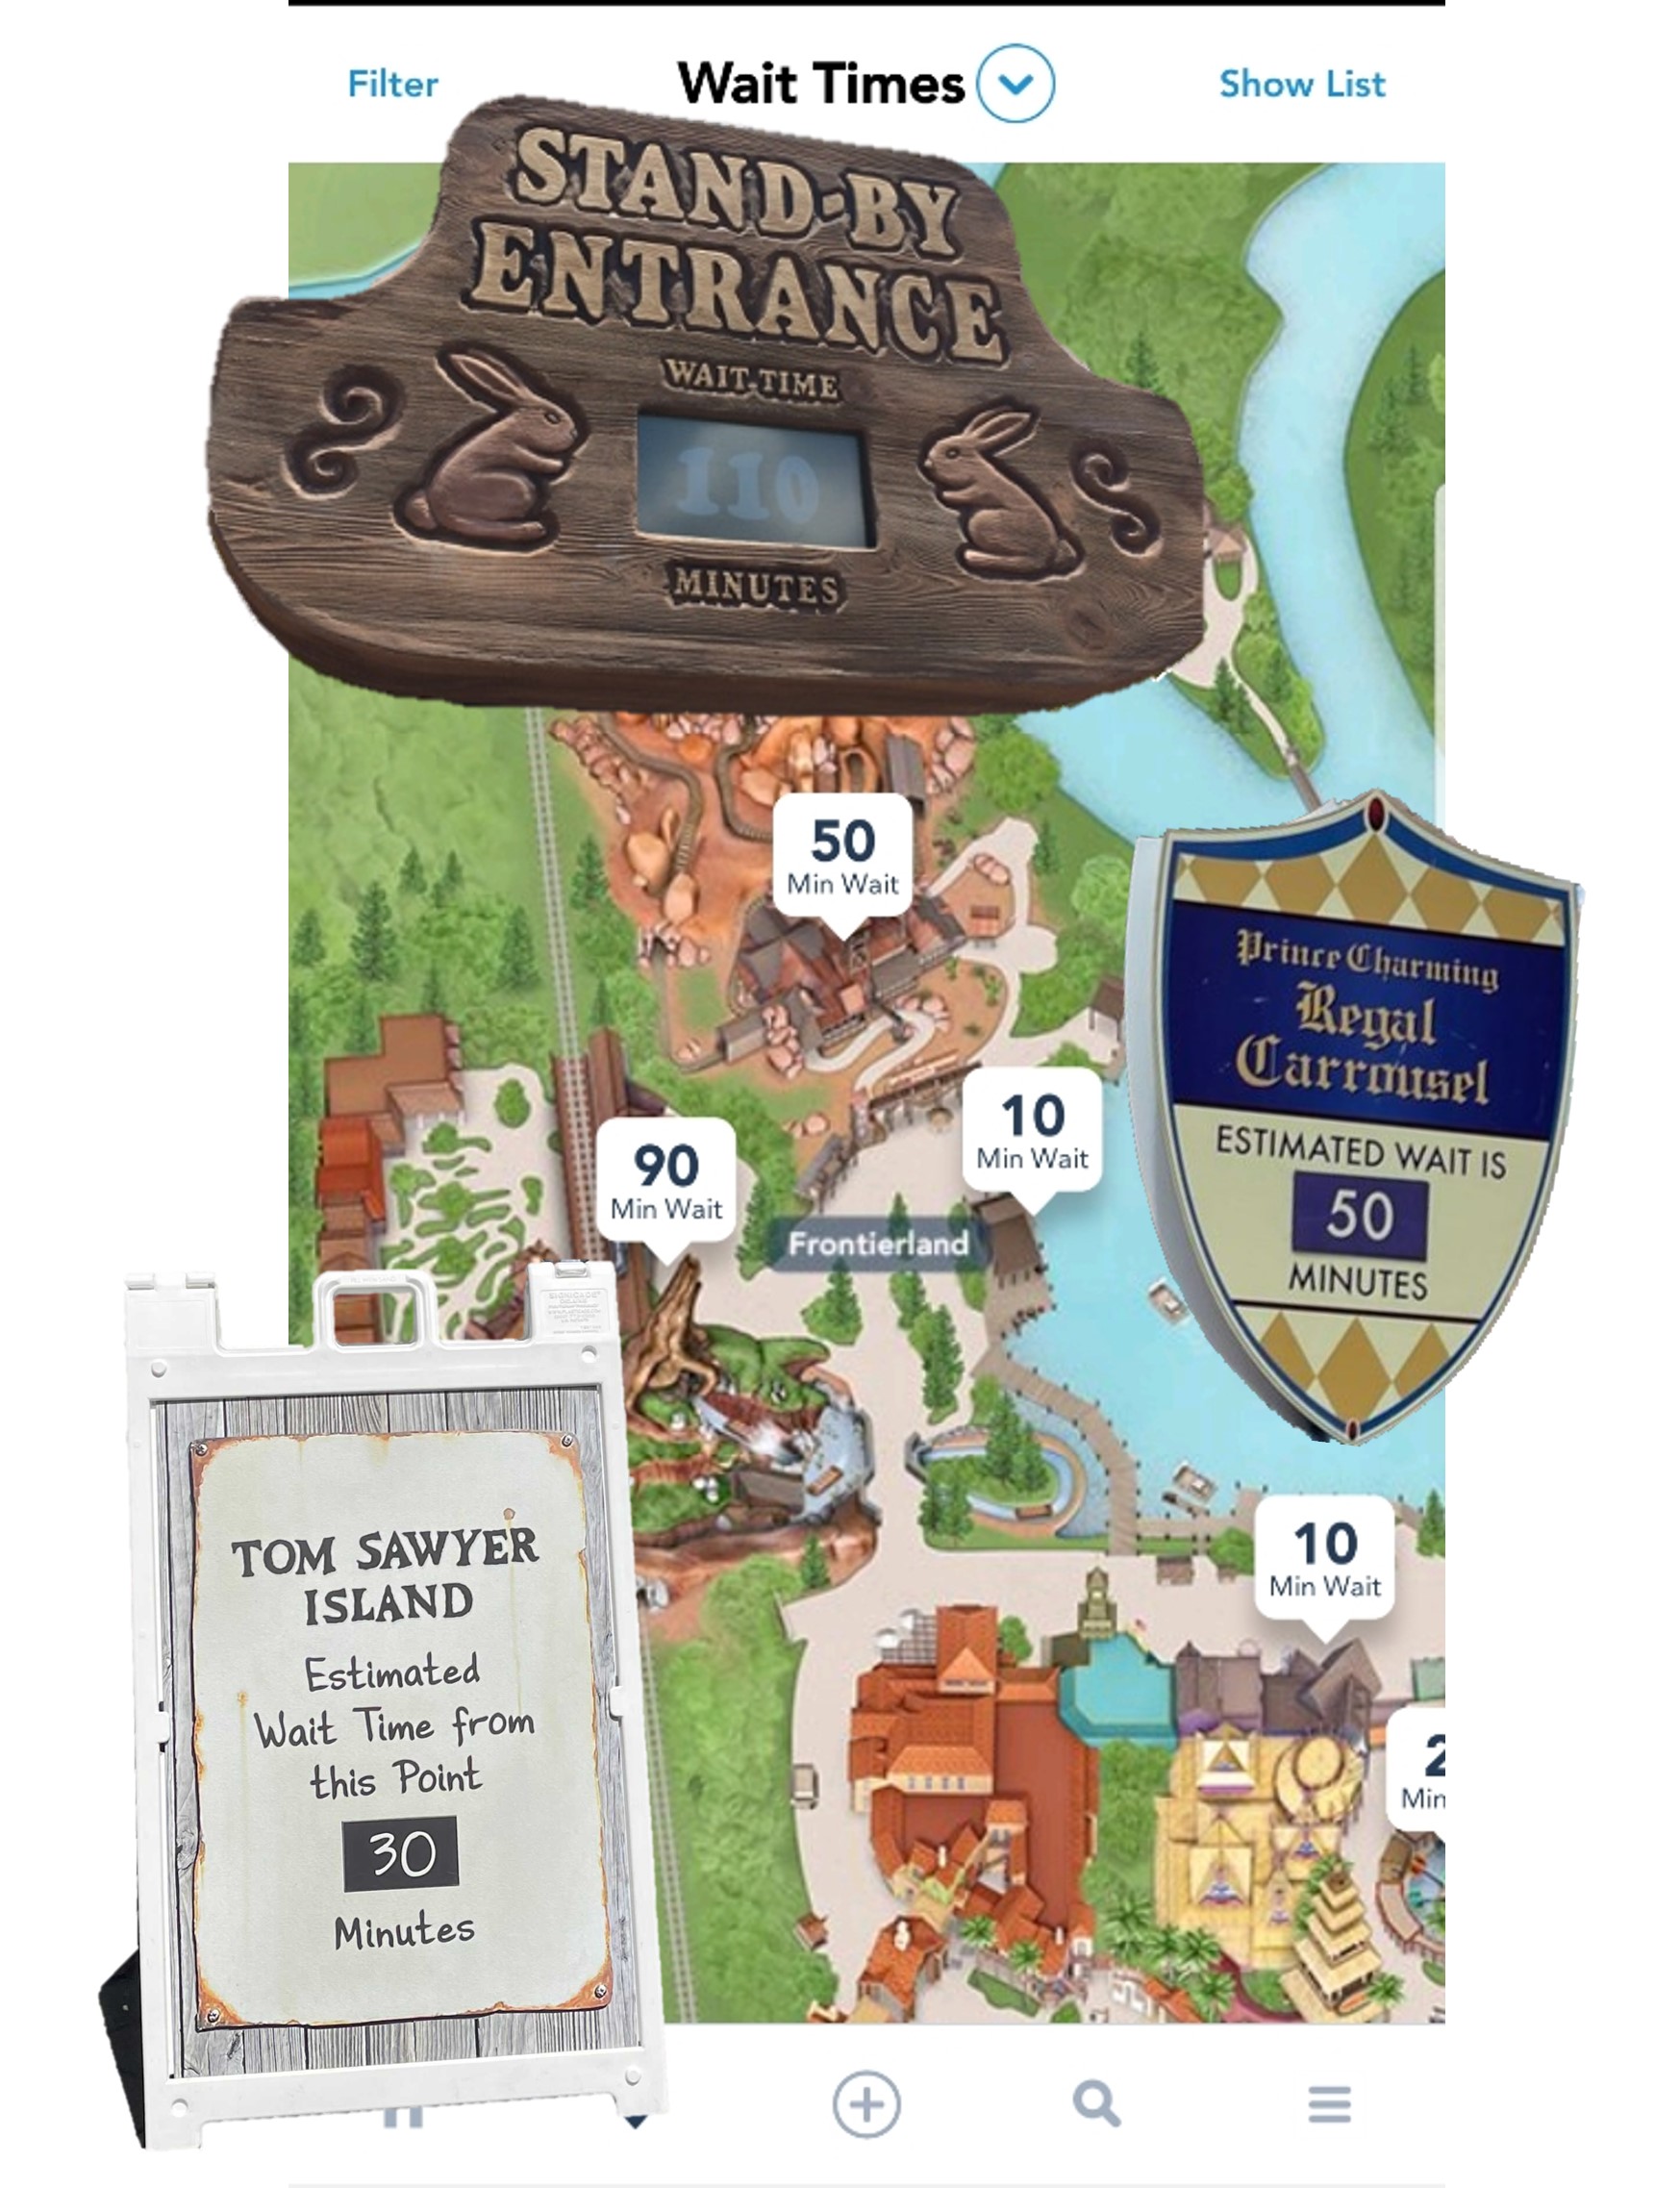
 Posted Wait Times – This is the number you’ll see on a sign at the entrance to an attraction’s queue, or on a lollipop sign at the end of a line of people, or on a sandwich board, or the MDE app … you get the idea. They’re everywhere. They don’t necessarily always agree, but they all come from Disney.
- Actual Wait Times – This is the amount of time you’ll actually be standing in line waiting for an attraction.
Here at TouringPlans, we collect data for and predict both. We’ve collected over 35 million posted wait times, and we use those as part of our predictions of crowd calendar levels. We’ve also collected 2 million actual wait times, and we predict those too. We know they’re going to be different. If they weren’t, you wouldn’t need us – you could just open MDE and trust all of the numbers you see and plan your day around that. But the truth is that Disney has reasons for posting wait times that don’t necessarily match how long you’ll wait in line. What? Why? Some of those reasons could be:
- They need to build in a buffer. If something goes wrong in ride operation, it’s better to aim the wait time high.
- They need to be careful about guest satisfaction. Humans are much more likely to be happy if they wait for less than you tell them they’re going to, compared to if you make them wait longer than if you told them. If I wait 20 minutes more than what you posted, I’m going to be really upset. If I wait 20 minutes less than what you posted … I might actually be pretty pleased that I got lucky or have more time than I thought.
- They need to control crowds. High wait times can discourage guests from entering a line, and send them somewhere else instead.
Our goal at TouringPlans is different – we only want to get those estimated actual waits as accurate as we can. We predict them in advance and even have a model that updates them throughout the day so that we can get as close as possible. Our motivation is different than Disney – we don’t need to control crowds or build in a buffer. We only want you to be able to plan and tour optimally.
 We display both of these numbers in the Lines app (available in the Play Store or App Store). The posted time shows the most recent information we have about what is posted on the sign at the entrance, and the expected wait is the most recent prediction we have for what the actual wait will be.
Explore the Data
Let’s look at four example attractions at the Magic Kingdom and see how the different wait times have trended over the past 60 days. For that period of time, I pulled all of the submitted wait times at these attractions. For each submitted wait time, I also pulled the posted wait time when the user entered the line, and the “adjusted” expected actual time from the Lines app at the same time. That adjusted time is what you would see in Lines if you refreshed the attraction list or your plan right as you entered line – it takes into account our mid-day updates. (Spoiler: train yourself to do this!)
Big Thunder Mountain Railroad

These graphs all display the average error in the posted or adjusted wait time compared to the actual timed wait submitted by a TouringPlans user. The way this is calculated is by “Posted Wait minus Actual Wait” and “Adjusted Wait minus Actual Wait”. So a positive number means someone over-estimated your wait. And a negative number means that someone under-estimated your wait. Let’s look at 11 am as an example. If you entered the Big Thunder Mountain Railroad queue between 11 am and noon sometime in the last 60 days, the time that Disney posted at the entrance was, on average, 14 minutes longer than you actually waited. But if you had refreshed the Lines app as you entered line, that prediction of your actual wait only averaged 5 minutes longer than your actual wait. So if there was a 20 minute actual wait (which you didn’t know because you just made the decision to get in line), the posted wait time was probably more like 35 minutes, and the TouringPlans estimated wait was probably somewhere around 25 minutes.
Pirates of the Caribbean

Maybe you don’t care about roller-coasters. Let’s go classic WDW with our next example at Pirates of the Caribbean. Hey, this looks pretty similar to that last graph … those average errors for the posted times remain higher than the average errors for the adjusted actuals that TouringPlans predicts. Now let’s use noon as an example. If you enter the line for Pirates of the Caribbean between noon and 1 pm, the posted wait time will likely over-predict your wait by 16 minutes, on average. If you refresh your Lines app as you enter, that estimated wait time will probably be within 3 minutes of your actual wait.
it’s a small world

Our same performance holds true over in Fantasyland at it’s a small world. The difference between posted and adjusted wait times is exaggerated at 1 pm. For users entering between 1 and 2 pm, the posted wait times average 15-16 minutes longer than you’ll actually wait. But the estimated wait time in Lines if you’ve updated recently is just 1 minute longer than your wait on average.
Haunted Mansion

The final example attraction for this post is the Haunted Mansion. Nothing surprising here, but it does show our first example of an under-prediction. If you get in line for Haunted Mansion between 10 pm and 11 pm, you might end up waiting longer than what the Lines App tells you that you will wait. But that one timeframe is an anomaly. For most of the day, the posted wait times average 10-15 minutes longer than you’ll actually wait. And the TouringPlans prediction averages 0-5 minutes longer than you’ll actually wait.
Real-World Test Results
Now, I’m convinced just by data. But I’m weird. Some other people might need more real-world proof. So on Tuesday, July 20th, we sent Chrissy to Magic Kingdom to test out whether real-life mirrors what we’ve seen in the data. She had a 4-step touring plan to visit Big Thunder Mountain Railroad, Pirates of the Caribbean, it’s a small world, and Haunted Mansion. I’m all about transparency, so I’m going to share the results of each of those four steps.
Big Thunder Mountain Railroad
 Chrissy got in line for her first attraction, Big Thunder Mountain Railroad at 11:11 am. The posted wait time when she got in line was 45 minutes – that time was on a lollipop sign. She refreshed Lines at the same time and saw the same 45 minute posted wait, and an expected wait time of 28 minutes. She started her timer and only waited 31 minutes before boarding the ride vehicle. That means the posted wait time was 17 minutes longer than her actual wait, and the TouringPlans expected wait was just 3 minutes shorter than her actual wait.
Pirates of the Caribbean

Chrissy’s next attraction, after a quick lunch, was Pirates of the Caribbean. As she got to the entrance at 12:29, Disney’s posted wait time was 60 minutes. When she checked Lines, it showed an expected wait of 25 minutes. So this was a great example of two wait times that seem really far apart. Chrissy ended up only waiting for 23 minutes before she was able to board her boat and stop her timer. So the posted wait was an amazing 37 minutes longer than the actual wait. The TouringPlans expected wait was only 2 minutes longer than what she waited!
it’s a small world
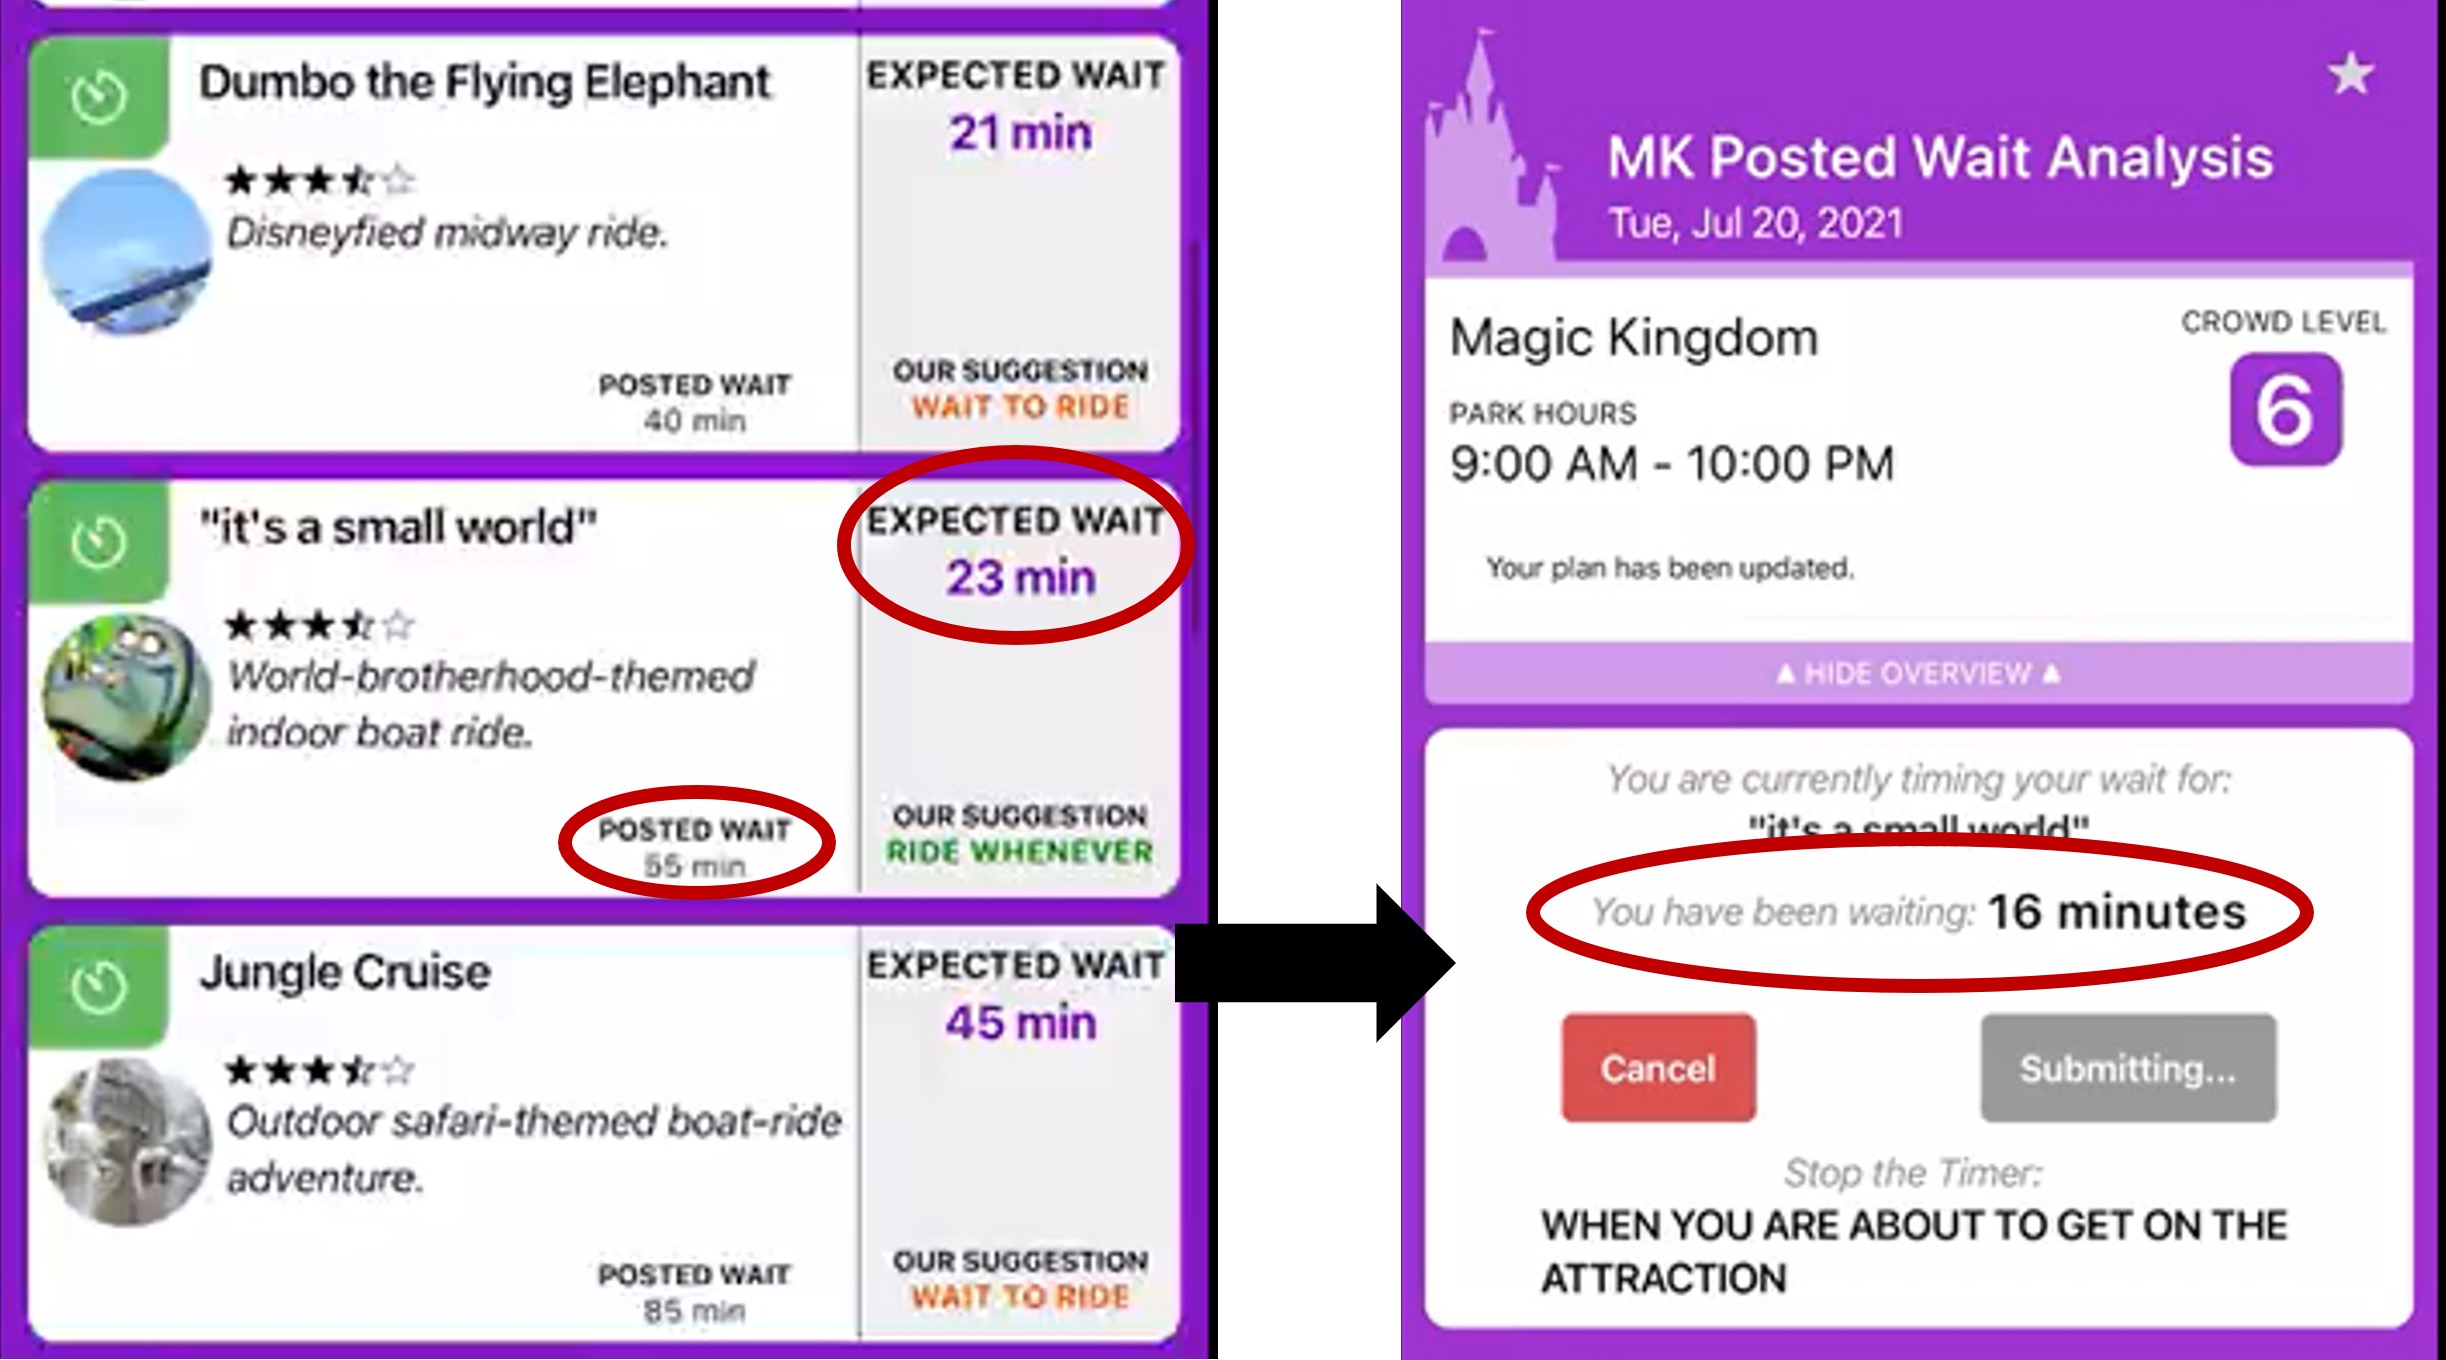
We sent Chrissy over to Fantasyland for her next attraction. She was able to hop into line at 1:14, when the posted wait time showed 55 minutes. I don’t know about you, but I’m not waiting 55 minutes for it’s a small world. It’s a classic, and maybe my 2-year-old’s favorite ride (certainly the one she asks to go on the most), but 55 minutes just isn’t worth it. Thankfully the Lines app was telling Chrissy to expect a 23 minute wait. Much more doable. Chrissy was very excited when, 16 minutes later, she was already stopping the timer and cruising around the world. So if you thought the 37-minute over-estimate at Pirates was crazy, this one was crazier. Disney’s posted time was 39 minutes higher than the actual wait. And our TouringPlans estimate was 7 minutes too high – our biggest miss out of the 4 attractions, but still not terrible.
Haunted Mansion

So far we were 3-for-3 on proving out the realistic differences between Disney’s posted and TouringPlans’ estimated wait times. Can we make it a sweep?! Chrissy made her way to Haunted Mansion through a pretty large crowd of people to the ride entrance where there was a posted wait of 65 minutes at 1:50. She refreshed the Lines app and saw that we were predicting a 37-minute wait. A decent wait, but at least it wasn’t over an hour! I won’t make you hold your breath. In just 35 minutes, Chrissy’s phone over-heated and died (so you’ll have to take our word for it without a screenshot), but she was on her doom buggy. That means Disney’s posted time over-estimated her actual wait by 30 minutes. And the TouringPlans estimate was only 2 minutes off.
Sum It Up!
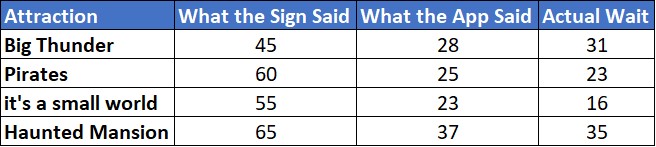
The numbers in this table speak for themselves. These are just four examples from four different attractions, but the data and the examples keep rolling in reliably no matter which attraction or park we choose.
What Does This Mean For You?
- Knowing the difference between posted, expected, and actual wait times is important and will help inform your touring strategy.
- Disney’s posted times, especially in the post-reopening era, have climbed higher as Disney attempts to control crowds and manage guest expectations.
- The TouringPlans estimated wait is meant to approximate your actual wait, not Disney’s posted wait. The two numbers may be very different, and that’s okay.
- Since we make intra-day adjustments to the estimated wait times based on data we receive, it’s important to refresh your app or optimize/evaluate your TouringPlan regularly to have the most up-to-date information.
Update: Fred and I talked about this same topic in a recent video on the TouringPlans YouTube channel. So feel free to forward that link to others if you think they could benefit from this topic.
Have any questions or comments? Let us know what you think!

First published July 24, 2021. Updated October 7, 2021.
You May Also Like...
-

Just after wait times plummeted following Labor Day Weekend, we've begun to see an uptick at wait times at Walt Disney…
-

Although the holiday decorations are still up, the Christmas and winter holiday sparkle is starting to fade at Magic Kingdom. Yesterday…
-

Some things are just classic Walt Disney World experiences. A visit to Magic Kingdom, for example, is made even more magical…
-

When Walt Disney World reopened in July of 2020, new precautions were put into place to ensure guest safety aboard its…
I have a friend that was there on February 13th and I was helping him through the parks all day with Genie+ and which attractions to go to when…I would tell him what the MDE posted wait time was and what the TP estimated wait was….MDE was almost always spot on, while TP was off…biggly! For ROTR, TP had an estimated wait time of 59 minutes while MDE said 120 minutes…they ended up waiting 126 minutes.
I also have a client there now (week of February 21st) and he said the TP wait times have been way off from what he’s been seeing.
What gives?
It’s always about crowd control. Genie (the free part) is ONLY about crowd control.
I waited in line for Rise of Resistance on MLK day. The posted wait time said 180 minutes. It was a little after 5pm. I thought I would bite the bullet and wait it out since I heard its the best ride. Imagine my surprise when we got on the ride 39 minutes later. That’s a HUGE difference of 2 hours and 20 minutes! It must have been for crowd control.
Great explanation. It’s hard to have confidence when getting into a line that says 90 minutes, but a few 30 minute waits will convince you. We’ve been using touringplans for years and years and love it.
I do think it’s worth keeping in mind two times when at least my experience is the projections maybe shouldn’t be believed:
– if something breaks, e.g. when Splash Mountain shuts down, the projection that says BTM is a 20 minute wait is not as important as noticing the line is all the way over to Country Bear Jamboree. So you still need to pay attention.
– Rope drop I think really depends on where you are in the queue (and crowd level). If we’re at the front of the line, we’ll do whatever the biggest draw is, but if we’re at the back we won’t even if it’s what the plan says.
Bruce
We have used touringplans for YEARS. You are our “go to” for reliable info, and always will be. Thank you!!! (And I’m sorry that people are crabbing at you.. you guys are awesome AND accurate!)
What a brilliant blog and video about the Lines app! The only thing it’s missing is… a link to the Lines app. 🙂
Thanks for the feedback, and for the tip. Links added!
@Vince. The app developers. It has been discussed here, on the Touring Plans discussion board, and some of their live streams previously, and that is what they answered.
They also state that you should start the timer once you stop walking in the queue. So that could mean you could walk non-stop halfway through the inside portion of the queue before starting the timer (like on Small World). Or perhaps you have to stand outside in an extended queue (like on Flight of Passage), and you would start the timer out there.
Then touringplans.com needs to better communicate this to their users. I start the timer when I pass the CM outside of Star Tours.
For Rise of the Resistance,
the App.says Submit when you are ABOUT TO GET ON THE ATTRACTION. You say it’s the main ride, but the App says the RIDE LENGTH is 18 minutes. Without guidance from Touringplans.com, this leads to wild discrepancies in wait times submitted just a few minutes apart.
I cannot thank you guys enough for this information. During our last visit, a girls’ trip at the end of June, the posted wait times were off the charts. My daughter kept asking, “why are we getting in this line, it says 75 minutes?!”, and I kept saying, “trust me, Touring Plans says…” and you were spot on every time. I attempted to explain to her why Disney’s times were so off, and I figured it had to have something to do with “under-promise and over-deliver”, but this really clears it up. BTW, I saw more people using the app this trip than ever before. Not that I begrudge you success, but could you just not get too popular??
Ha! I’m so glad everything worked out well for you, Lisa.
When timing an actual wait time, when do we press Submit for rides with more elaborate pre-shows. Example: Runaway Railroad and Rise of the Resistance
Submit when you are boarding the main ride vehicle.
According to who? The instructions in the App are vague.
Hi Vince, TwoBits has it right – you submit the time when you enter the ride vehicle.
I know that you folks get fewer reported actuals from the west coast parks but do you have a sense of how much this holds true out there? The CA and FL parks seem pretty autonomous in some ways so I didn’t know if maybe they do their in house number crunching in a way that would lead to less predictable variation on one coast or the other.
Folks often claim that a touring plan is less important in California but I’m a fan of at least having a rough outline for what I can hope to experience in a day so I can lay out my trip to improve my chances of experiencing all my favorites in the time allotted.
You’re right, Brian – we get many fewer actuals from Disneyland. In the past 60 days, we had over 15,000 submitted actual times from users. In the same timeframe, we had fewer than 1,200 from Disneyland – less than 10%. So it’s harder to get statistically significant studies. But if we look at the park-wide level there are enough actuals from each park in California to get some idea of what’s going on.
At Disneyland, actuals have been 70% of posted times in the past 60 days
At Disney’s California Adventure, actuals have been 71% of posted times in the past 60 days.
Those are both on par with inflated post times at Hollywood Studios, but less than the inflation at Animal Kingdom, EPCOT, and Magic Kingdom.
I *love* seeing these kinds of explanations of the hard data your team uses! I’ve been meaning to write in to The Disney Dish and ask Len to talk about the day-to-day activities when staff are in the park, but I also don’t want to sound like I’m asking for the secret sauce.
Out of curiosity, do you see differences between posted wait times/actual wait times between theme parks? Like, are Epcot attractions more likely to show larger disparities than the Magic Kingdom, or anything like that? (If that’s a big ask, no need to spend time on it! Just wondering).
Glad I could give you a little peak into what the in-park team does. But they do much much more than just this one little test – so feel free to still write in!
Now, it wouldn’t really be fair if I titled this post “The Wait Time Secret That Disney Won’t Tell You” and then keep my own secrets and not answer your question 🙂 So I pulled you the very most-up-to-date numbers for the past 60 days (including yesterday).
Animal Kingdom: Parkwide, actuals have been 65% of posted times. The average overestimate by Disney across the park is 14.6 minutes. Posted wait times have been closest to actual at TriceraTop Spin (actuals 79% of posted and off by an average of 1.8 minutes) and furthest from actual by percentage at Kilimanjaro Safaris (actuals 59% of posted) and by minutes at Flight of Passage (off by an average of 26.8 minutes)
EPCOT: Parkwide, actuals have been 55% of posted times. The average overestimate by Disney across the park is 12.6 minutes. Posted wait times have been closest to actual by percentage at Frozen Ever After (actuals 79% of posted) and by minutes at Living With The Land (off by an average of 7.2 minutes). They’ve been furthest from actual by percentage at The Seas With Nemo and Friends (actuals 31% of posted) and by minutes at Test Track (off by an average of 21.8 minutes)
Hollywood Studios: Parkwide, actuals have been 71% of posted times. The average overestimate by Disney across the park is 13.1 minutes. Posted wait times have been closest to actual by percentage at Millennium Falcon: Smuggler’s Run (actuals 91% of posted) and by minutes at MuppetVision 3D (off by an average of 3.5 minutes). They’ve been furthest from actual by percentage at Star Tours (actuals 54% of posted) and by minutes at Slinky Dog Dash (off by an average of 29.5 minutes)
Magic Kingdom: Parkwide, actuals have been 62% of posted times. The average overestimate by Disney across the park is 11.9 minutes. Posted wait times have been closest to actual at Prince Charming’s Regal Carrousel (actuals 97% of posted, and off by an average of 1.2 minutes). They’ve been furthest from actual by percentage at Buzz Lightyear’s Space Ranger Spin and it’s a small world (actuals 48% of posted) and by minutes at Splash Mountain (off by an average of 21.1 minutes)
That’s really interesting to see – thanks again!
Hi! Thanks for a great article! I do have one question. On the touring plans I created it says Est. which I assume is estimated. So how does that fit in? I saw expected and posted on the list of attractions in the app. Does estimated equate to expected or posted? Or am I making this too hard!? Thanks
You’re not making it too hard, Erin! That’s a good question – it’s hard to keep track of everything. Estimated on your plan is the same as “expected”. The app shows “expected” for all rides and updates when you refresh it. Estimated is just what it’s titled in the plan.
We used you for the first time on our two week vacation that we just returned from. YOU SAVED OUR VACATION!!! Your wait times were spot on. We went on rides we would have definitely turned away from if we trusted Disney. For instance, so many times the posted wait time was 60+ minutes, but you guys said it would be 30. We hopped in line and you were ALWAYS right. I am in no way a paid spokesperson, but I became your biggest source of advertisement in WDW. We told everyone about your app. We’ll never go to WDW without it again.
This may be my favorite comment on any post ever, Justin. I’m so glad that you had a positive experience and weren’t swayed by the high posted times. Thank you for sharing the knowledge with others while you were there, too!
It’s the data that you all collect and the experiments you run that is keeping me from freaking out about the changes happening in the next year: early entry at all parks for resort guests (we stay off site), and the inevitable change to FP+, be it some sort of paid version and/or virtual queues like what is happening in Paris. I know the Touring Plans team will have it figured out and the small subscription fee paid to you will do my family better than paying extra hundreds (or thousands) of dollars to Disney for resort perks. Thank you1
Thanks for the advertising, TwoBits! Ha! But in all seriousness, I feel the same way. It takes a lot of work to keep up with all of the changes, especially in this pandemic (and hopefully, post-pandemic) era. Staying ahead of that is impossible for any individual. But TouringPlans can keep us ahead of the crowd – literally.
Great article! Here is something that explains why this WAS happening with fast pass and why fast pass as we know it may not be returning.
Often, guest felt “ripped off” with fast pass at times where parks were not packed. For example, a guest makes a past pass and the rides they really wanted, Seven Dwarfs mine train wasn’t available, and th soonest they could get it was 6pm, close to park closing that night. So they wait and go back to find while the standby line posted wait time says 30 min, they can see that their is no one in the que and it’s actually about 5 min wait. This happens often to rides like Pirates, Small World, Jungle Cruise and others.
The fast pass system the way it is doesn’t work, and the only way Disney can make guest happy with it is to post much longer wait times to make a guest feel like they haven’t lost on something they feel like they paid for with their park admission, and hope they don’t notice the actual wait time, which in some cases, the actual wait time in the fast pass like is longer than the actual wait time in the standby line.
Thanks for the feedback, Jim.
The impact of FastPass is/was multi-faceted. I think the case of FP wait being longer than actual wait would be a big outlier. The inflated posted times have been more of an issue when FP hasn’t been available, so Disney isn’t trying to manipulate that difference. And when FP is available, a very large percentage of ride capacity is dedicated to FP riders.
Regardless, it’s still important to know the difference between the posted and actual wait times, especially for standby riders.