
Why Does It Seem Like the Parks Are Always Experiencing Downtime?
The last time my family visited EPCOT was in September 2020. My oldest daughter was four, and in each of the four parks we visited during our vacation, she had one attraction that she was absolutely determined to experience. In EPCOT that attraction was Test Track. She was barely tall enough, and she was pumped. But … downtime. Always downtime. Once for rain, frequently not. We even criss-crossed that way-too-large park with its sea of construction walls multiple times just to check back in and see if maybe it would be coming back up soon. Nope, never.

Our next trip to EPCOT is at the end of July, on what I like to call our “You’re Paying How Much Just to Go Get a Haircut At Disney?” trip. That’s another story for another day. Will she finally be able to go on Test Track? If you’ve been to WDW in the past few months, you know our chances aren’t great. Test Track is down frequently. How frequently? And are there trends that I can figure out? Are things getting worse? Better? Are there whole parks where downtime is a particular problem? Let’s figure it out!
Explain the Math
If you look up any past date in the crowd calendar, you’ll see information about capacity lost due to downtime for each park. And if you look at any wait times graphs for any attraction for any date in the past, you can also tell when a ride is down by the lack of posted wait times for a specific time period. On top of that, we also have information about when queues get “dumped” – or the people waiting get cleared out due to a closure.

Over the course of this and one other blog post this afternoon (I’ll link it here once it goes live), we’ll dig into all three sources of information to try to answer some of my questions and give you some insights for your next vacation.
- We’ll look at trends of park-wide capacity lost due to downtime to see if we can answer high-level questions like “This problem seems like it’s getting worse and worse. Is that true?”
- We’ll look at attraction-specific downtime trends and averages to figure out if there are particular problem attractions to either avoid or plan your day around if they’re important. We’ll also be able to tell if super headliners have more problems that minor attractions, if newer attractions are more problematic than older ones … etc.
- And we’ll look at queue clearing to figure out if your overall goal is to avoid wasting time in a queue that is just going to spit you out for a closure anyway, which attractions might be the worst bets.
Get your predictions in now, and then let’s see what the data says!
Overall Park Downtime By Month

To the untrained eye, this might look like some total confetti nonsense. But you readers aren’t untrained, are you? So let’s figure out what we can see and learn here:
- Each dot represents how much of that each park’s capacity was lost due to downtime. For example, there are three gold dots hovering around the July 2021 vertical line. These three dots mean that during the months of June, July and August 2021, and average of ~6% of Magic Kingdom’s capacity was lost each day due to unexpected downtime. That’s an awful lot of lost capacity.
- The gap in data is due to that lovely little pandemic that closed the parks. It makes overall trends a little harder to discern. But if we use some inference, we actually see a remarkably clear pattern start to emerge – capacity issues are definitely cyclic. They peak in June/July and bottom out in December/January. You know what also peaks in June/July and bottoms out in December/January? Precipitation in Central Florida. Probably not a coincidence, but we’ll use our attraction-specific data just to make sure.
- The cyclic dip in January doesn’t seem to dip as low as normal in January of 2022. January 2019, 2020 and 2021 all had average downtime capacity losses at or below 2%. But in January 2022 that average stuck closer to 3%. And even 1% capacity makes a big difference.
Overall Park Downtime Trends
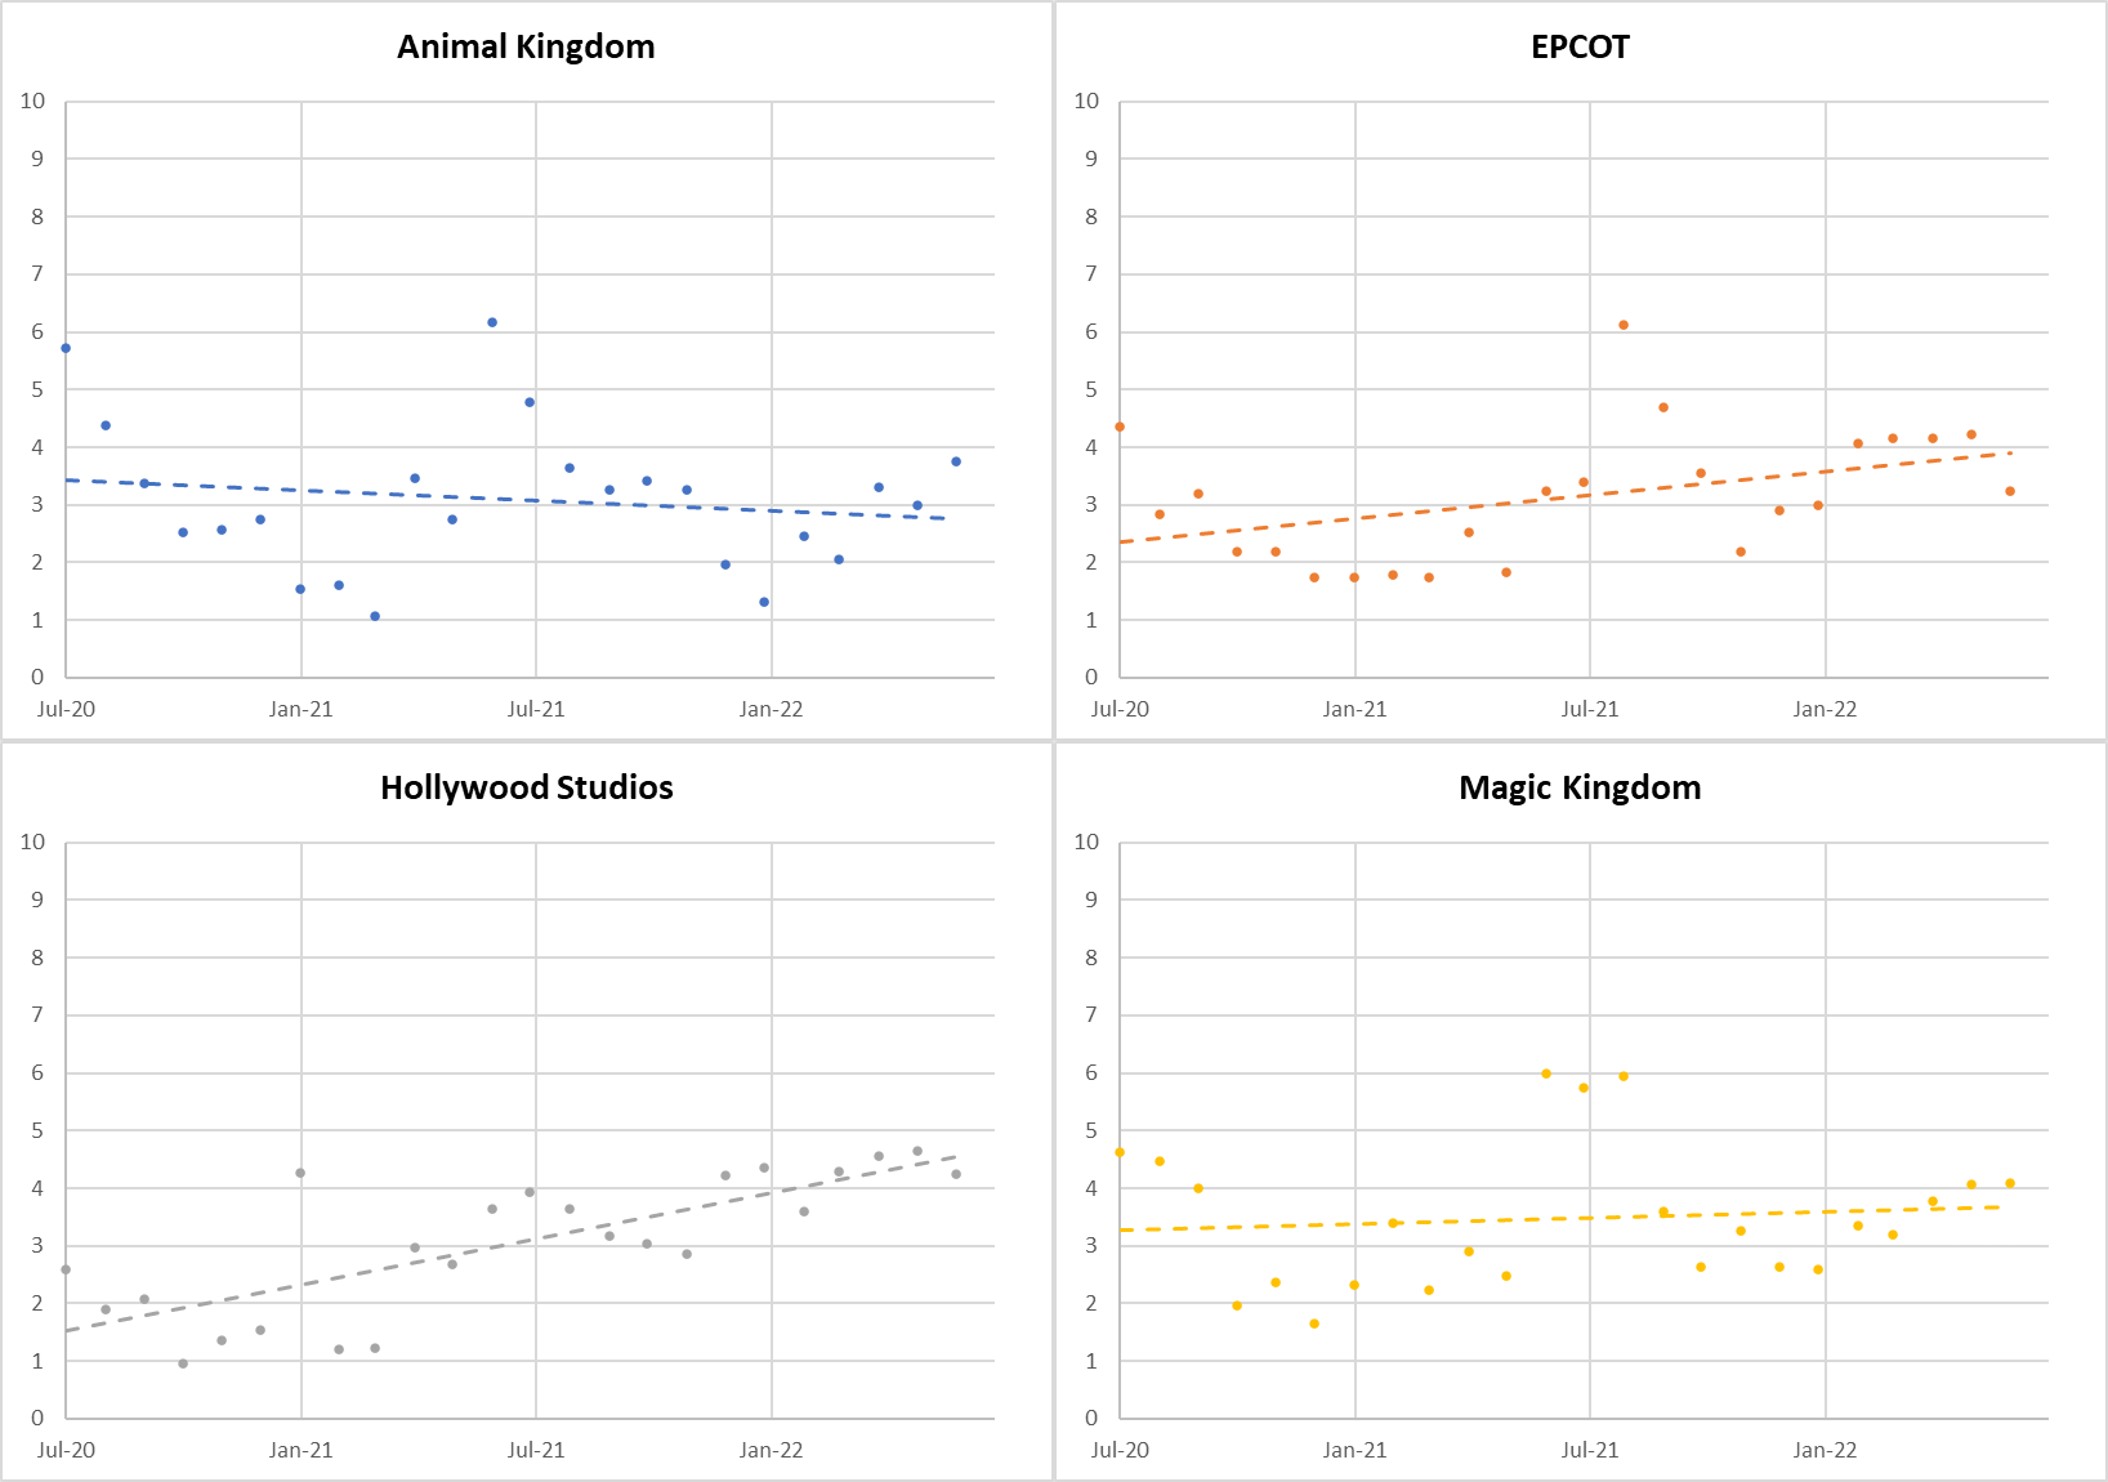
Now, I already talked about how these downtime trends were cyclic. So linear trend lines aren’t really fair. I’ll own up to that point before any of you smart people call me on it in the comments. But these charts represent exactly two July-to-June cycles, so if the cycles are predictable and not changing, the linear trendline should be flat. None of these lines are flat.
- Animal Kingdom is the outlier here – it’s the only park where capacity lost due to downtime is actually decreasing. So we could guess that attractions there are actually getting more reliable. That’s nice. Maybe if this all bothers me, I’ll just start spending more time an Animal Kingdom. Sounds relaxing.
- Magic Kingdom is the … next-least-worst? The overall average capacity lost is increasing, but slowly. In July 2020 we could’ve expect 3.25% of capacity lost per day, and in July 2022 that’ll shift upward to “just” 3.75%ish.
- Things start getting uglier at EPCOT. The downtime trend is increasing much more there – from an expected average of about 2.33% in July 2020 to an expected average of almost 4% in July 2022. That’s significant. I’d be prepared to say that capacity lost due to downtime is legitimately becoming more of an issue at EPCOT.
- But Hollywood Studios comes along and says “You ain’t seen nothin’ yet.” It increases from an expected average capacity lost due to downtime in July 2020 of just over 1.5% all of the way to expected average in July 2022 of over 4.5%. That’s tripled! Something’s definitely up. Hollywood Studios is on my naughty list. I don’t know about you, but if I was running a business and over the course of two years, my downtime tripled, I probably wouldn’t find that to be acceptable. I’m hoping I would try to fix it.
What Does This Mean For You?
- If it seems like attraction downtime is getting really bad, you’re at least somewhat correct. Especially if you’re used to travelling in Winter and are now making a Summer trip.
- But there’s more than just cyclic downtime happening. Overall downtime is trending upward too.
- Hollywood Studios is doing the worst out of all parks, followed by EPCOT. Animal Kingdom, on the other hand, is trending in a better direction.
In addition to looking at park-by-park data, we can learn even more by looking at attraction-specific information and trends. Stay tuned for a follow-up article this afternoon with those details. In the meantime, share in the comments if you’ve noticed anything about attraction downtime in your recent visits!

You May Also Like...
-

Fireworks are an iconic part of the Disney theme park experience, and their absence at Walt Disney World has been keenly…
-

Our team is in the parks every day to keep up to date on everything exciting and amazing in the world…
-

October 1 will be the kick-off of not only new fireworks shows, daytime shows, cavalcades, new attractions, and more. In addition,…
-

Our team is in the parks every day to keep up to date on everything exciting and amazing in the world…
Do we know if this issue is playing out at DLP/DCA, as well? Or is it unique to the FL parks?
Good question – I plan on pulling DL/DCA data next! Stay tuned 🙂
Would you consider the impact of brand new rides, especially technically involved ones, to be the biggest contributor of the general upward trend? Ie: Remi, Guardians, Rise of the Resitence? I’m sure when Tron opens, MK’s trend will steepen. Can’t possibly be all weather related?
The answers you seek can be found here: https://touringplans.com/blog/why-are-my-favorite-attractions-always-down/ 🙂