Breaking Down Disney World’s Q4 Attendance
Here I follow up on Disney’s 4th Quarter FY 2015 reporting from last week, which stated domestic theme park attendance (Disney World and Disneyland) for was up 15% year-over-year including the extra week in 2015, 7% without it.
Disney’s fiscal 4th quarter ran from June 28 through October 3, 2015. Here’s a look at the change in number of people in line at Walt Disney World, by park, versus the same dates in 2014, with the same methodology we’ve been using:
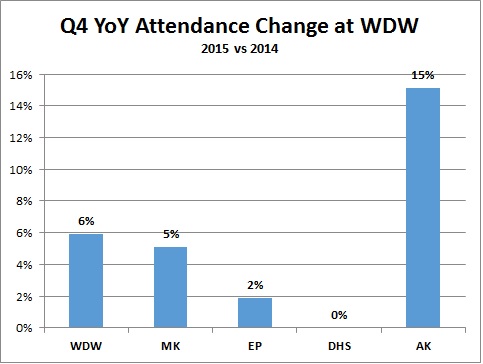
The biggest gains were at the Magic Kingdom and Animal Kingdom. My guess is that the Animal Kingdom is getting a lot of traffic from Hollywood Studios. And as The Motley Fool just pointed out, the long-term trends indicate Epcot might be WDW’s least-visited park by 2020 [1].
Interestingly, the attendance gains were not evenly distributed across months or weeks. Here’s the Magic Kingdom, broken down by month for 2014 vs 2015:
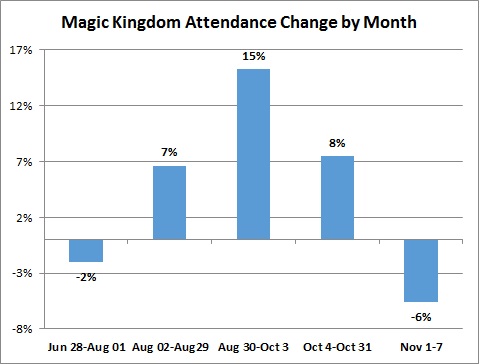
July numbers looked down slightly. August was above average, and September was legen- wait for it like you can’t get a FastPass -dary. Disney said hotel room occupancy was up 1% for the quarter, but didn’t break it down by month. That 1%, though, would seem to indicate that most of these additional guests stayed off-site. We have a question in to Disney on this.
Disney’s Q1 for fiscal year 2016 started on October 4, 2015. October gains at the Magic Kingdom look to be solid, too – up 8%. The first week of November looks a little slow, but we’ll see what happens with the Christmas parties.
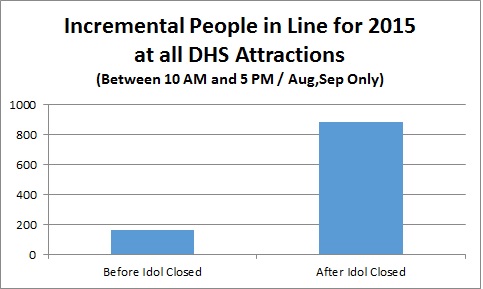
As for Hollywood Studios, remember that the year-over-year numbers span the closing of The American Idol Experience and The Magic of Disney Animation. Neither of those had posted wait times. (Neither did the Frozen trailer film preview that ran at the old Sounds Dangerous location from June 17-September 7, 2015.)
For the attractions still open that had wait times, the number of incremental people in line during Q4 looks essentially the same as we’d shown earlier for August and September, which was around +650 people:
That said, there’s a lot of ways the Studios’ attendance could be up or down a couple of points and have that be hidden in whatever’s left, plus special events, character greetings, and whatnot. I don’t see it, but I could be wrong. I’m sticking with my 0% estimate because I have faith in y’all to choose a better park.
We’ll take a look at Disneyland numbers shortly.
Letters … We Get Letters
Our blog posts on Disney World wait times and Disney’s Q4 earnings call prompted lots of emails. Here’s one about FastPass+:
The increased waits come down to an increase in Disney’s efficiency with the FP+ system. I have read a whole lot of threads and trip reports, and the standby lines are pretty much at a standstill when the FP users come through.
I think better FP+ handling is a small part of increased standby wait times, and noted it in our blog posts for DHS, Epcot, and the Animal Kingdom. Is it the majority of wait time increases? I don’t think so. For one thing, it doesn’t explain the Magic Kingdom chart above, which shows decreasing average wait times in July and November month-to-date. Why would Disney Cast Members be super-efficient with FastPass+ handling, but only in September?
Footnotes
[1] It’s worth remembering that we’re using wait times to estimate park attendance, using popular rides, shows, and attractions across Walt Disney World. That’s generally an objective, transparent way to determine crowds. It wouldn’t be able to count, as an example, anyone who came to Epcot’s Food & Wine Festival just for the eating and drinking. Those folks wouldn’t show up in our numbers.
You May Also Like...
-

The Disney Skyliner has been a frequent conversation starter ever since it was announced back at the last D23 Expo. Love…
-

Not since the monorail has there been a transportation system that has captured the hearts of guests like the Disney Skyliner.…
-

It's always a magical time when we visit Magic Kingdom. This weekend, our team arrived early to enjoy a morning at…
-

Disney's After Hours offers so many attractions! So much food! So few people! Does it live up to the hype? It…
This is impressive because the crowd calendar didn’t look too different in sept but oct busted the calendar with 10s!
Could liners submit where they parked when they came into the TTC? Wouldn’t that be a relative simple guesstimate of guests not staying on property? Maybe roll it into a feature like “I’m parked here, I have or don’t have a stroller should I walk or wait for the tram?” I’m more of a walker personally but this is the first wait most experience!
Over the course of a 365 day period, are there an equal number of days at each value? 365 days a year divided by 10…Are there always 36 rated a 1; 36 days a 2; 36 days a 3; etc.?
OR
Could you have 100 days at 1; 50 days at 2; 2 days at 3; etc.?
Still, Big Picture, the cost of a Touring Plans subscription is the best value in terms of the cost of planning a WDW trip.
Many thanks for your continued analysis and reporting.
The distribution of crowd levels had a bell shape in 2014. Most days falling in the middle and few days as 1’s and 10’s. With the increase in wait times, so has the crowd levels. If you look at today’s Crowd Calendar update you will see more 10’s than 1’s. In the future, we may adjust the distribution to have the bell shape distribution.
With so many closures and festivals, plus FP+ complicating matters, I too find crowd estimates based on wait times much less helpful lately. As a local who gave up trying to get FP’s, I don’t even bother with rides most of the time any more – what’s more important is how crowded the park feels while walking around. Food & wine is an extreme example of the discrepancy, but it’s not the only one.
I used to do data mining for a living myself, and I’m hard-pressed to think of a good way to measure “crowdedness” with the data that is available. Disney shut down their webcams a long time ago. You can’t exactly fly a drone over the parks and do image analysis either 🙂 Tourism data from OIA is probably the best measure I can think of in terms of “number of bodies in Orlando right now”, but even that would be of limited use.
Maybe get “Liners” to submit photos at known choke points within the parks, and do image analysis on them to measure actual crowdedness? I think that would be just as valuable as reporting wait times.
It would be both neat and simultaneously creepy if Touringplans could get access to another data point like cell phone connections. I’m guessing that most adult visitors have a phone on them at any given point and you could probably count visitors using cell tower data. But that’s… not gonna happen.
Have you ever considered doing a second category that would give a “park attendance” estimate, in addition to the present attraction lines rating? That could reflect festivals, special events, seasonal changes, attraction closings & refurbs, operational changes reflecting less individual line capacity, etc. That could help us anticipate times standing in line for food, dining reservations, FP availability etc.
If Disney only had a 1% increase in on-site room occupancy of say 1,219 guests (30,469 on-site rooms times 1% times an average of 4 people per room)then what drove the September and October crowds and wait times? Maybe the folks at Decision Science won’t have an extra something special in their Christmas stockings.
I would have bet on a larger increase in WDW hotel occupancy.
Smith Travel Research does a poll of off-site Orlando hotels, and we’re looking for those updated numbers. We’re also checking with Orlando International Airport for passenger stats.
There’s an interesting idea here: if guests decide that staying at a WDW hotel is too expensive, then it gets more difficult for Disney to predict crowds using hotel occupancy numbers. They’ll still have FP+ reservation data to use, but their models currently rely on hotel occupancy numbers for predictions, IIRC.
If they move to only look at Fast pass reservations that will only give them a 30 day or so window to make adjustments to work schedules and park hours.
Interesting possibility. If they can’t accurately predict attendance, than a moderate unexpected attendance surge could lead to capacity issues (if hours and staffing weren’t anticipated properly). Thus, the affect of a moderate attendance surge could have a dramatic magnified effect on wait times.
Interesting. Perhaps people have a set budget in mind for their Disney trips, and with the increase in costs of tickets, dining plan, etc. as well as airline ticket prices, people are cutting back on the hotel and staying off-site. Most families flying-in probably go for a week, and that length of trip is probably inelastic- I feel like the week-long summer vacation is ingrained in suburban US culture. Families would rather trade-down on their hotel than give up park time.
Could it be that a larger number of people than in any recent times are staying at Universal hotels (or offsite hotels that are closer to Universal) and only visiting Disney for a few days -essentially splitting their visit to Orlando amongst the tourist areas rather than spending the entire visit on Disney property in a Disney hotel?
Are wait time numbers relative? So a 1 would be the least busy, no matter what the wait times are? Do you expect the increases in attendance to go away? If not them there is a new 1 and a new 10.
Yes, 1 is always least-busy, regardless of whatever wait times a 1 represents. And a 1 has, for the past few years, meant the same waits at the same attractions.
We’ve talked internally about the possibility of having to make this year’s “2” next year’s “1”, essentially shifting the scale up. I’d like to wait 90 days, to see how Epcot and DHS handle the big outages coming their ways, before we do that.
Good question. Thanks Kevin.
I mean, I totally believe your data about all of this, it just seems crazy almost because on our trip (end of sept-beg of oct) we kept saying these crowds are awesome! Wait times are down down down! But I think maybe this is also a suggestive feeling too because we’ve always traveled in late August or spring break. That said, when we had trouble with out hotel room at pop century, they had a harder time than I expected finding us another room there. I asked the cast member if there was anything going on or something and they said they had no idea why it was so busy, they were super surprised at it.
Side note, I have no idea how you could possibly estimate crowds for food and wine but if you do figure that out super kudos to you!
So what happened to the Magic Kingdom analysis?
I think I’m comfortable with what we’ve posted. Ah, unless you’re interested in the individual attraction wait time and FP charts. I can post those. Let me know. Thanks for reading, Adam!
You did say in previous posts there were “interesting trends” not yet explained…are these trends just more people in the park? Also, why are so many visitors uninterested in all the princess meet and greets now? Less little princesses in the park?
Lol… I’m not trying to be difficult. But did I miss something? You posted analysis of Animal Kingdom, Hollywood Studios and Epcot, and said Magic Kingdom was coming late last week. Did I miss it?
Ha! My bad – I should have included the link: http://blog.touringplans.com/2015/11/03/magic-kingdom-intermezzo/.
Let me know if you want to see the individual attraction charts with wait times & FP availability.
Umm…. Ok, I don’t mean to be annoying but that post said:
We’re still working on analyzing wait times at the Magic Kingdom, to finish the What’s Up with Wait Times series we started last week. We’re waiting to hear back from a few folks on a couple of questions related to those. We’re also waiting to hear if Disney says anything on their earnings call on Thursday. Once all that’s done, we should have the post up – probably Friday.
So is more coming? Or is the conclusion that there was simply a sudden unexplained surge in attendance?
Apparently we’ve run out of “reply to” depth on these comments. 🙂
Yeah, I think the attendance explains it. If there’s a specific question that it doesn’t address, let me know. I’m happy to do more depth on the MK, if it’s going to answer something that hasn’t been addressed.
Ok, thank you for the thorough thoughtful analysis as always.
It begs the question though, what caused such a sudden attendance surge, especially if it wasn’t felt in the hotels.
Len – I echo Adam’s comments as this really feels like you are leaving us hanging here. So, MK attendance is up 5% vs. year ago and that is driving an almost 12% increase in wait times…?
Hey Terry! I think there are two different times being measured there.
Disney’s Q4 was basically late June through early October – that’s the 5%. The 12% I’d mentioned earlier was for September and October; that’s the last month of Disney’s Q4 and the first month of Disney’s Q1 2016. So Disney’s Q42015 ended strong, and Disney’s Q12016 started strong.
Got it. So during Sept & Oct attendance was up 15% & 8% respectively (average of 11.5%) and your analysis on wait times was that they were up 11.5% Crazy.
Sorry about the typo’s. Too early to be typing.
You seam to be making a really good case against using attraction wait time as an accurate marker of how busy the parks will be. Food and wine is a thing. it bring many people to the park shouldn’t it be factored in along with other event such as marathons and the like?
You make a good point, Frank. I’m open to suggestions on this. We’d need to figure out how to measure crowds for F&W, and how to relate that to waits at rides. So, for example, what does a 30-person line for escargot translate to in terms of 1 to 10, and how would we weigh that against, say, Soarin’? I’ll think about that for a bit. Let me know what you’re thinking, too. We may be able to test it for Food & Wine. Thanks!
Perhaps it’s time to start tracking wait times for each food kiosk. There’s relatively the same food vendors from year to year, so tracking those times just like an attraction might be enough of a sample to make a separate F&W crowd calendar. (Resort: 6, Epcot: 5, F&W: 9) I, for one, would be more than willing to wait in each of these lines multiple times a day…y’know…for research. 🙂
Maybe there are a few key numbers that would be representative like how long it takes to “cross the English Channel”. I’d be willing to time that when I’m in attendance like I try to file as many actual wait times as possible.
Hey Len- why not use the TouringPlans app to gather more valuable crowd-sourced data? That way you’re not relying solely on attraction wait times.
Should I now expect with the coming of this article that evaluating my current touring plans for Nov. 13-21 will have the updated wait times and crowd levels?
Yes, sometime today we think. Thanks for your patience, Azur.
Has the same breakdown been done for Disneyland’s attendance increase due to the 60th? And has the crowd calendar for DLR been updated to reflect the increases DLR is seeing for the 60th, and then also the upcoming seasons of the force? We are heading there soon, and have a TP subscription. Thanks!
Will Disney release info on where guests are coming from? Can this be the rise of the lical fall break? A mini spring break in the fall? In our early Sept trip it was more crowded than I expected but I felt that it was mostly international travelers. I’m trying to grasp how it’s possible that so many more people all decided to travel to WDW in late Sept through mid-October!
We are, too, Melissa. We’ve asked Disney for clarification. Those kinds of questions usually go through a few layers of people. We’ll see what they say.
The surprising thing about international travel is that the USD is strong against most other currencies. Canadian visitors, for example, are paying something like a 20% premium versus a couple years ago.
Also, I don’t think it’s abug rise in off site guests with FastPass a near impossibility at the 60 day mark. Many guests were out of luck for Anna & Elsa unless tgeir trip was 7+ nights which had a slight resolve in late Oct (mid-week arrivals had a better chance at success). Probably attrubuted to the parties but I don’t recall it being that difficult last year in Sept. Just peak time in Oct! I had no trouble grabbing FPs over the holidays either. In fact, there are still 7DMT FPs for NYE. Perhaps a bit of a reprieve here? Can’t wait to find out and see the updated overall crowd predictions! Thanks for all that you do!!