Disney Data Dump July 19 2023
We’re something like officially halfway through the summer, and well past the peak summer Walt Disney World crowds! We’re falling back into our rhythm of very uncrowded weekends. The only two things that could potentially screw up an otherwise perfect, uncrowded summer vacation to Walt Disney World are heat and attraction downtime. I can’t make promises for either, but we can look at the data for both and make plans to help you have the best Disney summer ever.
Observed Crowd Levels July 11 – 17

Look at those beautiful light colors. Our weekly roller-coaster of crowds is back, although to a slightly lesser extent. We’ll see the reasons behind that behavior in our next chart. Things calm down as we get to the weekend, and then pop back up on Monday. But we’re not even getting to peaks of 7 or 8 like we did earlier in the summer. Crowds topping out at crowd level 6 is a totally welcome reprieve from crushing crowds during the crushing summer heat!

When we get down to the individual park crowd levels, some very clear patterns emerge. First – that roller coaster is almost solely thanks to Hollywood Studios and Magic Kingdom. Hollywood Studios in particular is dominating the chart this week. Hollywood Studios also had a LOT of downtime this week, contributing to some artificial increases in the crowd levels at that park. When high-capacity headliners are down at an already wait-heavy park, wait times go even higher.
Saturday and Sunday continue to be an excellent time to visit Hollywood Studios and Magic Kingdom. It doesn’t matter as much at EPCOT or Animal Kingdom. So if you’re travelling sometime before the start of party season, time your vacation to take advantage of the weekend at the most crowded parks!
Performance of Crowd Level Predictions
Each week, I’m giving you a very transparent look into how our crowd level predictions performed. Each day at each park is one data point, so this week we have 28 different crowd level predictions to evaluate each week. Any time a prediction is within one or two crowd levels, things won’t really “feel” much different than what we predicted. Being off by 3 or more crowd levels is where we’d like to be more accurate because you might feel that difference in wait times throughout the day.

In the past week, Touring Plans predictions were either spot-on or within 1 crowd level 86% of the time. This even beats our best-of-the-year performance from last week. Huzzah. 96% of the time Touring Plans predictions were within 2 crowd levels, and that means we earn an A for our predictions this past week! That crowd calendar update is still holding true!
Attraction Downtime July 11 – 17
If we average all of the capacity lost due to unexpected downtime over the past week, it comes out to 4.3% of attractions unexpectedly being down. Better than last week, but still worse than our historical average. The park with the biggest issues was Animal Kingdom, with 6.9% of its capacity lost due to unexpected downtime. It was followed closely by Hollywood Studios, which saw 6.2% downtime in the past week.
The worst day for attraction downtime in the past week was on July 11th. On that day, 7% of all capacity at WDW was lost due to unexpected downtime. The worst park-day of the week was at Animal Kingdom on July 14th. On that park day, a whopping 17% of the capacity at the park was lost due to unexpected downtime. Animal Kingdom was open for 11 hours on the 14th, so 17% downtime is the equivalent of the whole park being down for over 112 minutes. It was basically like the park only being open for 9 hours instead of 11.
Attraction Downtime Worst Offenders
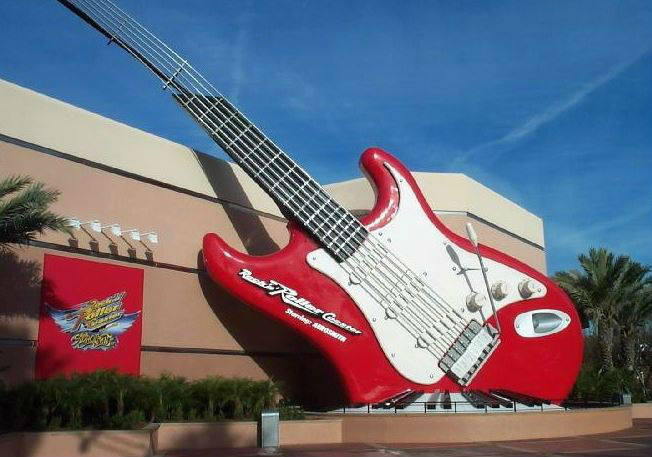
The worst offender of the past week was Rock’n’Roller Coaster, which was unexpectedly down for approximately 24% of the past week. Almost a quarter of the whole week! The worst day for Aerosmith fans was on July 16th, when it was unexpectedly down for 43% of the day. But there were quite a few days where it was down at the start of the day and took a quarter or a third of the day to wake up and come online.
Rope Drop Downtime
Here are this week’s problematic offenders:
- Magic Kingdom: Big Thunder Mountain Railroad (unavailable for 14% of its first hour of the day)
- EPCOT: Spaceship Earth (unavailable for 14% of its first hour of the day)
- Hollywood Studios: Rock’n’Roller Coaster (unavailable for 49% of its first hour of the day), Slinky Dog Dash (unavailable for 24% of its first hour of the day), Rise of the Resistance (unavailable for 23% of its first hour of the day)
- Animal Kingdom: DINOSAUR (unavailable for 14% of its first hour of the day)
This was a TERRIBLE week for rope drop downtime at Hollywood Studios. You’ve got three major attractions all down approximately a quarter of the time. Frequently all at once. And that pushes crowds to the attractions that are open, increasing wait times there. And when the headliners open, they get crushed with demand all at once. This is a lot of the reason we saw really high crowd levels at Hollywood Studios this week compared to the other parks.

Wait Times July 11 – 17
Attractions with the Highest Average Posted Wait at each park
- Animal Kingdom: Flight of Passage, average posted wait time of 98 minutes (89 minutes last week)
- Hollywood Studios: Slinky Dog Dash, average posted wait of 87 minutes (80 minutes last week)
- Magic Kingdom: Seven Dwarfs Mine Train, average posted wait time of 81 minutes (81 minutes last week)
- EPCOT: Test Track, average posted wait time of 58 minutes (Frozen Ever After at 59 minutes last week)
We’ve got two big increases this week, at Animal Kingdom and Hollywood Studios. If you read that downtime section above, this should not surprise you at all. These increases are not due to lots of crowds – they’re due to downtime pushing around crowds.

Parks with the Highest and Lowest Average Wait
These parks likely won’t change week-to-week unless something ridiculous happens, but these data points will give us a high-level view of how wait times are trending from week to week.
- Highest: Hollywood Studios, average park-wide posted wait of 43 minutes (37 minutes last week)
- Lowest: EPCOT, average park-wide posted wait of 23 minutes (22 minutes last week)
That six minute average increase at Hollywood Studios is significant. And once again, it’s thanks to all of that rope drop downtime pushing wait times up at attractions that were open. Ew. The EPCOT number shows that crowds really weren’t any higher this week overall.
Most Inflated Posted Wait Times
We all know that Disney inflates their posted wait times on purpose. They have many reasons for doing this. Some are totally understandable, and some are potentially more problematic. We can figure out how much posted wait times are being inflated by comparing submitted actual wait times from the Lines App and the posted wait time when the person timing their wait entered the line.
Over the past week, actual wait times in the Lines App averaged 64% of what was posted. This is very in line with our historical average. If the posted wait time was 60 minutes, you could’ve expected to wait just over 38 minutes instead.
But the worst offender for the past week is The Seas with Nemo and Friends. At this one attraction, submitted actual wait times were 35% of posted wait times in the past week. Wow! That means that if The Seas had a 20 minute posted wait, you probably would’ve waited just 7 minutes instead. Almost a third of what was posted. Remember to always check the Lines app for predicted actual waits instead of believing what is posted.
Actual Wait Time Rock Star
The Actual Wait Time Rock Star for the past week was giovaky, who submitted 41 actual wait times through the Lines App over the last 7 days! This includes 38 Standby waits and 3 virtual queue waits. Thank you for all of that timing, giovaky! You didn’t quite make it to the all-time record of 78 recorded wait times in a single week, currently held by psymonds.
Looking Ahead: July 18 – 24
Once again, we’ve got a boring week ahead of us. Or at least, Disney has a boring week ahead of it. No special events other than the normal extended evening options and H2O Glow. We’re even in the super-rare non-festival season at EPCOT.
The weather might mess with things a little this weekend, with plenty of afternoon thunderstorms in the forecast. Have an indoor option for your time between lunch and dinner!
Otherwise, crowds should stay in this moderate range through the end of the month, excluding any increases thanks to unexpected attraction downtime. Weekends are the best for Hollywood Studios and Magic Kingdom – and you should avoid Mondays at all costs.
You May Also Like...
-

We finally get to talk about July 4th! Seems odd now that we're about halfway through the week, and we've already…
-

Let's cut to the chase. We're in that beautiful time of the year where spring holidays are over and school is…
-

Usually I use this intro to write a few clever lines about the current season, and then tease the fact that…
-

Anyone else feel like you can finally breathe a sigh of relief now that the school year is over with all…
I was wondering if downtime for outdoor attractions due to rain and/or lightning in the area are included in the unexpected downtime amounts you cite?
Hi Bruce! Yes, weather-related downtime is included in that unexpected downtime.
Thanks… I was trying to get a feel on whether the downtime is only ride mechanical related. I wanted to get a sense on how much Disney may be delaying refurbs that would fix these issues.