
Disney Data Dump June 28 2023
Anyone else totally unprepared for the arrival of July? I suspect many other families must feel the same as me, because everyone is still sitting at home and forgetting to take their summer vacations. Or maybe they’ve all delayed them until August too. Or everyone has decided to travel to Disney in September? I hope not. Stay away from September. It’s mine! Now that we’re in late June, wait times should be getting closer to their peak for the summer. This week and next week will help us tell if we’re going to get up closer to normal summer crowds, or if it will be smooth sailing until the school year starts back up.
Observed Crowd Levels 6/20 – 6/26

Here we go again with our nice, uncrowded weekends. And even though we’re now solidly in late June, we’re still not seeing any overall crowd level 8s or 9s. I suspect some will finally sneak into the picture during that first week of July. But I’ve been wrong before. For now, moderate summer crowds are still the rule.

As always, things get more informative when we dig a little deeper (okay, that’s definitely the line that’s going on our Disney Data Dump group t-shirts). Animal Kingdom and EPCOT stay pretty steady through the whole week. But Hollywood Studios and Magic Kingdom are all over the place. Magic Kingdom peaked at a crowd level 9 on the 20th, and then steadily decreased down to a crowd level 3 on Sunday the 25th. A 6 crowd level difference is huge. Then it popped back up to a 7 on Monday. Hollywood Studios stayed more crowded throughout the week (including a crowd level 9 on Thursday the 22nd), but also hit its low of crowd level 4 over the weekend before bouncing back up to an 8 on Monday. If you are traveling any time between now and August, I would seriously consider prioritizing Hollywood Studios and Magic Kingdom for the weekend.
Performance of Crowd Level Predictions
Each week, I’m giving you a very transparent look into how our crowd level predictions performed. Each day at each park is one data point, so this week we have 28 different crowd level predictions to evaluate each week. Any time a prediction is within one or two crowd levels, things won’t really “feel” much different than what we predicted. Being off by 3 or more crowd levels is where we’d like to be more accurate because you might feel that difference in wait times throughout the day.

In the past week, Touring Plans predictions were either spot-on or within 1 crowd level 64% of the time. The highest that number has been in months! 85% of the time Touring Plans predictions were within 2 crowd levels, and that means we earn a solid B for our predictions this past week. And that’s because crowds are finally getting closer to what we would expect for this time of year. And because of a recent crowd calendar update. Another bonus – predictions are finally less skewed. We’re still overpredicting twice as much as we’re underpredicting, but that’s much more balanced than the past two months. The biggest miss of the past week over-predicted crowds by 5 crowd levels. That happened at Hollywood Studios on June 22nd, when Touring Plans predicted crowd level 9, and it ended up being a crowd level 4 day. Congratulations to those of you who have been paying attention to the pattern of the past couple of weeks and timed your Studios visit for a weekend.
Attraction Downtime 6/20 – 6/26
If we average out all of the capacity lost due to unexpected downtime over the past week, it comes out to 3.7% of attractions unexpectedly being down. The exact same as last week. Weird. The park with the biggest issues was Hollywood Studios, with 5.6% of its capacity lost due to unexpected downtime. And, Animal Kingdom was right behind at 5.1% downtime.
The worst day for attraction downtime in the past week was on June 21st. On that day, 6% of all capacity at WDW was lost due to unexpected downtime. The worst park-day of the week was at Hollywood Studios on June 20th. On that park day, 9% of the capacity at the park was lost due to unexpected downtime. Hollywood Studios was open for 12.5 hours on the 20th, so 9% downtime is the equivalent of the whole park being down for over 67 minutes. In a park with already-long lines, that is a big impact on crowds.
Attraction Downtime Worst Offenders
The worst offender of the past week was Rise of the Resistance (noooooooooooooo!), which was unexpectedly down for approximately 24% of the past week. The worst day for the empire was on June 21st, (typical – the dark side not appreciating the lightest day of the year) when they were unexpectedly down for 49% of the day. But the week-long reality is that there was only one day in the past week where the attraction had less than 20% downtime. That’s a LOT of downtime at a huge headliner and people-draw. Boo.

Rope Drop Downtime
Here are this week’s problematic offenders:
- Magic Kingdom: Haunted Mansion (unavailable for 34% of its first hour of the day), Space Mountain (unavailable for 28% of its first hour of the day), Seven Dwarfs Mine Train (unavailable for 13% of its first hour of the day)
- EPCOT: Frozen Ever After (unavailable for 15% of its first hour of the day), Spaceship Earth (unavailable for 13% of its first hour of the day)
- Hollywood Studios: Rock’n’Roller Coaster (unavailable for 48% of its first hour of the day), Rise of the Resistance (unavailable for 38% of its first hour of the day)
- Animal Kingdom: Kali River Rapids (unavailable for 14% of its first hour of the day), DINOSUAR (unavailable for 14% of its first hour of the day)
Not a good look, Disney. Not a good look. This is a long list, and it has a lot of headliners on it. Rise of the Resistance being down for more than a third of its opening hours is ridiculous. Rock’n’Roller Coaster, newly back from a refurbishment, being down for almost half of its early mornings is even worse. Then we’ve got Frozen problems (de-frosting problems?) at EPCOT, as well as unreliable coasters at Magic Kingdom. Always always have a back-up plan for your rope drop routine.

Wait Times 6/20 – 6/26
Attractions with the Highest Average Posted Wait at each park
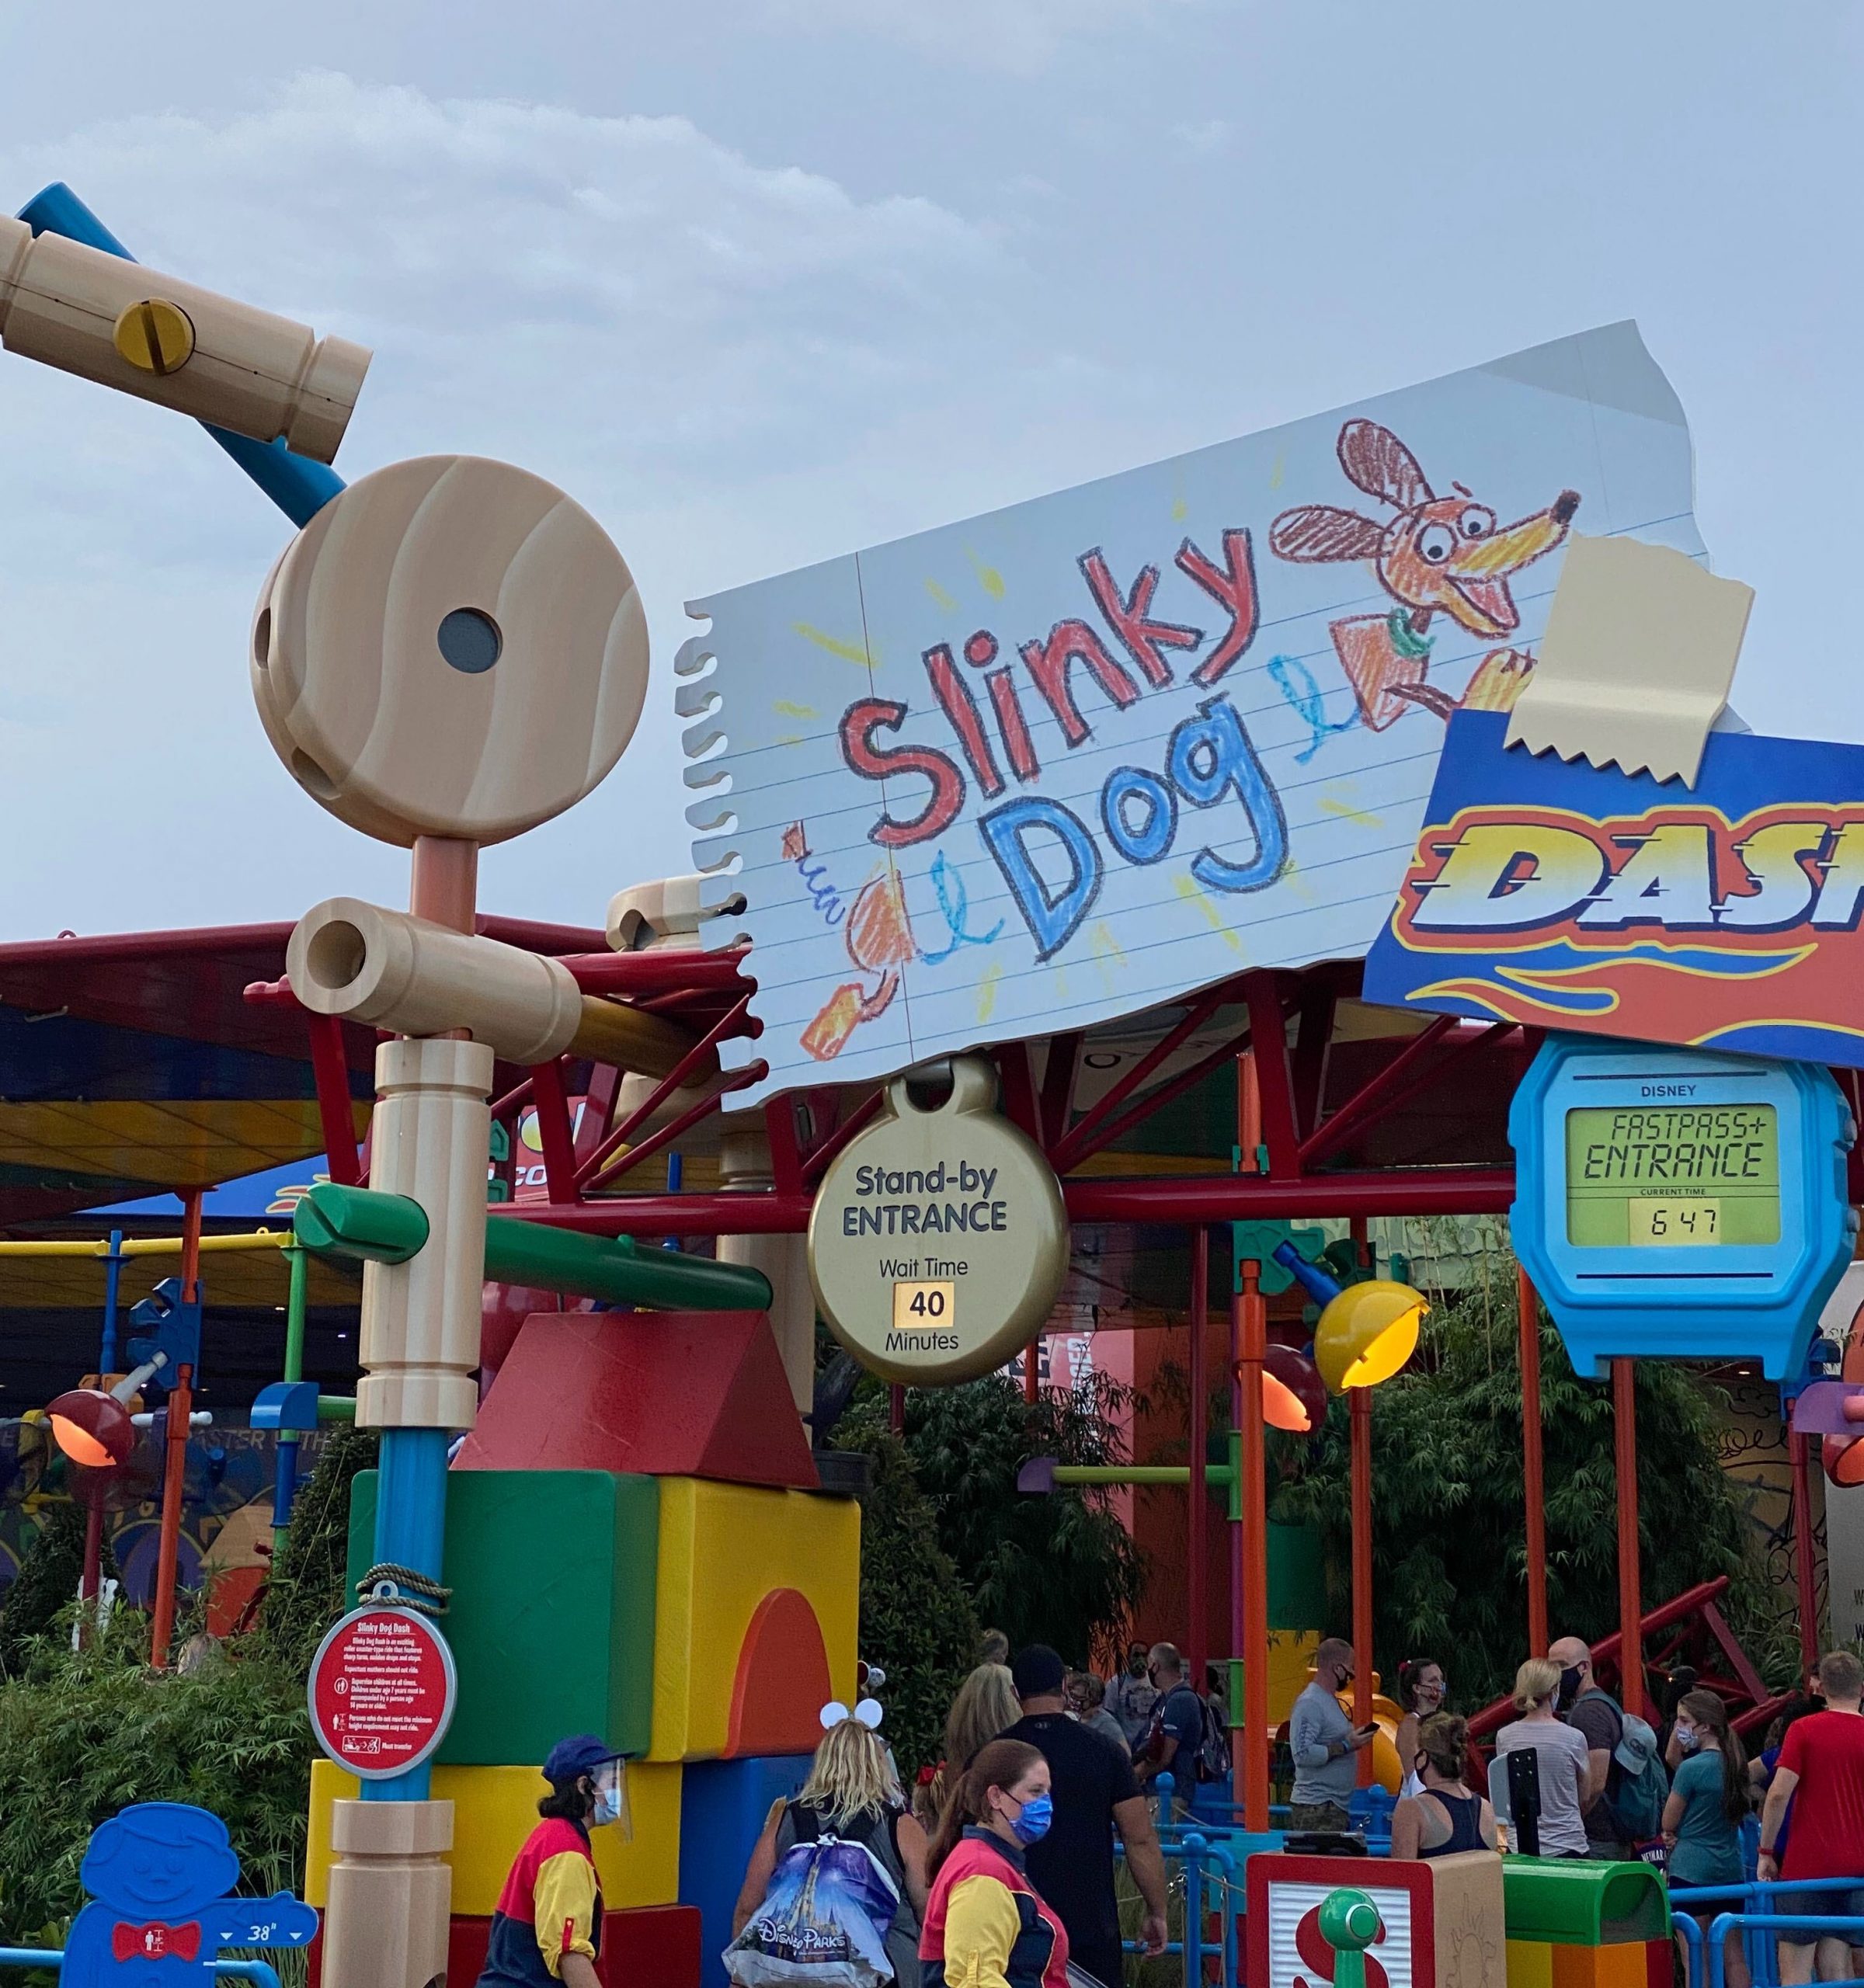
- Hollywood Studios: Slinky Dog Dash, average posted wait of 92 minutes (97 minutes last week)
- Animal Kingdom: Flight of Passage, average posted wait time of 101 minutes (84 minutes last week)
- EPCOT: Frozen Ever After, average posted wait time of 69 minutes (64 minutes last week)
- Magic Kingdom: Seven Dwarfs Mine Train, average posted wait time of 84 minutes (77 minutes last week)
Last week, wait times at Slinky Dog Dash popped up while everything else dipped. And this week we have the opposite. Because of course. That Slinky, always defying the norm. We haven’t seen the average posted wait time at Flight of Passage at or over triple digits in a long time. So while crowd levels haven’t gone up significantly, wait times at the most popular attractions are certainly edging upward.
Parks with the Highest and Lowest Average Wait
These parks likely won’t change week-to-week unless something ridiculous happens, but these data points will give us a high-level view of how wait times are trending from week to week.
- Highest: Hollywood Studios, average park-wide posted wait of 43 minutes (40 minutes last week)
- Lowest: EPCOT, average park-wide posted wait of 27 minutes (25 minutes last week)
More wait time increases. This isn’t surprising with Hollywood Studios hitting a crowd level 9 this week, and EPCOT even getting a rare 8!
Most Inflated Posted Wait Times
We all know that Disney inflates their posted wait times on purpose. They have many reasons for doing this. Some are totally understandable, and some are potentially more problematic. We can figure out how much posted wait times are being inflated by comparing submitted actual wait times from the Lines App and the posted wait time when the person timing their wait entered the line.
Over the past week, actual wait times in the Lines App averaged 65% of what was posted. This is slightly above our historical average. If the posted wait time was 60 minutes, you could’ve expected to wait only 39 minutes instead.
But the worst offender for the past week is Jungle Cruise. At this one attraction, submitted actual wait times were 37% of posted wait times in the past week. Wowzers. That means that if Jungle Cruise had a 60 minute posted wait, you probably would’ve waited just over 22 minutes instead. About a third of what was posted. Remember to always check the Lines app for predicted actual waits instead of believing what is posted.

Actual Wait Time Rock Star
The Actual Wait Time Rock Star for the past week was … beesly, who submitted 33 actual wait times through the Lines App over the last 7 days! This includes 4 Lightning Lane waits, 25 Standby waits, and 4 virtual queue waits. Thank you for all of that timing, beesly! You came pretty close to the all-time record of 50 recorded wait times in a single week, currently held by shop.kgb and ccsademko.
Looking Ahead: June 27th through July 3rd
The big weekend is upon us! This time next week we’ll be reviewing whether the summer peak is similar to past years, or a big flop. I would expect that crowds shouldn’t see as big of a roller-coaster this week like we’ve been seeing over the past month or so. Instead, more families should be arriving, ready for their big holiday. But if we still see crowd level 7s or 8s as our peak, then we’ll know that the rest of the summer should be a breeze!
Beside the holiday, weather should be sunny and hot this week, with afternoon storms rolling back in as we head into next week. Pack the sunscreen and portable fans!
You May Also Like...
-

Anyone else feel like you can finally breathe a sigh of relief now that the school year is over with all…
-

We've made it through another week, Disney data fans! And as we progress through June and march toward July with its…
-

We're halfway to the holidays! And while I don't like skipping over the summer ... those deals are pretty great. And…
-

In the world of Disney Data, this week was all good news. Wait times were the lowest we've seen since mid-September…