Disney World Crowd Report – October 12 to 18, 2014
Wait times were up last week resort-wide, especially at Disney Hollywood Studios and Magic Kingdom. Partially due to increased crowds and partially due to operational changes such as a temporary closing of Pirates of the Caribbean, the permanent closing of Backlot Tour and experiments with Fastpass Plus-only attractions. Animal Kingdom crowds came in at expected levels or lower all week so it is unlikely that attendance is up significantly.
Let’s look at how the crowd levels stacked up each day last week:
| WHAT WE THOUGHT |
WHAT WE SAW |
ANALYSIS | |
|---|---|---|---|
| Magic Kingdom |
6
|
8
|
Happy Touringplans #Everywhere Day! Touringplans.com employees travelled the globe to cover every Disney Destination and cruise ship worldwide on Sunday. At Walt Disney World, crowds came in higher than expected at every park except Animal Kingdom. Wait Times at Disney’s Hollywood Studios hit ’10’ out of ’10’ for Rock ‘n’ Roller Coaster (74 minutes), Great Movie Ride (32) and Toy Story Midway Mania (80). |
| Epcot |
5
|
6
|
|
| Hollywood Studios |
6
|
9
|
|
| Animal Kingdom |
7
|
7
|
|
| WHAT WE THOUGHT |
WHAT WE SAW |
ANALYSIS | |
| Magic Kingdom |
4
|
4
|
Columbus Day ranks very low on the list of crowded holidays at the parks as evidenced by our correct prediction of the crowd level ‘4’ at Magic Kingdom this year. The Studios had another day of high wait times which is less likely due to the holiday and more likely to the redistributions of crowds at that park. Despite the park wide level ‘9’, Tower of Terror only had an average of 49 minutes (predicted 66). |
| Epcot |
7
|
7
|
|
| Hollywood Studios |
4
|
9
|
|
| Animal Kingdom |
6
|
7
|
|
| WHAT WE THOUGHT |
WHAT WE SAW |
ANALYSIS | |
| Magic Kingdom |
5
|
7
|
Pirates of the Caribbean at Magic Kingdom was down for unscheduled maintenance on Tuesday and Thursday last week which may have pushed wait times a little higher at neighboring attractions like Jungle Cruise (53 minutes, predicted 40). |
| Epcot |
5
|
5
|
|
| Hollywood Studios |
4
|
6
|
|
| Animal Kingdom |
6
|
3
|
|
| WHAT WE THOUGHT |
WHAT WE SAW |
ANALYSIS | |
| Magic Kingdom |
6
|
6
|
It is rare to see three parks hit high crowd numbers while one park remains low but that’s what happened on Wednesday. Epcot and The Studios continue to average higher wait times that history would suggest while Animal Kingdom saw most attractions stay around 15 minutes on average. |
| Epcot |
4
|
7
|
|
| Hollywood Studios |
5
|
7
|
|
| Animal Kingdom |
4
|
2
|
|
| WHAT WE THOUGHT |
WHAT WE SAW |
ANALYSIS | |
| Magic Kingdom |
3
|
6
|
Magic Kingdom hosted a Mickey’s Not-So-Scary Halloween Party on Thursday but despite the shortened hours for daytime guests, wait times stayed above average. Similar to Tuesday, this was likely partially due to Pirates of the Caribbean’s temporary closure. |
| Epcot |
6
|
7
|
|
| Hollywood Studios |
4
|
5
|
|
| Animal Kingdom |
5
|
6
|
|
| WHAT WE THOUGHT |
WHAT WE SAW |
ANALYSIS | |
| Magic Kingdom |
4
|
4
|
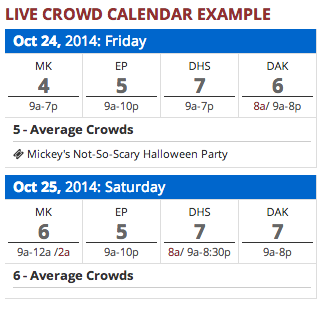
Another Halloween party on Friday but this time crowds stayed below average as expected with wait times like 31 at Big Thunder Mountain Railroad and 37 and Space Mountain and Splash Mountain. |
| Epcot |
7
|
6
|
|
| Hollywood Studios |
6
|
8
|
|
| Animal Kingdom |
6
|
7
|
|
| WHAT WE THOUGHT |
WHAT WE SAW |
ANALYSIS | |
| Magic Kingdom |
6
|
7
|
Saturdays predictions were the best of the week with each coming in within one index level of what we observed. The ‘8’ at The Studios capped off a week of higher than usual wait times, mostly at Great Movie Ride, Toy Story Midway Mania and Rock ‘n’ Roller Coaster. |
| Epcot |
5
|
6
|
|
| Hollywood Studios |
7
|
8
|
|
| Animal Kingdom |
7
|
7
|
|
| October 19 to 25, 2014 |
|---|
Next week is the final week before Halloween arrives so we expect the festive feel of the parks to intensify. Crowds will be steady.
To see Walt Disney World Crowd predictions for the days of your vacation, check the Crowd Calendar.![]()
To get details about our predictions of future crowds or details about crowds in the past check out the Crowd Calendar and select “Jump to Date” on the left margin.
You May Also Like...
-

This weekend will have the longest park hours since Walt Disney World re-opened in July. Extended park hours are a signal…
-
The April Crowd Calendar update only has minor changes. We are halfway through spring break, and crowd levels have been in-line…
-
We have been holding off on doing any big Crowd Calendar updates until we saw how the crowds were in 2021.…
-

The February 2020 Crowd Calendar update is now live. So far 2020 is showing increased crowds at Walt Disney World. We…
Very interesting. This is the first time we’ll be there in Nov. We’ve been in Oct and Dec neither of which were horrible. I’ve heard it said there aren’t really any “off-peak” times anymore just less off-peak 😐
I was there from 10/18 to 10/23 and the crowds seemed much larger than last year. Wed, 10/22, the Magic Kingdom was packed with wait time of 60 minutes or more at Haunted Mansion, Pirates, and It’s a Small World.
Well, Jason and Matthew, my family will be there the same week too, and I know four other families going then…I am freaking out! I thought the week before Thanksgiving was supposed to be a slow time! EEEEEEEEEEEK!
So do you think there was anyone one particular event that accounted for the higher crowds? We are heading that way the week before Thanksgiving and I wonder what the crowds will be like.
I have the very same question because I will be at the parks the same week.