How Accurate Are Our Wait-Time Estimates? There’s a Spreadsheet, Of Course.
The most important set of predictions we make is probably “How long is this actual wait in line going to be?” at any ride, any time, any day. It’s the data on which our touring plans and crowd calendar are built.
Those predictions are made by two separate internal systems:
- The interday process, which predicts wait times from 1 to 365 days in advance.
- The intraday process, which updates those forecasts for “today” once the park opens, every few minutes.
The intraday process is there to handle things we can’t predict in advance, like ride downtime. For example, Slinky Dog Dash was down at rope drop in Hollywood Studios around 18% of the time last month, a little more than one day per week. When that downtime extends into regular park hours it affects the Lightning Lane return times, which increases waits in the Standby lines. We can’t predict that outage in advance, so the intraday process helps adjust our wait-time estimates once we see it.
Those updated estimated wait times are shown in our Lines app and our touring plans, which is why we suggest using the Lines app in the parks.
Whose Estimated Wait Time Was Closer, Us or Disney/Universal?
Our Lines app allows you to time your actual wait in line, and we get tons of those actual wait times every day from folks in every Disney and Universal park.
For every actual wait time you send in, we attach three pieces of data:
- The time of day you got in line at the ride
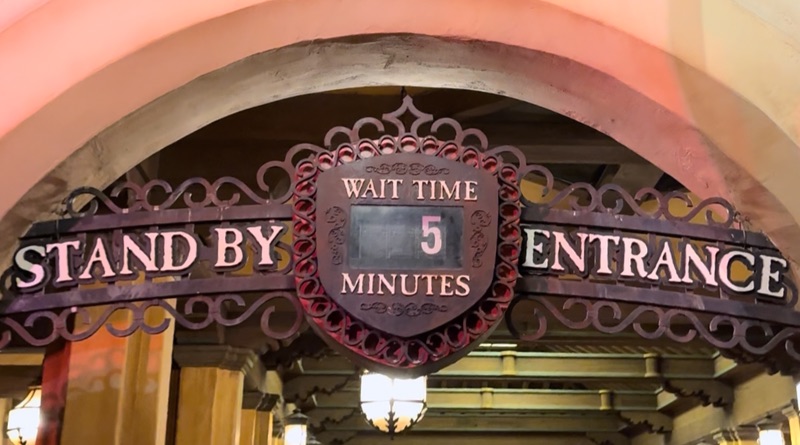
- The posted wait time displayed on the sign at the line entrance
- Our intraday-adjusted estimate of the actual wait
So the basic measure of accuracy is the question: Whose wait-time estimate was closer to how long you actually waited in line, TouringPlans or Disney/Universal?
Of Course There’s A Spreadsheet!
As you can imagine, we have a spreadsheet that tracks this. You can see one here. It runs nightly and covers all the actual wait times we’ve got for the past 30 days.
The report captures our prediction accuracy at various levels of detail:
- By resort, e.g., Walt Disney World, Disneyland, Universal Orlando
- By park, e.g., Magic Kingdom, Epic Universe, Disney California Adventure
- By ride
- By time of day, both overall and in 15-minute buckets throughout the day
Here’s an example from that report at the resort level:
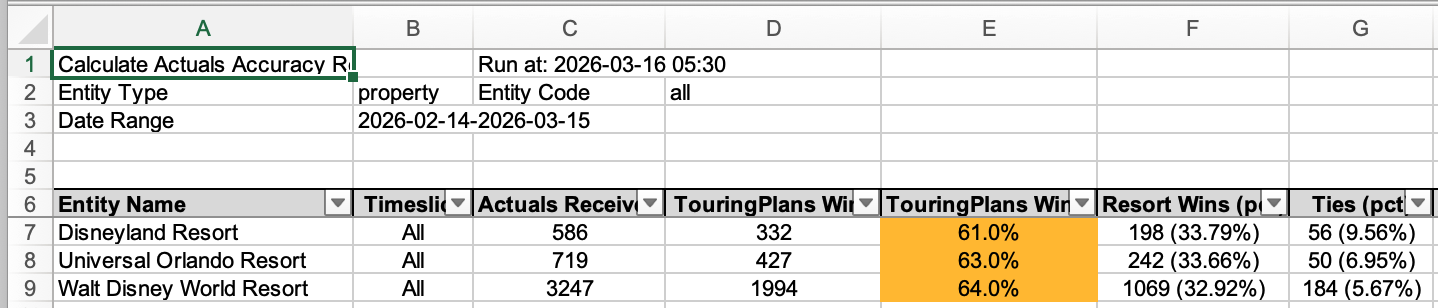
So over the last 30 days we’ve received 586 + 719 + 3,246 = 4,552 actual wait times. At Walt Disney World, our estimated wait was more accurate than the ride’s posted wait 64% of the time, and we tied another 5.7% of the time. At Universal Orlando it was 63% with 7% ties, and at Disneyland it was 61% with 9.6% ties. So roughly 70% of the time at any resort, our wait-time estimates are as good or better than the posted waits.
Our goal is a 70% win rate excluding ties, and we’re making steady progress towards that number.
Why isn’t the goal 100%? One reason is that Disney and Universal know things like “this ride just broke down” and “this ride is about to re-open” slightly faster than we do, and can adjust their posted waits faster.
A second reason is that we hold off adjusting our estimates when we see sudden, wild swings in wait times. For example, at Tower of Terror last weekend, the posted wait time went jumped from 60 minutes to 100 minutes in the span of 60 seconds starting at 2:33 pm:
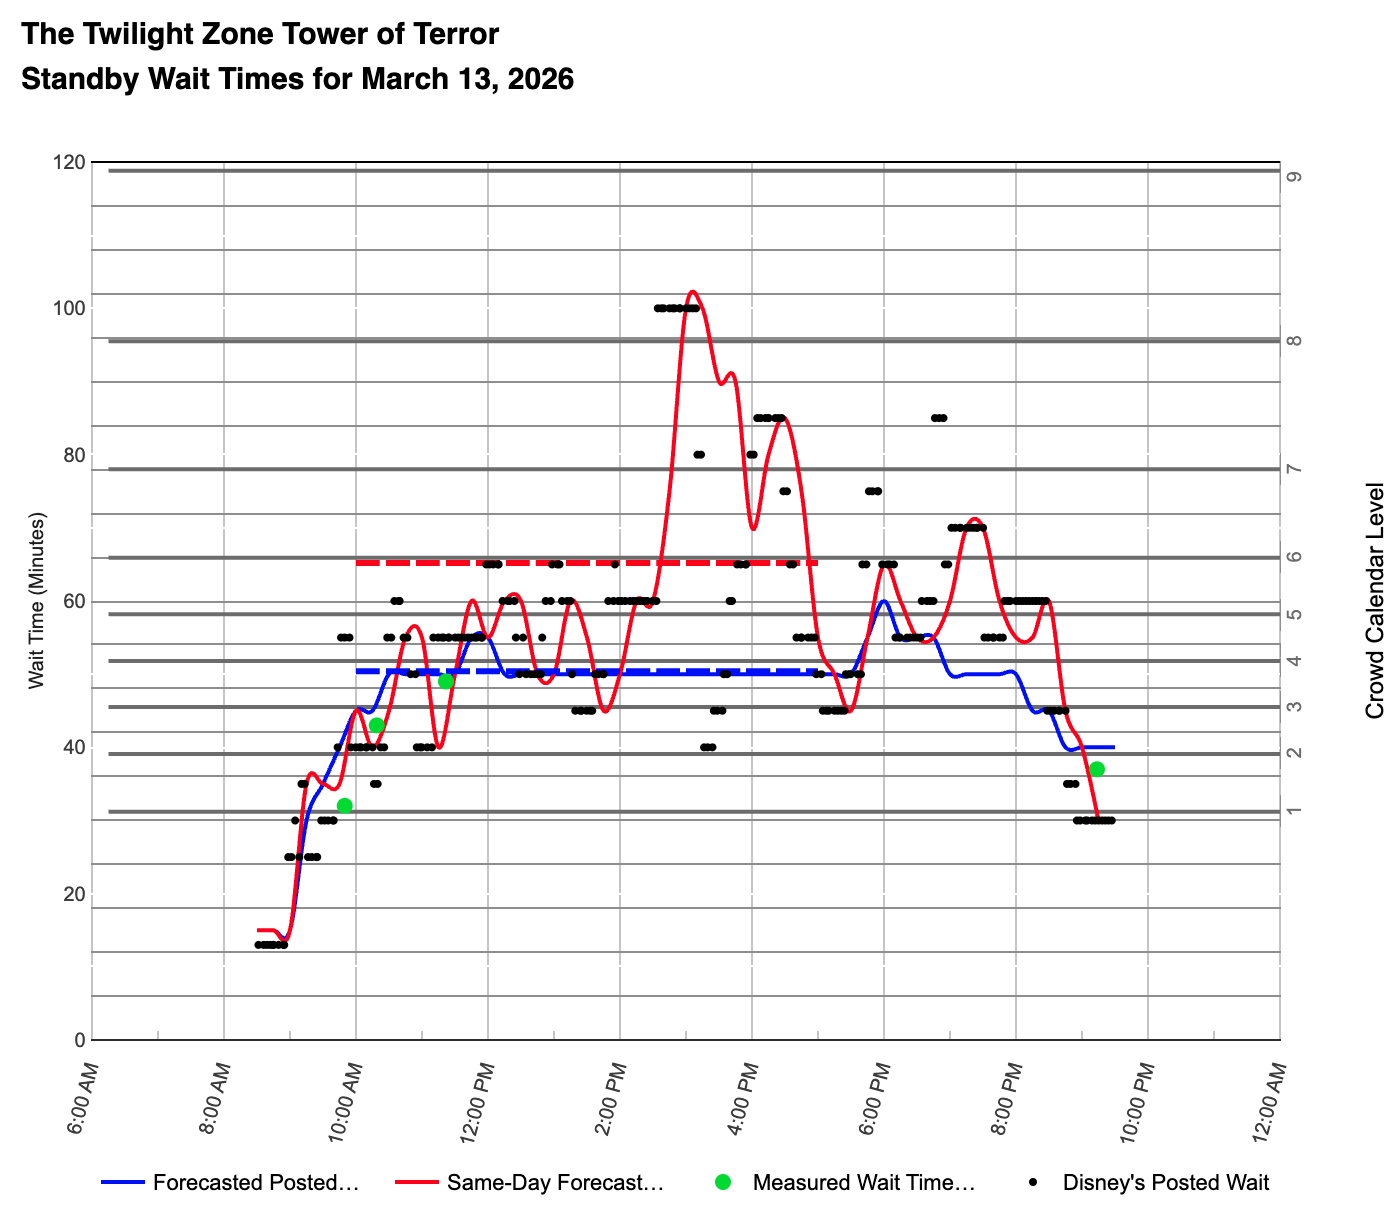
Tower of Terror can handle around 1,450 guests per hour, which we know because we’ve counted the number of people exiting the ride for days on end. If that 40 minute jump were true, it would mean roughly 960 people got in line in 60 seconds. Large groups just don’t move that fast, so at least one of those posted waits was wrong.
Likewise, Tower’s posted wait dropped from 100 minutes to 40 minutes in the span of 60 seconds starting at 3:15 p.m. That’s simply not possible, so again, at least one of those posted waits was wrong.
When we see large changes like that, we typically wait up to 10 minutes to get additional wait times to confirm what’s happening. And we make gradual adjustments in that time, not big jumps, because we know lines can’t really move that fast.
The report has additional columns that show the percent of time we’re over- and under-predicting those waits. This helps us adjust our wait-time models, even when it’s only for certain parts of the day.
Where We Do Well (and Less Well)
Our wait-time predictions do really well at the parks’ most popular rides, especially in the first couple of hours the park is open. For example, here’s the Magic Kingdom:
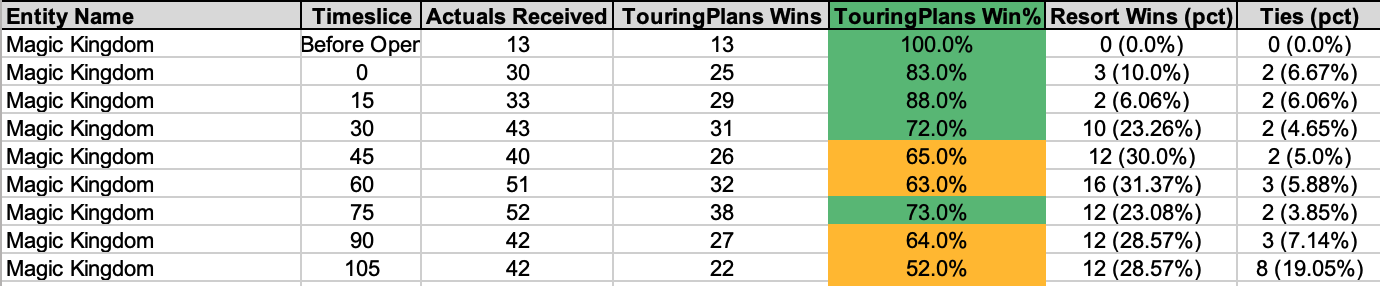
“Before Opening” includes any actual wait-times we collect before the official start of the park’s Early Theme Park Entry (ETPE) period. So if the park’s ETPE begins at 8:30 a.m. but Seven Dwarfs Mine Train opens ten minutes early, at 8:20 a.m., any actual waits we collect between then and 8:30 go into that bucket.
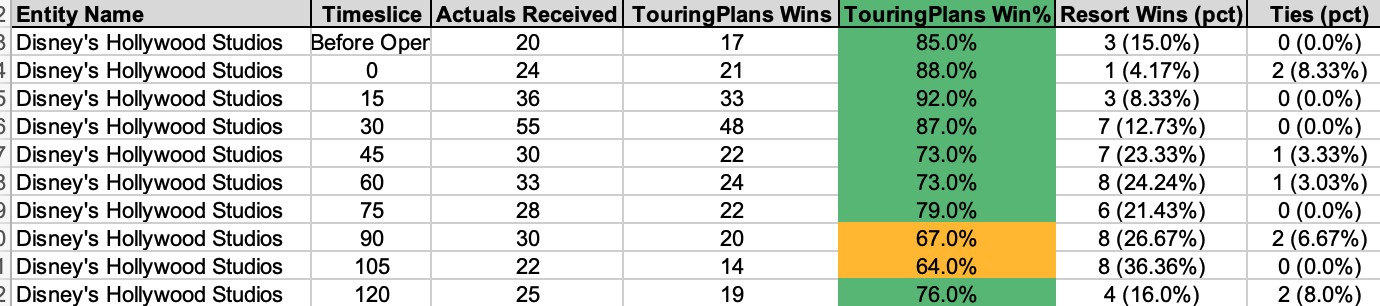
Here’s Hollywood Studios as another example:
We perform less well at minor attractions, especially in the early morning. An example is Gadget’s Go Coaster in Disneyland’s Toontown:
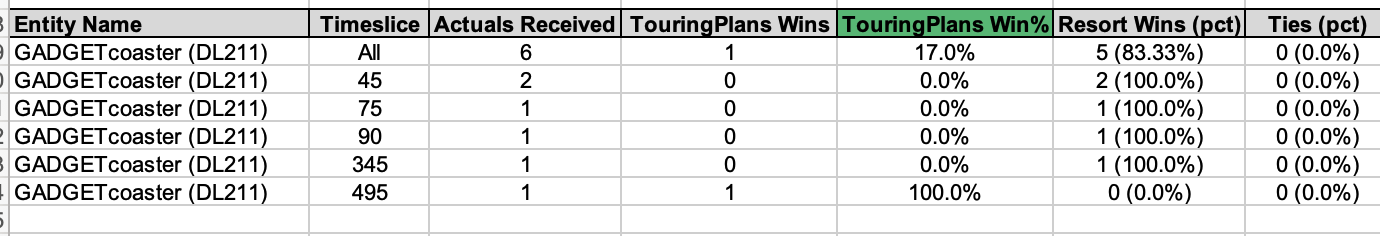
Very few people tend to visit these rides early in the day, so we don’t have the same level of data for those as we do for other rides. To fix this for future updates, we’re asking our team to ride these attractions early in the morning so we can collect more data.
The good news is that when we’re off, we’re less wrong than the parks are when they’re wrong. And we’re usually off by under 10 minutes in those cases.
Future Updates
That’s a look at how we determine our wait-time accuracy and make model updates.
Let us know in the comments below if you’re interested in seeing this report on a monthly basis, or if there’s anything we can add to make it better.
You May Also Like...
-

We spent 2 hours and 48 minutes of the 5 hour party in line for characters at the second Jollywood Nights…
-

TouringPlans Subscribers (Liners) have submitted 45,197 actual wait times for Walt Disney World and Disneyland Resort since May of this year!…
I would think that once that second shaft opens Mickey’s 100 min is rendered inaccurate bc circumstances have changed. The line is now moving twice as fast and he is the lucky beneficiary.
Len
Very much interested in all the models stuff ! I realise I might be alone there but I find it really good to understand what lies behind the number
How do you account for the wait times for a ride reopening when they have changed the ride during the downtime? I’m particularly interested in the upcoming Buzz Lightyear.
For Buzz we’re adjusting the park-wide crowd level and the individual attraction crowd level manually. We’ve tried looking at historical data around ride openings, but it doesn’t happen frequently so there’s not a lot of data on it.
Here’s a file that contains the metadata we track for each wait time we save: https://www.dropbox.com/scl/fi/6d5ny50d8z1co6tcmof2l/touringplans_data_dictionary.xlsx?rlkey=pju6d0ia29je503mcomg7ivw8&dl=0
Hi! I love when you get into the nitty-gritty stuff like this!
“The intraday process is there to handle things we can’t predict in advance, like ride downtime.” — I didn’t think that TP’s models were necessarily “best case scenario” (no unexpected downtime), but this made me question that assumption. Does the model factor in some downtime based on past performance, or no? Thanks!
The interday models exclude days with significant downtime. (I can look up the threshold but it’s something like high single digits of downtime % per day). So those models should take into account smaller bits of downtime throughout the day.
The intraday process is there for when we know a specific ride is not operating right now.
That makes sense. Thanks!
I remember you said the adjusted models would be evaluated mid march and potentiel changes were to be expected on future dates.
Is that still true ?
Hey Anne! Yes, I did some model updates earlier this month based on this report. In Disneyland the big ones were Pirates, Haunted Mansion, and Space Mountain. In WDW the tricky one was, if you can believe it, Living with the Land! Something about those morning posted wait times was really wonky. You’d think farmers would be used to those early hours. 🙂
Great ! Should we expect more updates ?
Oh yeah. I have a recurring calendar task to check the report and make model adjustments once per month. I can post something to the blog when that’s done – I wasn’t sure anyone would be interested.
For rides like tower of terror or Toy Story Mania, I’ve always thought about massive rapid swings in wait time due to the open/close of a “track.”
Does your model account for that scenario? That’s how I’d believe a doubling in wait time from Disney.
Hi Rex! The intraday model would pick that up, yes. There’d still be the question of why that’s happening in the middle of the day, especially if there’s already a decent line built up. That is, why would we intentionally close a track/shaft in the middle of the day when there’s already a 40-minute wait?
I don’t think it’s a matter of Disney intentionally closing a track/shaft in the middle of the day. It may be a matter of Disney quickly adjusting the anticipated wait time when a track/shaft does down (or reopens after being down) in the middle of the day. That could explain why MDE’s wait times can jump up or down by amounts that otherwise don’t make sense based on the ride’s hourly capacity. Maybe 960 people didn’t jump in the line for Tower of Terror. Maybe one elevator just went down.
Hey Tom! Yeah, I can see that __increase__ happening if a ride goes down. The corresponding drop in waits from 100 minutes to 40 minutes in 60 seconds still baffles me. Let’s assume both times are accurate. And let’s assume our friend Mickey gets in line at 3:15 p.m., when the wait is 100 minutes. That means Mickey will board the ride 100 minutes later, at 4:55 p.m.
Our friend Minnie gets in line 60 seconds after Mickey, at 3:16 p.m., when the posted wait has changed to 40 minutes. That means Minnie will board the ride 40 minutes later, at 3:56 p.m. So Minnie gets in line after Mickey but gets off the ride before Mickey.
That breaks a fundamental assumption about how lines work: the “no-passing principle” (cite: https://www.sciencedirect.com/science/article/abs/pii/S0377221799000351). I’m sure we can come up with unusual circumstances to explain it away once in a while. But this sort of thing happens every day, so the best explanation is that some of the posted waits are wrong.