
Disney Data Dump August 30 2023
The beginning of fall at Walt Disney World is throwing some interesting data our way! We have new party season behavior compared to last year. A hurricane is doing what hurricanes do and potentially keeping some travelers away. More schools in session means fewer families taking vacations. And rope drop downtime is throwing off the best-laid early entry plans. Read on for all of the stats you need to know!
Observed Crowd Levels August 22 – 28

Now if that isn’t just the most beautiful crowd trend you’ve ever seen, I don’t know what is. As someone with a trip planned next week, this looks like a gorgeous wrap on the moderate crowds we saw this summer, and a smooth transition to the low crowds of September. We’ll see if it holds true in the coming days!

Hollywood Studios has been weird and spikey for a while. In fact, it reliably jumps up by 2+ crowd levels on Magic Kingdom party days. That’s new behavior for this year! Last year, non-MK parks seemed to magically absorb the party day crowds. This year, they’re almost all going to Hollywood Studios and really bogging things down at this park. So my party day soap box is expanding! Absolutely you should visit Magic Kingdom on party days. And absolutely you should not visit Hollywood Studios on party days.
Performance of Crowd Level Predictions
Each week, I’m giving you a very transparent look into how our crowd level predictions performed. Each day at each park is one data point, so this week we have 28 different crowd level predictions to evaluate each week. Any time a prediction is within one or two crowd levels, things won’t really “feel” much different than what we predicted. Being off by 3 or more crowd levels is where we’d like to be more accurate because you might feel that difference in wait times throughout the day.

In the past two weeks, Touring Plans predictions were either spot-on or within 1 crowd level 82% of the time. Still trending with really solid predictions after the crowd calendar update this summer. 96% of the time Touring Plans predictions were within 2 crowd levels, and that means we earn an A for our predictions this past week. The biggest miss of the past two weeks underestimated crowds by a whopping FIVE crowd levels, and that happened at Magic Kingdom on August 23rd, when Touring Plans predicted a crowd level 2, which ended up actually being a crowd level 7. If you were/are a well-read Disney Data Dump regular, you should have been somewhat prepared for this miss, because it’s a day after a party, and it had extended evening hours. It drew in ALL of the people.
Attraction Downtime August 22 – 28
If we average all of the capacity lost due to unexpected downtime over the past week, it comes out to 4.9% of attractions unexpectedly being down. Exactly the same as last week. The park with the biggest issues was easily Hollywood Studios, with 7.7% of its capacity lost due to unexpected downtime. One of the biggest park-wide numbers we’ve seen since I started tracking this metric.
The worst day for attraction downtime in the past week was on August 25th. On that day, 9% of all capacity at WDW was lost due to unexpected downtime. The worst park-day of the week was at Hollywood Studios on August 25th. On that park day, an awful 15% of the capacity was lost at Hollywood Studios due to unexpected downtime. Hollywood Studios was open for 12.5 hours on the 25th, so 15% downtime is the equivalent of the whole park being down for over 112 minutes. It’s close to the entire park opening two hours late or closing two hours early. That’s a LOT of downtime.
Attraction Downtime Worst Offenders
The worst offender of the past week was Pirates of the Caribbean, which was unexpectedly down for 23% of the past week. Almost a quarter of the whole week! Yesterday I highlighted Pirates as one of the attractions with the most rope drop downtime so far this year. And it’s “won” this overall downtime category too many times. Someone needs to whip those pirates into shape. The worst day for Pirates was on August 25th, when it was down all the live-long day, until around 4:30 in the afternoon. The park closed at 6 pm that day to non-party guests, so anyone interested in riding had about 90 minutes to do so.

Rope Drop Downtime
Buckle in. It’s a long one today. Here are this week’s problematic offenders:
- Magic Kingdom: Pirates of the Caribbean (unavailable for 39% of its first hour of the day), Jungle Cruise (unavailable for 22% of its first hour of the day), Barnstormer (unavailable for 17% of its first hour of the day), Mad Tea Party (unavailable for 14% of its first hour of the day), TTA PeopleMover (unavailable for 13% of its first hour of the day)
- EPCOT: Test Track (unavailable for 30% of its first hour of the day), Frozen Ever After (unavailable for 16% of its first hour of the day)
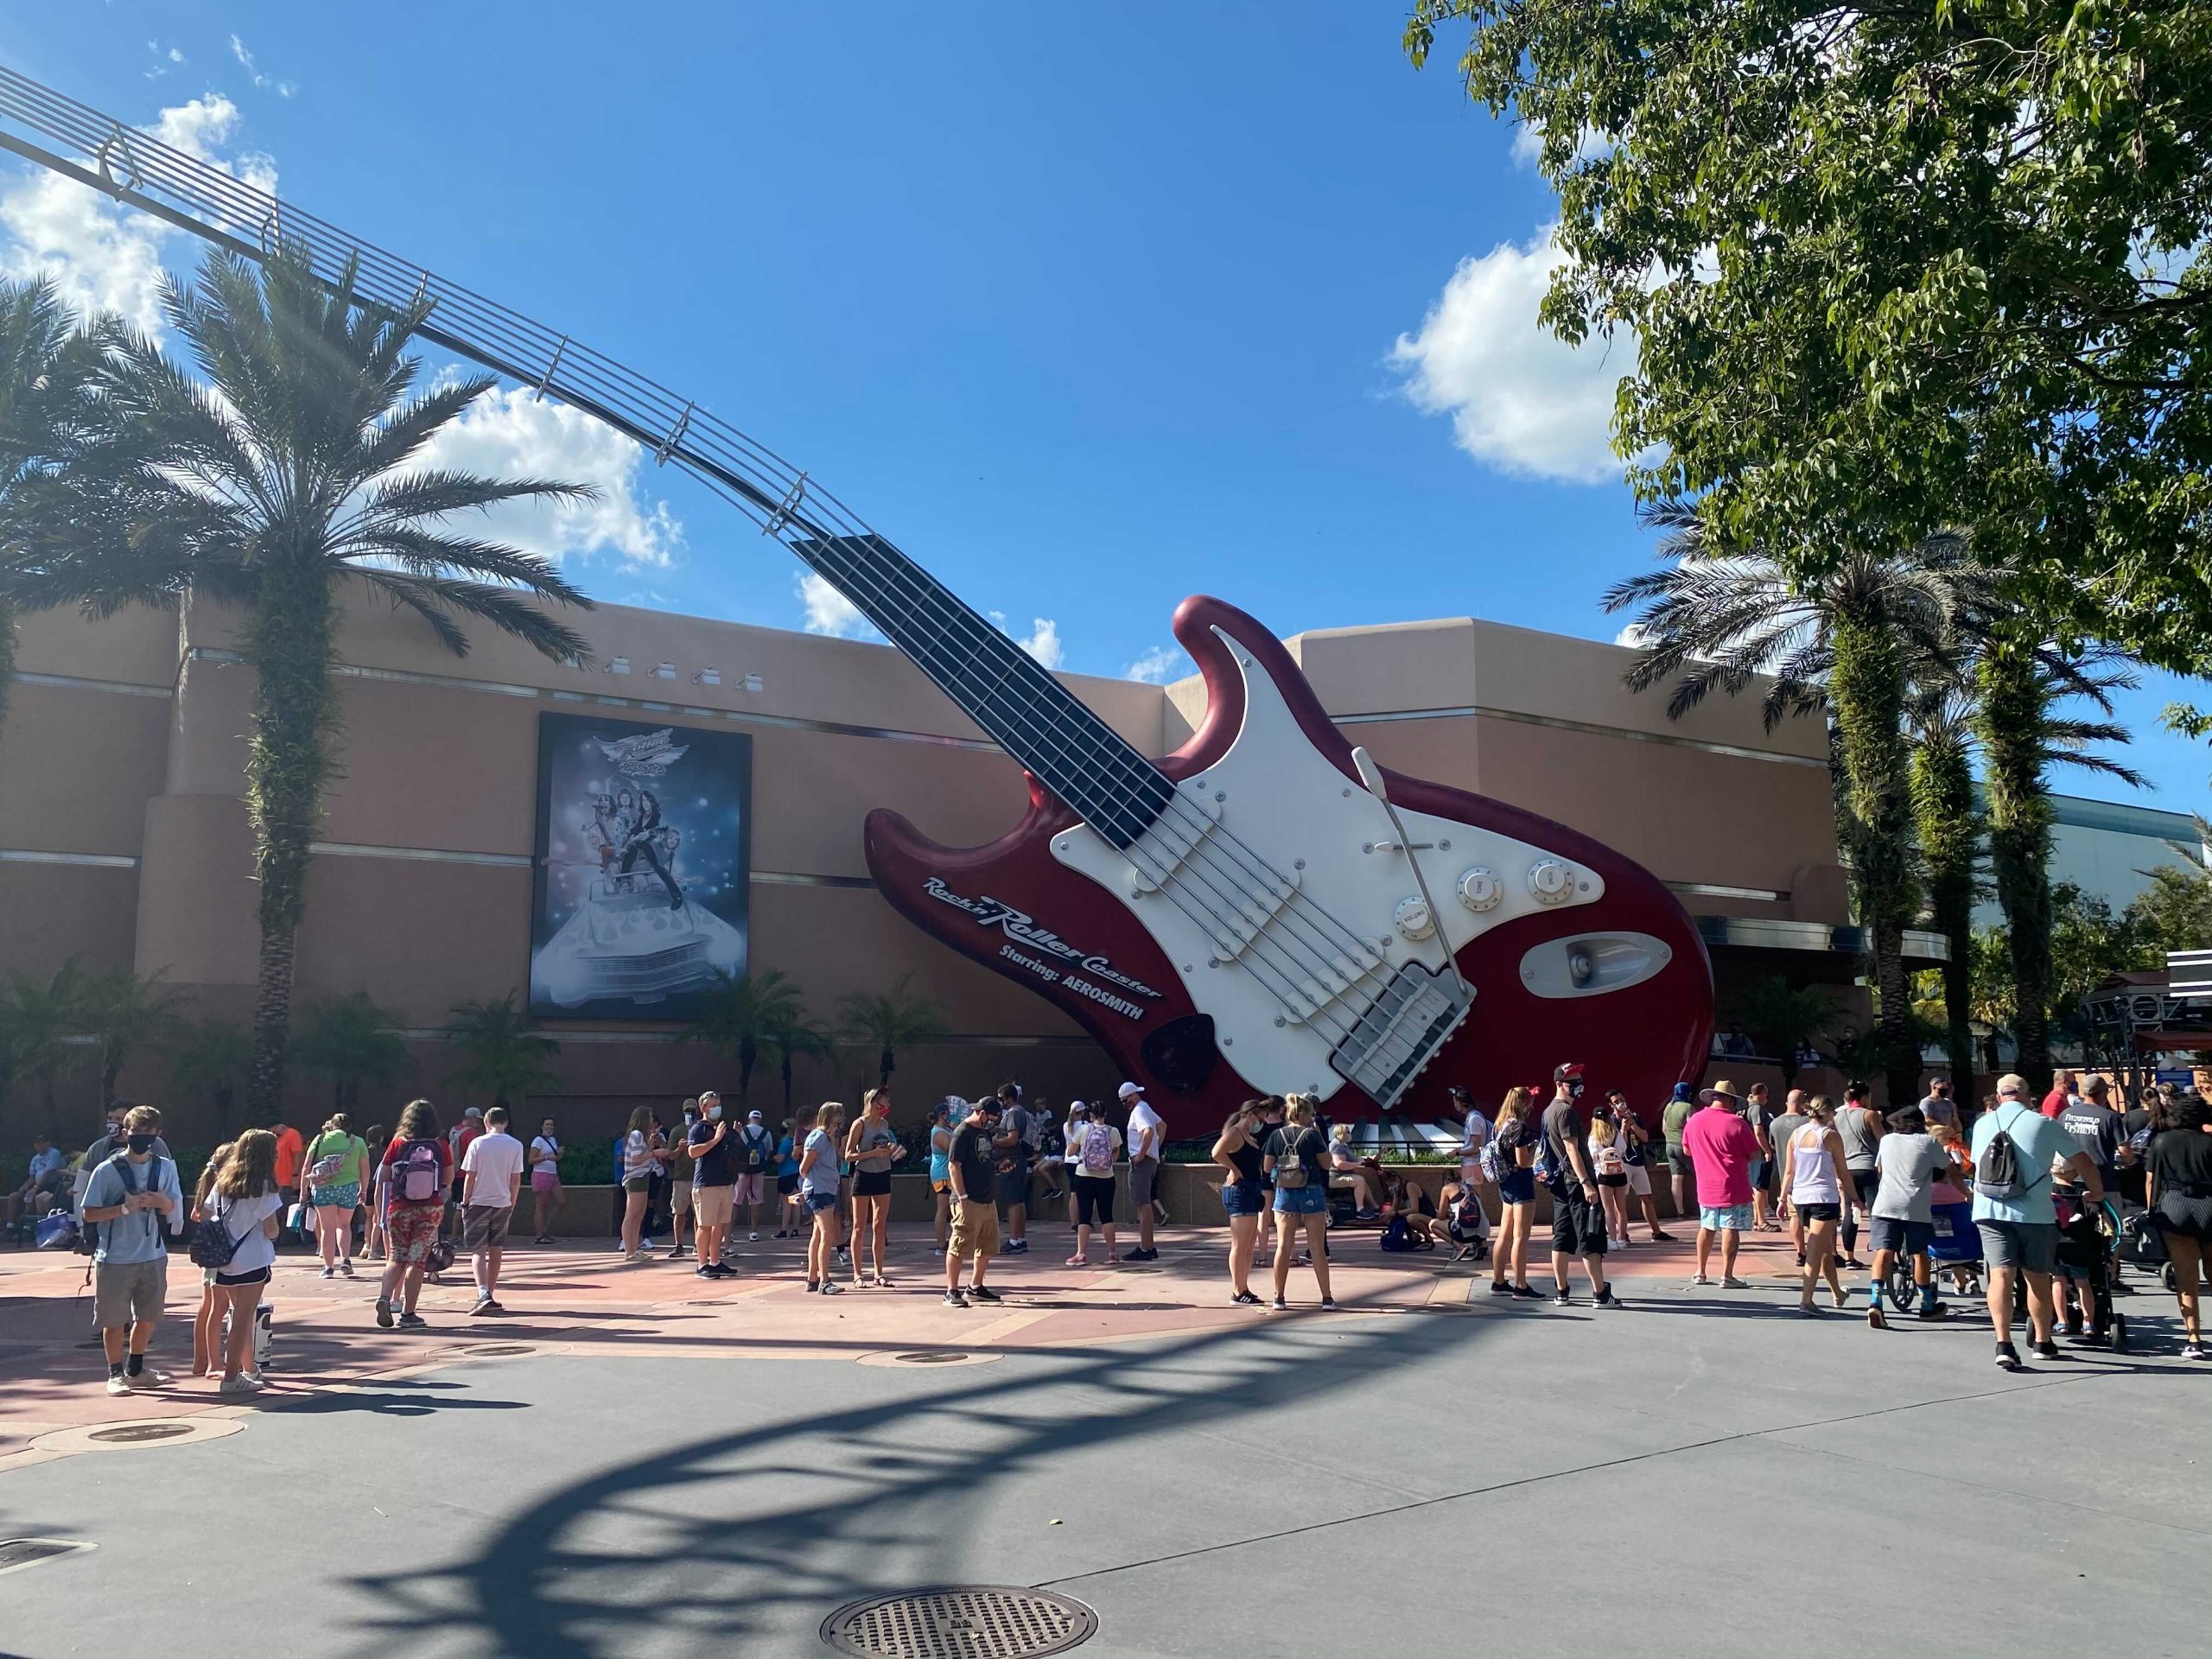
- Hollywood Studios: Rock’n’Roller Coaster (unavailable for 50% of its first hour of the day), Tower of Terror (unavailable for 21% of its first hour of the day)
- Animal Kingdom: Expedition Everest (unavailable for 20% of its first hour of the day)
I am too upset to even write commentary about this. Just kidding. Let me vent my frustrations. First, just yesterday I cited Jungle Cruise and Tower of Terror and relatively reliable rope drop options. Because statistically for the year they ARE. And then this week they just totally flail. It’s a personal attack. 😉
Then look at the sheer size of this list. This is too many attractions with early downtime. And a lot of the percentages are really really high! Pirates and Jungle Cruise both being down is a double-whammy to regular rope droppers at Magic Kingdom. Test Track and Frozen Ever After both being down at EPCOT just kills any chance of a productive early morning at that park. Rock’n’Roller Coaster and Tower of Terror means quite a few people probably did a lot of unnecessary steps on Sunset Boulevard that day. Let’s hope this starts trending better.
Wait Times August 22 – 28
Attractions with the Highest Average Posted Wait at each park
- Animal Kingdom: Flight of Passage, average posted wait time of 84 minutes (83 minutes last week)
- Hollywood Studios: Slinky Dog Dash, average posted wait of 83 minutes (84 minutes last week)
- Magic Kingdom: Seven Dwarfs Mine Train, average posted wait time of 64 minutes (65 minutes last week)
- EPCOT: Frozen Ever After, average posted wait time of 64 minutes (65 minutes last week)
Well that was boring. Everything is within a margin of error to being the exact same as last week. Maybe with a slightly downward bias. I’ll take it.
Parks with the Highest and Lowest Average Wait
These parks likely won’t change week-to-week unless something ridiculous happens, but these data points will give us a high-level view of how wait times are trending from week to week.
- Highest: Hollywood Studios, average park-wide posted wait of 40 minutes (38 minutes last week)
- Lowest: Magic Kingdom, average park-wide posted wait of 23 minutes (24 minutes last week)
This week, wait times at Hollywood Studios were slightly up compared to last week. I fully attribute this to increased downtime and increased crowds on Magic Kingdom party days. Magic Kingdom and EPCOT actually basically tied for the lowest park-wide average wait time.
Most Inflated Posted Wait Times
We all know that Disney inflates their posted wait times on purpose. They have many reasons for doing this. Some are totally understandable, and some are potentially more problematic. We can figure out how much posted wait times are being inflated by comparing submitted actual wait times from the Lines App and the posted wait time when the person timing their wait entered the line.
Over the past week, actual wait times in the Lines App averaged 66% of what was posted. This is very in line with our historical average. If the posted wait time was 60 minutes, you could’ve expected to wait under 40 minutes instead.
But the worst offender for the past week is Peter Pan’s Flight. At this one attraction, submitted actual wait times were 40% of posted wait times in the past week. That means that if Peter Pan had a 60 minute posted wait (which isn’t unusual), you probably would’ve waited just 24 minutes instead. Less than half of what was posted. Remember to always check the Lines app for predicted actual waits instead of believing what is posted.

Actual Wait Time Rock Star
The Actual Wait Time Rock Star for the past week was … jayhanna34, who submitted 36 actual wait times through the Lines App over the last 7 days! This includes 33 Standby waits and 3 virtual queue waits. Thank you for all of that timing, jayhanna34! You didn’t quite make it to the all-time record of 78 recorded wait times in a single week, currently held by psymonds.
Looking Ahead: August 29 – September 11
This is a bigger look-ahead than normal, because this is the time of year when all of the smart crowd-avoiders head down to Disney World. On a totally unrelated note, my family will be in Disney World next week, so I won’t have time to write up this post. Too busy crushing our park days rope drop to park close. As a side note, if any of you fellow Disney data fans are in the parks next week and you spot our family of redheads, be sure to stop me and say hello!
In the short term, there’s a hurricane barreling toward Orlando. I don’t expect this to have too much impact on WDW operations because it looks like things are tracking north. But it does mean more rain, and potentially some increased attraction downtime.
Otherwise, we should be heading into the hot and blissfully uncrowded time surrounding Labor Day weekend. Magic Kingdom will continue to be almost empty on party days, and Hollywood Studios will probably keep being a bad choice on those party days as visitors opt for that park instead.
You May Also Like...
-

If you're a fellow Midwesterner, I would like to apologize on behalf of the weather that has finally decided to be…
-

We can all breathe a collective sigh of relief! Last week's break from Disney Data Dump wasn't permanent. My family and…
-

Welcome to August, folks! It's apparently already Halloween season - meanwhile, my family and I are leaving on our summer vacation…
-

Anyone else feel like you can finally breathe a sigh of relief now that the school year is over with all…
Have fun!! Safe travels, and thanks for the data analysis as usual. Love it!!!
Ha, I’m just going to miss you. I’m doing the following week. Fingers crossed for low crowds!
While I’m there, I’ll just tell everyone else to go home so it’ll be nice and empty for your trip 🙂
I always look forward to the data dump, and I can’t wait for an installment where you unpack the data AND have first-person experiences to back up what the data says!
Thanks Craig! I will do my best to live up to your expectations 😉