Disney World Resort Power Rankings: Fall 2021
New blog series, who dis? We’ve sliced and diced satisfaction numbers from Disney World resorts over and over again here at TouringPlans. We’ve compared them to prices, we’ve looked at them for specific party types, etc. And we’ve even used them to seed the very first WDW Resort Tournament. But now it’s time to introduce a new and fun concept that we’ll revisit each season. It’s the first edition of Walt Disney World Resort Power Rankings!! But what’s a Power Ranking? I’m glad you asked. We’re taking all of the reviews we have of Walt Disney World resorts (over 44,000 of them) and doing something a little different.

Different? Why different? Because sometimes different is fun. In the past, we’ve reported resort satisfaction as either an all-time calculation, or some average over an arbitrary period of time (past 2 years, past 3 years, etc.). Walt Disney World Resort Power Rankings will instead use a weighted average, which is described below. The cool part of a weighted average is that it takes every review into account, but the end result is more heavily impacted by recent reviews compared to older ones. We’ll refresh these power rankings every 3 months so that you can track which resorts are making moves. Then you’ll know what to ask for when you have the TouringPlans Travel Agents make your reservation.
Explain the Math!
In our WDW post-visit surveys (that anyone can fill out after they return from a vacation), we collect resort satisfaction data. One of the survey sections asks you to rate your resort (and room) on a variety of different factors. There are some specific metrics, and then there’s an overall satisfaction rating. That score ranges from “Very Dissatisfied” to “Very Satisfied”, with five total options to choose from. I have to convert each answer to some numerical equivalent in order to compare scores statistically. It makes sense for Very Dissatisfied = 1, Very Satisfied = 5, and so on. So average satisfaction at a resort is expressed as a number that’s an average of all of these scores at each resort.
But we also want to acknowledge that resorts change – refurbishments might happen, food offerings often change, if a resort hasn’t seen a refresh in a while, things might get more rundown, etc. So I want a way to emphasize survey responses that were submitted most recently. I have two options to do that. The first option is to just limit the responses I’m pulling to a specific timeframe (like the past year). But that ignores some history that might be interesting and impactful. The second option is a weighted average, where I still consider all resorts from all time but weight older ones “less”.
For the Walt Disney World Resort Power Rankings, I’m going to keep the weighting simple. I let any review from the past 3 months keep its full weight – it counts as a whole response. But if anything was older than that, I start taking weight away. I’ll go with the following weighting system:
- 3 to 6 months ago? 1/2 weight
- 6 to 9 months ago? 1/3 weight
- 9 to 12 months ago? 1/4 weight
- 12 to 15 months ago? 1/5 weight
- 15 to 18 months ago? 1/6 weight
- Etc.
So reviews from the past 3 months are six times more “important” than the reviews from 15-18 months ago, when calculating the overall score. That means the Power Ranking is going to reflect recent scores much more heavily, but still won’t totally ignore the past. When we revisit this score in the winter, we’ll be able to see how the scores and Power Rankings change compared to these initial Fall scores. For today, we’ll be comparing initial Power Rankings with the overall resort averages.
What are the Walt Disney World Resort Power Rankings for Value and Moderate Resorts?

In this graph, the black dots represent the overall average satisfaction at each resort for all time. For example, average satisfaction at Art of Animation all time is just above 4.6. The red dots all represent the Fall 2021 weighted average satisfaction, which weights recent reviews more heavily. For example, the weighted average satisfaction for Art of Animation in Fall 2021 is about 4.54. So we can easily see that compared to an all-time average, a weighted average that gives more importance to recent reviews negatively impacts the score for that resort. But did it change any overall rankings?

Well, for value resorts it didn’t … not even one bit. Art of Animation still reigns as the top value resort. But we also have to keep in mind that average prices at Art of Animation are much higher than any other value resort because of the large number of family suites. The Little Mermaid (standard) rooms have the lowest satisfaction out of the buildings at that resort. And the recent scores have been trending lower. The All-Star resorts remained closed longer after the pandemic – and All-Star Sports still hasn’t reopened. So we’ll see if some movement happens here as things begin to open up more.
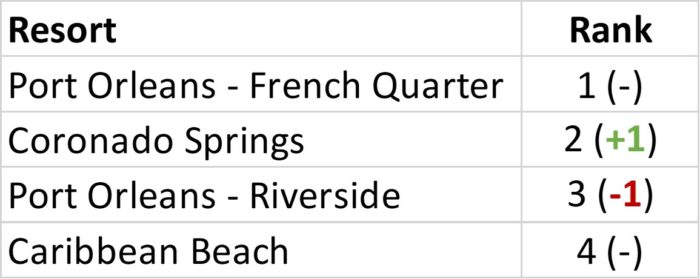
And for moderates there was only a slight shift as well. Neither of the Port Orleans resorts have reopened, so they haven’t been impacted by the post-reopening slump seen by other resorts. But Coronado Springs actually managed to claw its way up the rankings despite Riverside staying closed. Coronado Springs had a long history of some pretty mediocre satisfaction scores, but when Gran Destino Tower opened in 2019, that definitely changed. So while Riverside was able to outperform Cornado Springs prior to that big resort change, when we emphasize more recent reviews, Gran Destino Tower helps its resort edge out Riverside. For now.
What are the Walt Disney World Resort Power Rankings for Deluxe Resorts?

Once again, weighting recent reviews drops the average satisfaction at almost every deluxe resort. Three resorts were able to buck that trend – Yacht Club and the Polynesian with their increased satisfaction, and Animal Kingdom Lodge (Jambo) which saw almost no change. So how did this impact Power Rankings?

Well, now we start to see some bigger shifts that might impact choices. When we take all reviews from the history of ever, BoardWalk Inn takes the crown for the most satisfactory Deluxe resort. But in our inaugural Walt Disney World Resort Power Rankings, it gets bumped down to third. I guess people miss the clown face pool or something. Instead, Yacht Club jumps up to grab the top spot. I don’t think I could’ve personally predicted that one. Wilderness Lodge maintains its second-place finish. I’m very excited that Jambo squeaked its way into 4th place in the power rankings. And I mean squeaked. It got 4th place by virtue of … not seeing a post-reopening decline in satisfaction. So yay for it being just as good as it ever was?
Another big story here is the decline of the Grand Floridian. Wowee. It went from 4th place all-time to 8th place (and last of the Disney-operated) Deluxe resort. How could that be? Well, we can look at the average monthly score for the resort and see that post-reopening, it’s been a little all over the place – but definitely much lower than it ever was pre-pandemic.

What are the Walt Disney World Resort Power Rankings for DVC Resorts?

In general, results at DVC resorts shift around less with the weighting than at other resort types. There are a few decent declines and one noticeable improvement. But did slight shifts mean not much change in ranking?

Nope! Lots of changes here for our inaugural Walt Disney World Resort Power Rankings: DVC edition. New in the top spot is Riviera Resort, just ask about Julia all about it, she’ll be glad to tell you why! It dethrones the Villas at Grand Floridian, which drop all of the way into third. Previously, Grand Floridian didn’t even have any competition for the top spot. But it looks like 2021 has been rough for the Villas. Copper Creek (at Wilderness Lodge) was also able to hop over Grand Floridian and get very close to being number one of the DVC resorts. Other significant shifts include the Polynesian Villas and Bungalows going form 9th all time to 4th in the Fall 2021 Power Rankings, and Beach Club similarly improving from 8th to 5th. A few more resorts saw some drops, with Bay Lake Tower going from 3rd to 6th, and Boulder Ridge going from 7th to 10th. These can all change quickly because the difference from Grand Floridian (3rd place) to Animal Kingdom Lodge – Kidani Village (8th place) is only 0.03 on a scale of 1 to 5. So any new reviews could shift scores (and rankings) around pretty easily.
What Does This Mean For You?
- No matter where you stay, satisfaction can vary wildly depending on your actual building and room. Don’t forget to use the Room Finder to find the perfect location and view for you!
- Things at value resorts generally stay pretty stable. Art of Animation’s family suites are popular, but also expensive.
- Coronado Springs is a much different place than it was before 2019. It remains to be seen what will happen at the Port Orleans resorts when they open, but it contends with them for satisfaction. Caribbean Beach, despite its Skyliner proximity is still very behind the other moderate options.
- Things are all over the place with Deluxe resorts in the first Power Rankings list, with Yacht Club claiming the crown (for now), and Grand Floridian bringing up the rear (if you exclude Swolphin).
- Most DVC resorts are in a tight race. And surprisingly, the Villas at Grand Floridian aren’t in the top spot. Instead, that honor goes to Riviera – shh, no one tell my husband, who desperately wants to stay there.
Do you have any predictions about what will happen at resorts between now and January? Are you surprised by any of the power rankings? Do results of this sort of list impact where you might want to say? Let us know in the comments!

You May Also Like...
-

October 1 will be the kick-off of not only new fireworks shows, daytime shows, cavalcades, new attractions, and more. In addition,…
-

Back in October of 2021, we debuted a new way to look at satisfaction results for every resort at WDW. We…
-

Dining is always a hot topic at Disney World, and it's an ever-moving target. Dining location availability changes based on attendance…
-

Picture it: it's early fall 2021. Crowd levels are low. When someone mentions Genie all you do is get upset about…
What about the rankings for Fort Wilderness Campground/Cabins?
Let’s Party like it’s Fall 2011.
(There are 2 references in the article with the wrong year!)
I think what’s striking about the Grand Floridian figures is that, apart from the very reopening, there has not been one single review above 4.75, whereas previously there were loads of them. Maybe the musicians not being there has removed some of the ambience?
Ha, there were actually three! You almost passed my test! Just kidding – thanks for the catch. Although 2011 was a pretty good year.
I was definitely interested in the drop at Grand Floridian and Villas at Grand Floridian. I’ve never stayed at either, so I don’t have any good personal commentary on what might have happened.
Enjoyed the article and the #’s breakdown. Keep up the good work!
Thanks Tony!