Why Are My Favorite Attractions Always Down?
Earlier today, we took an initial look at WDW park capacity lost due to unexpected downtime over the past three years. We discovered a rather reliable cycle of increased downtime during periods of increased precipitation (aka, summer). But we also saw that overall downtime is increasing overall, and in every park other than Animal Kingdom. Why? What attractions are contributing to those trends? And is it really the weather, or could some other reason be the answer for the cycles?
To get those answers, we have to get one level deeper into the data. We need to look at the attraction-specific data. Maybe outdoor attractions show the cycle and indoor attractions don’t. Maybe certain attractions have been doing especially poorly and impacting that overall upward trend.

Explain the Math
If you read this morning’s post, you already know all about this data. Skip ahead to the (even more) interesting part!
If you look up any past date in the crowd calendar, you’ll see information about capacity lost due to downtime for each park. And if you look at any wait times graphs for any attraction for any date in the past, you can also tell when a ride is down by the lack of posted wait times for a specific time period. On top of that, we also have information about when queues get “dumped” – or the people waiting get cleared out due to a closure.
So over the course of the previous blog post and this one, we’ll dig into all three sources of information to try to answer some of my questions and give you some insights for your next vacation.
- We’ll look at trends of park-wide capacity lost due to downtime to see if we can answer high-level questions like “This problem seems like it’s getting worse and worse. Is that true?”
- We’ll look at attraction-specific downtime trends and averages to figure out if there are particular problem attractions to either avoid or plan your day around if they’re important. We’ll also be able to tell if super headliners have more problems that minor attractions, if newer attractions are more problematic than older ones … etc.
- And we’ll look at queue clearing to figure out if your overall goal is to avoid wasting time in a queue that is just going to spit you out for a closure anyway, which attractions might be the worst bets.
Animal Kingdom
We’re going to start with the only park that has seen a decrease in capacity lost due to unexpected downtime.
The first thing that we can figure out from the data is that only two attractions display the expected cycle of ride downtime and uptime. And those two attractions are Expedition Everest and Kali River Rapids. Hmmmmm … those happen to be the two outdoor attractions. Curious (but not really). These also happen to be two out of the three attractions with the most overall unexpected downtime in 2022. The third is DINOSAUR, and it exhibits steadily increasing (but not cyclic) capacity lost due to downtime.

When we look at the data for these two outdoor attractions, we see the cyclic nature that we’ve come to expect, but we also see it trending down. In July 2020, we could’ve expected a little over 9% of downtime for Everest each day, and about 7% for Kali River Rapids. But in July 2022, those expected numbers decrease to just below 5% for Everest and 4% for Kali River Rapids. That’s a lot of “regained” capacity. The trends might’ve looked even better if Everest had its normal “dip” in the winter instead of being closed.
Even better news – not many attractions at Animal Kingdom are frequently forced to dump their queues. Both Everest and Kali have only dumped their queues once every-other-day over the past month. In fact, the worst queue-dumping offender probably isn’t one you would expect – TriceraTop Spin takes the crown at Animal Kingdom, dumping it’s queue about once per day on average.
Magic Kingdom

Magic Kingdom is where we can get the best view of the real difference between outdoor and indoor attractions. In this case, outdoor attractions are defined as attractions that tend to close when severe weather moves into the area. And indoor attractions … aren’t. Magic Kingdom has many of both types of attractions. In the above chart we can see that the outdoor attractions have much bigger cyclic swings of downtime during the summer months, whereas the indoor attraction typically stay pretty steady. The exception there is late summer of 2021, when Space Mountain, Winnie the Pooh and Monsters Inc. Laugh Floor were all seeming to have unusual downtime problems.

In this chart, we see the top 5 most unreliable attractions at Magic Kingdom so far this year. Unfortunately, the top 5 most unreliable also have 4 of the biggest and most popular attractions in the park … plus there’s PeopleMover, which should be one of the top attractions in the park.
- Big Thunder Mountain Railroad is boring. Its trendline is basically flat, so I didn’t include it. Didn’t need to make that chart more busy than it already was.
- Two rides are getting more reliable – their average capacity lost due to downtime is going down. Those attractions are Splash Mountain and Seven Dwarfs Mine Train. Splash Mountain is still, by far, the most unreliable ride in the park, though. No matter the month, it pretty much always experiences unexpected downtime at least 10% of the time. Major bummer if you’re a Splash fan. This is actually the third-worst reliability in all of WDW.
- Two attractions are getting less reliable – PeopleMover and Space Mountain. In the past two years, both have gone from an average of 2.5% capacity lost due to downtime to over 5% (and almost 10% for PeopleMover) capacity lost due to downtime. Keep in mind that PeopleMover already had a length refurbishment, so this trend is based on data only after its reopening. Not a great trend coming off of a lengthy downtime. Perhaps Tomorrowland does need a big overall …
Interestingly, the worst offender for queue-dumping doesn’t appear on this list of least reliable attractions. That dubious honor is held by Prince Charming’s Regal Carrousel, which dumps its queue more than twice per day on average. Eek. The runners-up are PeopleMover, Splash, and Pooh, which are all forced to dump their queues about once per day.
EPCOT
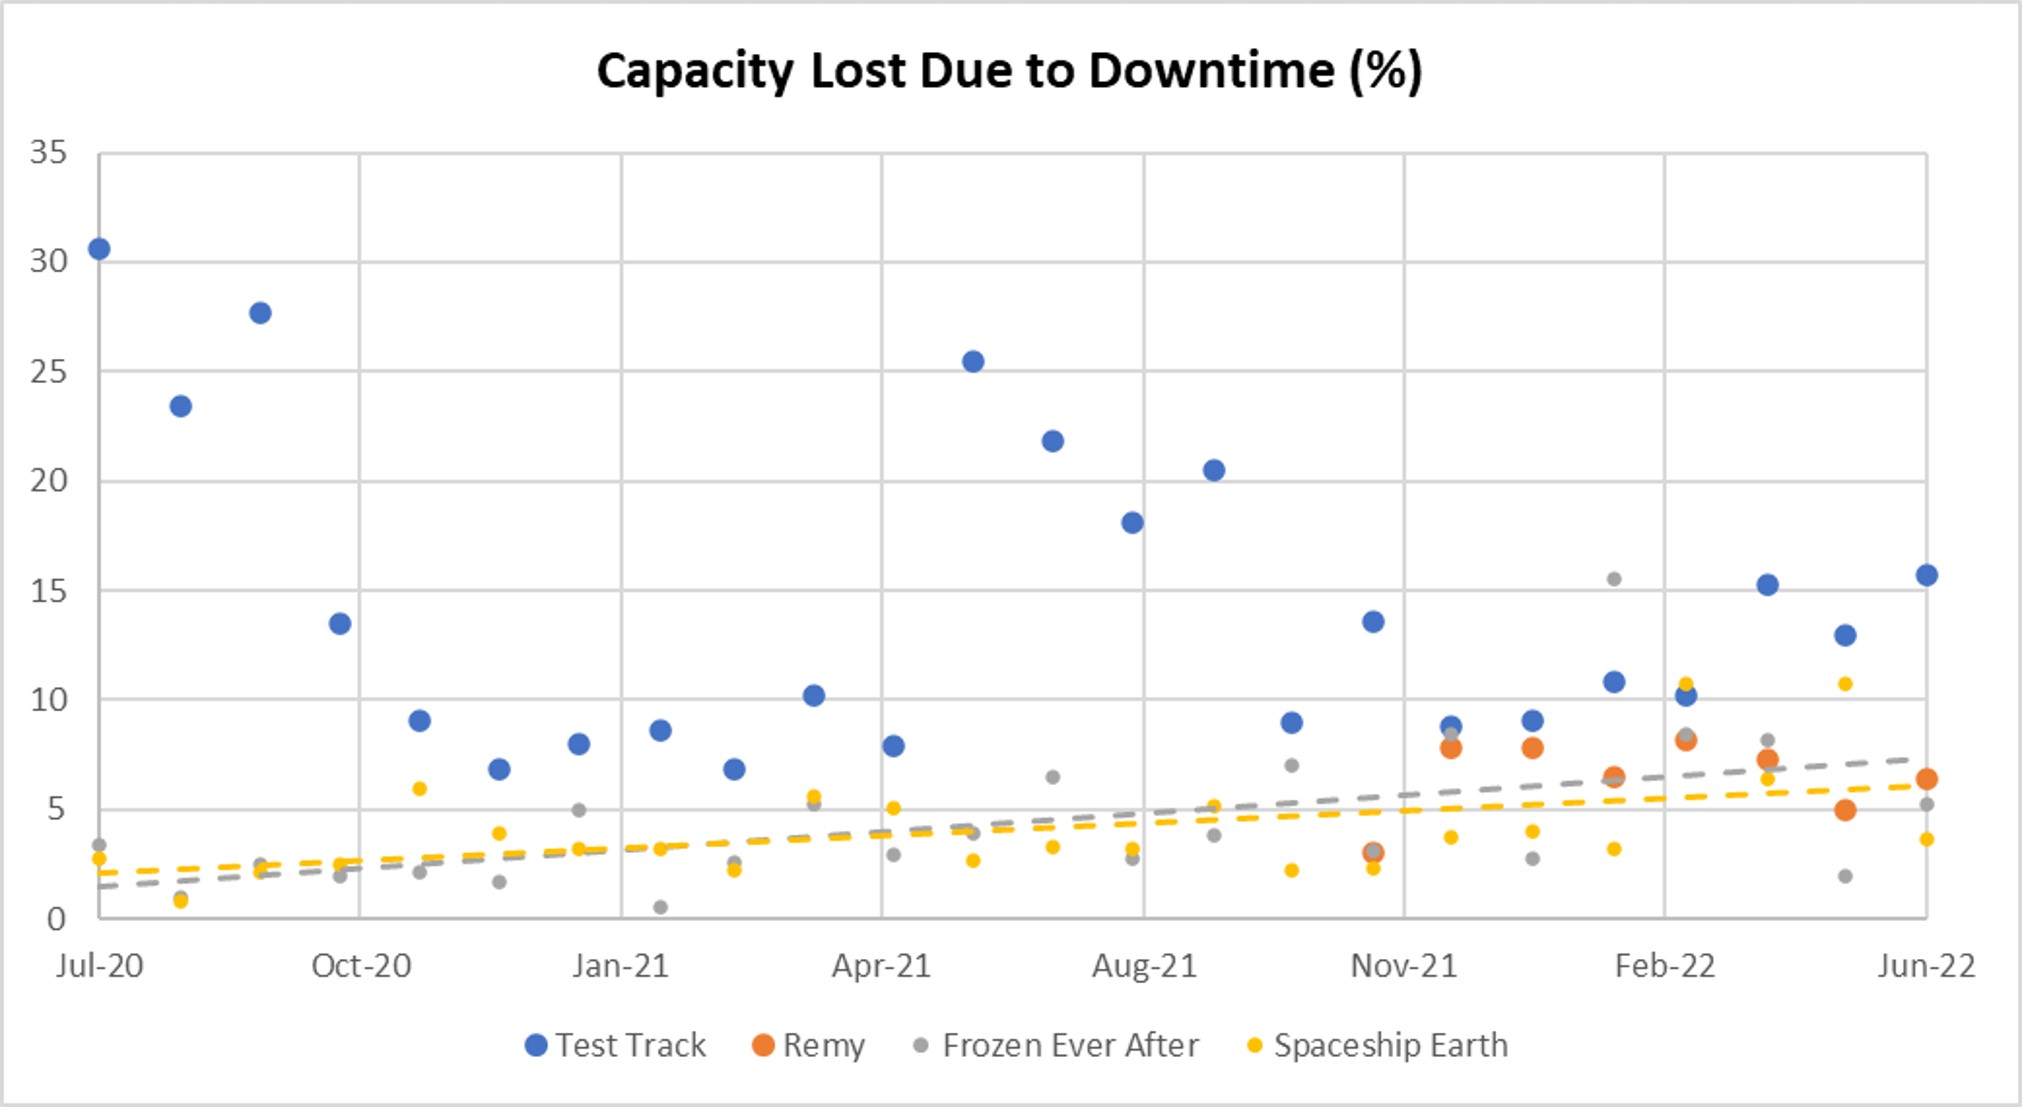
EPCOT is home to the most unreliable attraction in all of WDW! Wahoo for Test Track, which so far in 2022 has lost 12% of its total capacity to downtime this year. Ouch. Joining it on our list of unreliable attractions are Remy, Frozen Ever After and Spaceship Earth. The good news here is what doesn’t appear on the list, which is Cosmic Rewind. It’s had a not-too-shabby 2.2% average capacity lost due to downtime since it opened earlier this year.
- If we put a trendline on Test Track, it gets very thrown off by the AWFUL summer of 2020, when Test Track lost over 25% of its capacity due to downtime. Since then, there’s a pretty steady upward trend. To add insult to injury, Test Track also dumps its queue more than any other EPCOT attraction – 1.5 times per day, on average.
- Remy also isn’t particularly deserving of its own trendline yet, but it’s staying rather steady between 5% and 7% of capacity lost due to downtime. Not a great number, but at least it’s not increasing.
- What is increasing in unreliability? Frozen Ever After and Spaceship Earth. Both were at a respectable average of 2% capacity lost in the summer of 2020, but have increased all the way to that same 5-7% range as Remy as of spring of 2022.
Those increases may not sound like much, but if we add up just 7% lost capacity at Remy, Frozen, and Spaceship Earth, that’s 400 people not being able to ride, every hour of every day. 400 people every hour of every day that have to go find other attractions, or go spend money drinking their way around the world.
Hollywood Studios
Back in the park-wide analysis, Hollywood Studios was the worst. Just the worst. Capacity lost due to downtime was high and trending higher. We’re going to take a closer look at the six attractions with the most capacity lost due to downtime so far this year. First, the two attractions with steady or increasing reliability!

It’s nice to start with the good news, right? Slinky Dog Dash is subject to the weather, so it has those cyclic issues. But overall it’s trending better. Hooray! Runaway Railway doesn’t have the cycles, but has pretty steady downtime trends. Downtime is still pretty high – 5% capacity lost is still 80 people per hour all day every day just for this one ride. That’s something like 1,000 more people that could’ve ridden Runaway Railway each day, but couldn’t due to downtime.
And that was the good news! Now we get to the offender list. And goodness, these are doozies.
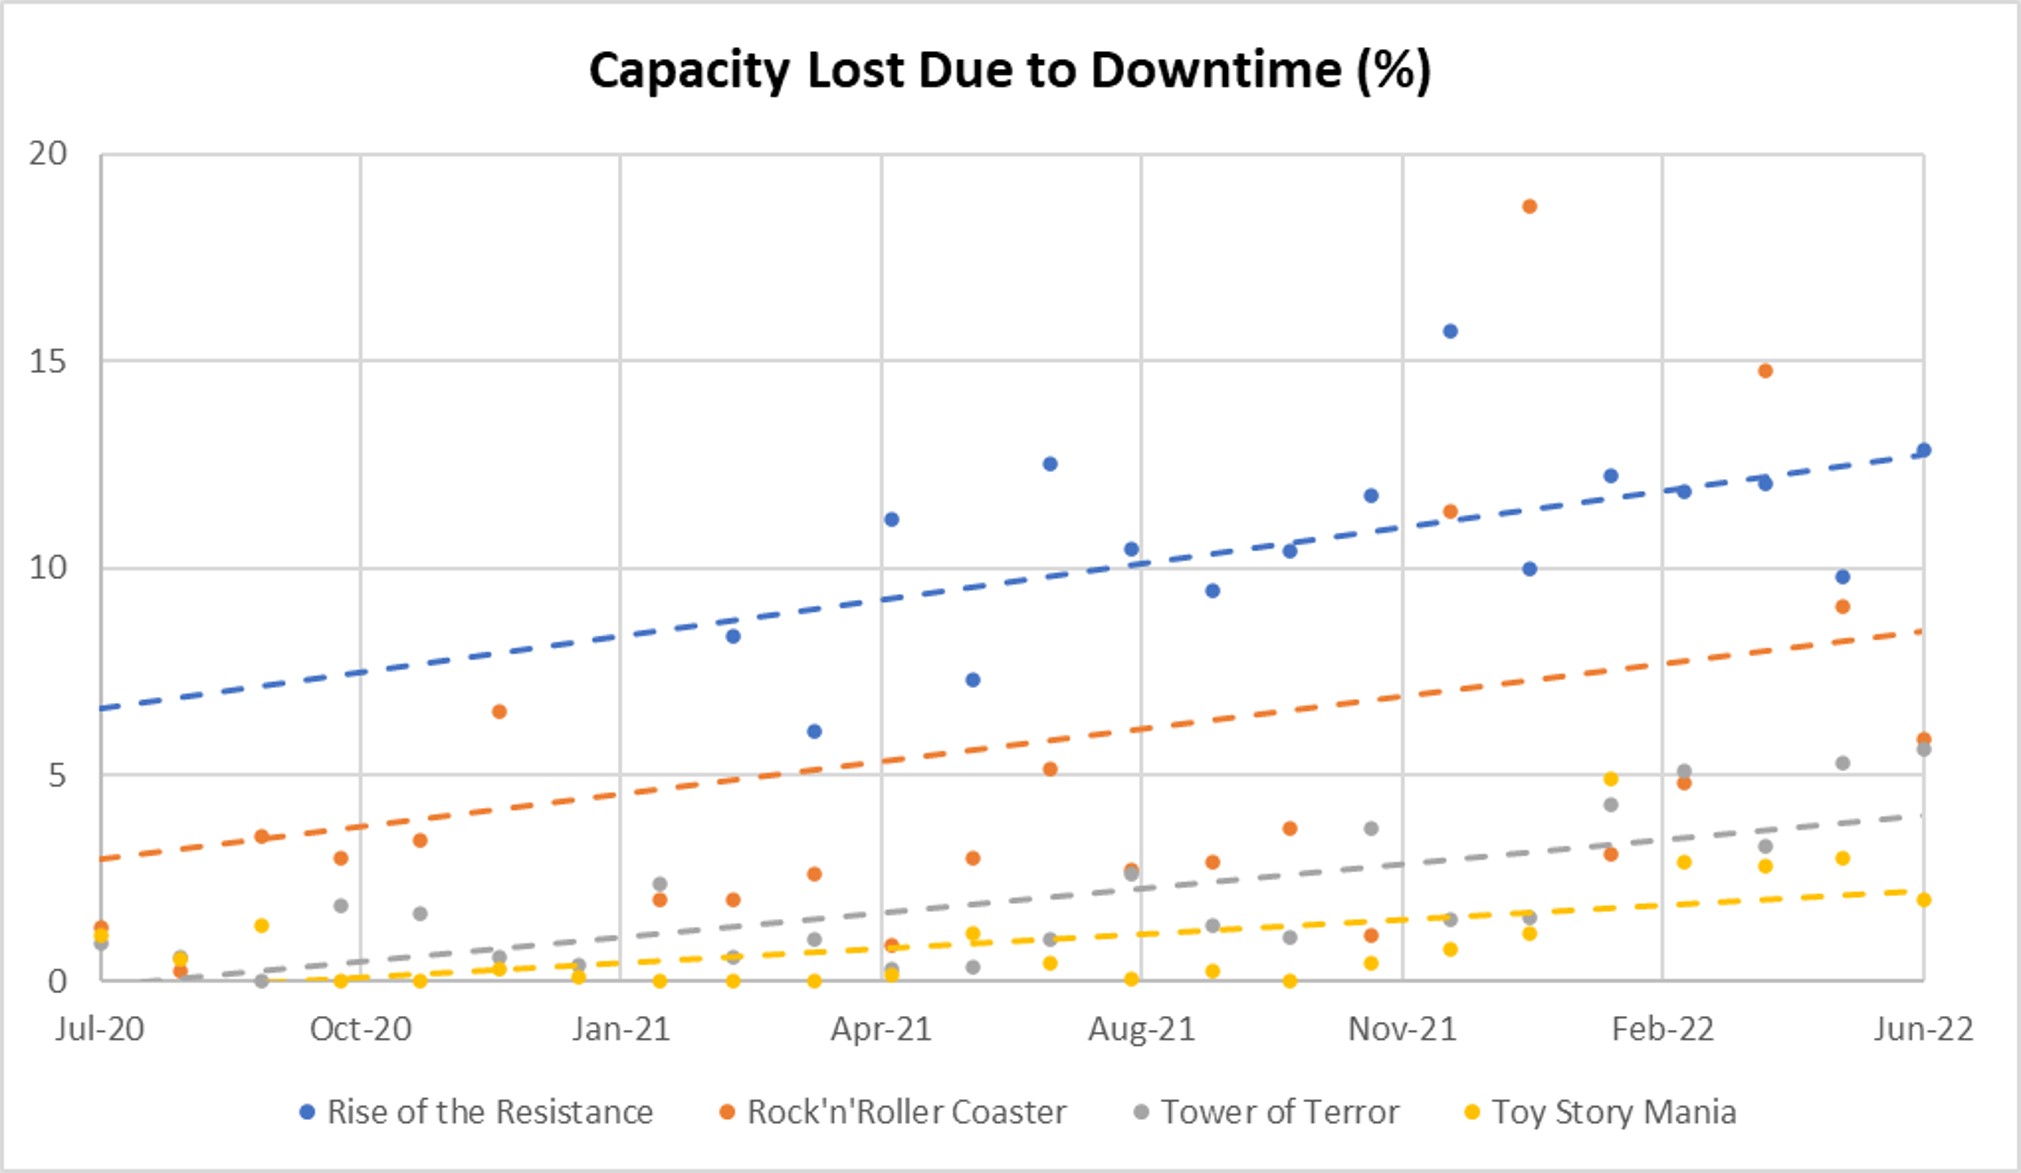
- Up until about June-ish of 2021, Tower of Terror and Toy Story Mania rarely had any capacity lost due to downtime. And that’s really changed recently. Tower of Terror has less wiggle room than usual because it’s already half-down for sneaky refurbishment. So there’s no backup. If the remaining elevator shaft goes down, the whole ride is down. But Toy Story Mania has also seen a big upward shift in the last 5-6 months that is remarkably unusual.
- Rock’n’Roller Coaster was another one that stood out to me mostly because I didn’t expect it. I can’t figure out the “why” behind this one very easily, other than maybe this one is just lack of recent extensive maintenance. Whole months with almost 20% of capacity lost due to unexpected downtime is really not great.
- And then we’ve got Rise of the Resistance. Coming in right behind Test Track, Rise has the second-worst reliability of any WDW attraction. In fact, for all of 2022, it’s lost over 11% of capacity due to unexpected downtime. And it dumps its queue more regularly than Test Track – almost 2 times per day on average. It’s not trending a good direction. Even if it evens out at something like 12%, that’s almost 200 people per hour, all day every day that can’t ride. And if the standby queue is an hour long, that’s something like 3400 people getting dumped out of the queue every day. Ouch.
What Does This Mean For You?
- If an attraction that is important to you happens outdoors, and therefore closes in rain – make sure to hit it early in the day before afternoon rainstorms develop. Plan ahead!
- At Magic Kingdom, the major headliners are the major problem-makers: Splash, Space, Big Thunder, and Seven Dwarfs Mine Train.
- At EPCOT, Test Track is difficult to plan around, and the other big players (Remy and Frozen Ever After) aren’t very reliable either, despite not being impacted by weather. Cosmic Rewind is a bright spot, though, so far.
- At Hollywood Studios – avoid everything? The park that already struggles with long standby lines and not many options is also the most prone to ride breakdowns. Rise of the Resistance and Rock’n’Roller Coaster are especially bad, but Tower of Terror and Toy Story Mania have also had recent issues.
Do any of these results surprise you based on previous visits? Do you have hypotheses about reasons behind the unreliability? Are there other ways you’d slice or dice the data? Let me know in the comments!

You May Also Like...
-

In honor of the upcoming 50th anniversary of Walt Disney World, which opened on October 1, 1971, we are highlighting the…
-

Spinner rides are sometimes pooh-poohed as being unworthy of Walt Disney World - flying spinners are a classic carnival ride; you…
-

In honor of the upcoming 50th anniversary of Walt Disney World, which opened on October 1, 1971, we are highlighting the…
-

In honor of the 50th anniversary of Walt Disney World, which opened on October 1, 1971, we are counting down the…
My optimistic reasoning is staffing limits, my middle of the road reasoning is oversight, and my pessimistic reasoning is intentional cost-cutting measure. But like you said, it’s concerning. If Disney doesn’t feel some heat from Universal’s Epic Universe expansion, I’m afraid they’re going to be left in the dust.
Thanks for this, Becky. I love seeing the data laid out for us. It makes me wonder why Disney is not keeping up with maintenance and refurb needed. Have they just not been thoughtful enough to reallocate sufficient resources into this, enough to keep up with the increasing numbers of guests in the parks? Is this yet another staffing issue? Or is it intentional, another cost-saving measure on their part? Any way you slice it, it’s concerning.
I thought the People Mover was THE Big attraction.
It is, Fritz. For the smart people, it is 😉
Can confirm Toy Story being down quite a bit. Was there last week of April and of the three mornings we tried to ride it, two times, it had one track closed and was having to funnel everyone over to one track
It’s amazing to me that there is so much redundancy built into that ride, and it’s still totally going down more regularly now.
What a depressing pair of articles today!
Two observations about Rise’s trend line: there is one point at I assume December ‘21 much higher than the rest (probably not an outlier by strict definition, but it stands out).
Did the data show Rise offline more often after dropping boarding groups? I hypothesize that is why the continued increase.
Can you compare the reliability of WDW Rise of the Resistance versus Disneyland’s version? And if dramatically worse (which I expect), what’s the explanation? Humidity? Or something else?
Ooooh, I haven’t pulled DL/DCA data yet, but I plan on it – and I love this idea of attraction pairs. Rise of the Resistance plus others! Putting it on my list.
This was my thought as well. What is the DisneyLand comparison. It is the most direct comparison we can get between the 2 parks.
I love all the data you pump out. Disney and data is the best. Regarding downtime, have you heard any buzz about when Tower of Terror is going to get out of its stealth refurb? I heard somewhere that they finished the first half and switched to the other two shafts, but I have no clue.
What I’ve read and seen (rumors only) is that it could take a long, long time. As in possibly not completed until 2023.
Turns out they may have finished the first 2 elevators. They haven’t started the next 2, but I would guess it will be at least a month to refurb those.