2021 Disney World Crowd Calendar Retrospective: Park by Park
Last week we held a little contest between Disney and TouringPlans as we reviewed the resort-wide performance of our Disney World Crowd Calendar. Travelers may choose the overall time of their visit based on the resort crowd level, but they often choose which park to visit on which day by comparing crowd levels at the parks. So this week we’re back for more review, but instead of the resort score, we’ll be looking at the individual park scores. It won’t be as exciting because we can’t beat up on Disney (just kidding), but we’ll do a little park-to-park showdown instead.
There are two ways we could walk through this: park by park, or month by month. I’m choosing to go through time because it will help us see how park-level errors might be related to each other. Also, it will save me from writing “and then in August we see that COVID flattened attendance” again and again on each park analysis.
January and February
A little intro for the visuals: for each month below forecasts are on top, and the error (predicted – observed) is on the bottom. For quality control a miss in either direction is bad, so the error calendars are orange and purple to avoid implying that green is good. But just so you can have a little hint to remember which way the error is: the number is the predicted level minus the observed one. That makes crowd levels that are worse than expected (underpredictions) come out as negative numbers. Errors of only +/- a single crowd level are not colored at all since we consider those to be “good enough”.
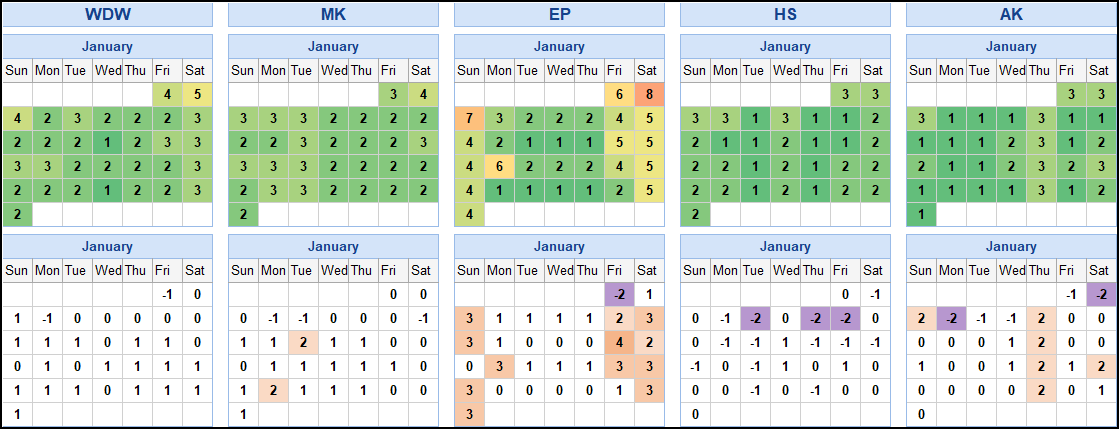

There’s not a lot to see in January and February. Weekends in Epcot are consistently overpredicted throughout both months. The Epcot Festival of the Arts ran from January 14 to February 21, and that means that weekend crowds get a boost from locals. The missing crowds here might mean that the boost wasn’t as strong this year, but there are probably also some out-of-state visitors who might have taken a quick weekend trip in other years and decided to postpone travel in light of the post-holiday COVID surge.
March and April
That was a super-quick summary for January and February, but we’re going to spend a lot of time with March and April. This is the first time we’re going to see some consistent trends and I want to really dig into them.
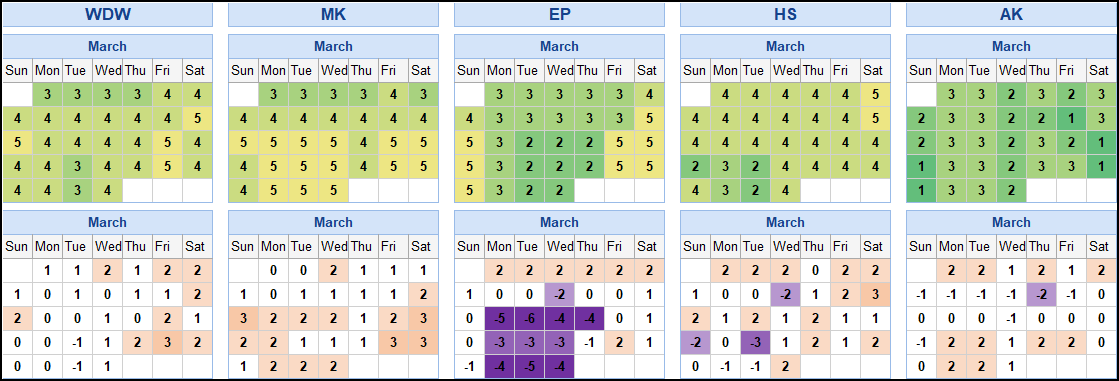

Question 1: Why don’t those underpredictions for Epcot show up in the resort calendar?
You might see that there’s some overprediction in the other parks, and assume that it’s averaging out if you add them together. There would be a lot of truth to that, and it’s why we can’t rely on the resort calendar to say how well we’re doing in the parks. But it’s not quite as simple as just adding up the park numbers and dividing by 4.
If you were totally obsessive very detail-oriented like me and you tallied up a few different days, you might notice something odd. On the 3rd Monday in March, the sum of the error from all the parks is -2, and the resort-wide error is 0. Two days later, on Wednesday, the sum of the error from all the parks is also -2, but the resort-wide error is -1. Whoa … what’s going on here?
The answer is in how the crowd levels are calculated. We start with a crowd level for each attraction, which is based on the wait-time distribution for that specific attraction. For forecasts this number comes from a prediction model and for observed levels it’s just what we saw in the parks. The resort crowd level is calculated by removing the highest and lowest predictions for each park and averaging the rest. Since the parks have different numbers of attractions, each park ends up having a different “weight” in the resort calendar. So you can see a general trend where over- and underpredictions may cancel out, but there’s no formula that you can use to go directly from the park levels to the resort level.
Question 2: Why do we see so much underprediction for Epcot?
Some of those misses are pretty severe, where we were off by 4 or 5 levels. This is Spring Break and Easter when crowds are usually very heavy, but to understand what happened with the calendar we need to remember where we were in pandemic time. More and more people were eligible for vaccination every day, but we were still a ways off from having a high percentage of the population fully vaccinated, and restrictions were still common in many places. Disney World was open, but attraction capacity was reduced, with rides loading every other row or every other car for social distancing. And overall park capacity — which is made up of not just attractions but also dining, shopping, and walking around — was severely limited.
Take a look at the chart below, which is a snapshot from April 28 that shows how far in advance Park Passes sold out for each date. All we care about here is the difference between the days that are gray, with passes available, and the days that are colored, showing that the park was completely booked.
You can see that for most days in this period all the parks are full except Epcot, and even Epcot is booked up for a few of them. We know that the resort overall was operating at 35% capacity during this period, but that capacity wasn’t evenly distributed among the parks. Looking at the crowd calendar, it turns out that we rarely observed a crowd level of more than 3 in the Magic Kingdom during this time. Since the park was at capacity (which we know because there were no Park Passes available), that means that the maximum crowd level achievable was about a 3 — our predictions of 4 and 5 over most of these weeks had no hope of coming true. We see a similar hard limit with Hollywood Studios, and though we don’t see it as clearly with Animal Kingdom, that’s probably because our forecasts for Animal Kingdom were lower to start with.
So we have a lot of people who might have been pushing our wait times up to 5 in Hollywood Studios, except that only “level 3’s worth of them” can get in because Park Passes are gone, and the same thing is happening in Animal Kingdom and Magic Kingdom. Where are all the people who couldn’t get into those parks going instead? Epcot! They’re going to Epcot, because Epcot turns out to have the lion’s share of that overall capacity, and that’s why wait times in Epcot were so much higher than our forecasts. It turns out that overpredictions and underpredictions compensating for each other in the resort calendar wasn’t accidental — it happened because we did a decent job of predicting the natural demand for attractions, but capacity limits forced people to distribute themselves among those attractions differently than we (and often they) had envisioned.
May

May looks a lot like January and February, with overpredictions on the weekends in Epcot (it’s Flower & Garden time now) and to some extent in the Magic Kingdom. There’s really nothing very exciting here, which to be honest is exactly the way we like it.
If we look closely, we can see that the max crowd levels have changed. Park Passes are still sold out every day in most parks, but now we’re seeing mostly 2-3 in Magic Kingdom, just 1 in Hollywood Studios, and also a max of 1 at Animal Kingdom. This is a good time to remind you that our crowd levels measure wait times and not the number of people in the parks. As we moved forward into the summer, vaccination levels rose and COVID levels dropped. Disney didn’t immediately respond by increasing overall capacity in the parks, but they did start to reduce social distancing and increase attraction capacity. Wait times (and our observed crowd levels) went down as a result.
June

In the early part of June our forecasts start to really climb as schools begin to let out. Most of the parks are still sold out every day, but we don’t see the massive underprediction for Epcot that we saw in March and April. Why not?
It’s because of the increase in attraction capacity that we saw in May. Guests were still getting blocked out of other parks and ending up at Epcot instead, but our higher forecasts for Epcot combined with the additional capacity to bring us closer to the mark. Now it’s the overprediction in the other parks that’s more extreme, because our predicted levels went up while the maximum attainable levels went down.
July

In early July we continue to see some overpredicting, but there are big signs that Disney has increased overall capacity limits. In late June more Park Passes were added for July, and on many weekdays passes are now available at all four parks. You can see this change in observed crowd levels as well, as we’re now able to see 5 in Hollywood Studios early in the month and 6 by the end of it. In mid-July we updated crowd levels for the rest of the summer to reflect these changes in attraction capacity.
August and September


The end of August usually sees lower crowds than the first two weeks, but not as low as the predictions you see here — COVID’s Delta wave is to blame for these exceptionally low crowds. Our forecasts for the last two weeks of August were pretty accurate whenever they were 1, but the reason we have so many 1’s on the calendar is that we responded to Delta by lowering our predicted levels in early August, and then lowering them again 12 days later. Those updates bought us smooth sailing all the way through September. September looks beautiful, doesn’t it? If only every month could look as beautiful as September.
October

October definitely does not look as beautiful as September. The first weekend in October was Walt Disney World’s 50th Anniversary, and pretty much everyone expected large crowds in the Magic Kingdom and Epcot. There was so much expectation of high crowds that we broke our own rules and predicted 10’s at Magic Kingdom and Epcot even though our predictions based on wait times were nowhere near that high.
On the actual day the expected crowds did materialize; the Magic Kingdom was jam-packed and even closed to park hopping at one point. Epcot was also very crowded. But most of the people in each park seem to have been buying merch, eating, or soaking in the atmosphere, because the wait times were so low that the observed crowd level of both parks was a 1. The overprediction of +9 on this day comes out to be our biggest observed error of the year, which is not surprising because it is literally as wrong as you can possibly get on a scale that goes from 1 to 10.
I don’t think anybody really knew what the Anniversary crowds were going to look like after the first weekend. Our models showed something in the middle of the road, but after much lower crowds in the first week, we adjusted our forecasts downward for the rest of October. Unfortunately, that week turned out to be the calm before the Columbus Day storm. This is what we usually say about Columbus Day:
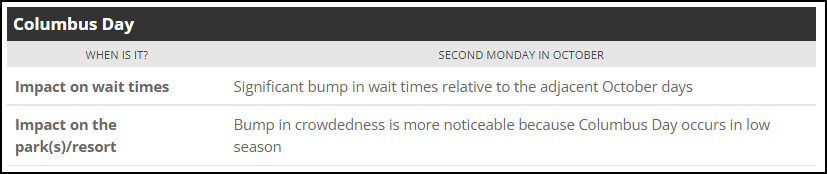
We do not usually see these Monday crowds keep going, and going, and going all the way through the week like the Energizer Bunny. We’re not sure what happened, but we think that it might have been families taking vacations that they had rescheduled from August. It was a rough 6 days for us on social media as we tried to decide whether we were seeing something temporary that we needed to ride out or an ongoing trend that we needed to adjust for, but on the 7th day we put the original forecasts back. And then everything was good. Kind of. Except for Hollywood Studios, especially in the last week. You know what? Let’s leave this dumpster fire of a month behind and move on.
November and December


In the first part of each month when crowds are lower we have a strong and confusing mix of hit and miss. Is there rhyme or reason? It’s hard to say. As we move through the Epcot Festivals we’ve arrived in Food & Wine season, COVID hotspots are continually changing, Lightning Lane queues have gone into operation, the weather has gotten more variable, starting in December some 5-11 year olds are fully vaccinated (which many families were waiting on for travel), and Annual Pass sales have resumed. We know that all of these things can affect both demand and demographics at Disney World, and trying to sort out how they’ve combined here is likely to be an exercise in futility.
In the heavy holiday seasons at the end of each month, we come back to a very familiar story. Park Passes are sold out in every park. We’ve predicted high crowd levels, but our forecasted levels are unattainable even though overall capacity has risen at every park; the result is overprediction by 3-5 crowd levels. Epcot is the only exception to this, and on December 19 and 20 we even see the underprediction come back at Epcot as it fills to its “brim” of 9 even though we’ve only predicted it at 7 and 6.
Which Park Is the Winner?
To compare park to park performance, we’re going to plot the number of days at each error level by park.

Ideally we want these distributions to be hill-shaped (the geek term is “unimodal”), and the good news is that they are. We’d like for them to be centered around 0, meaning that more days were dead on target than any other number, and again they mostly are — only the distribution for Magic Kingdom misses with 1 as the most commonly seen error level. The measurement that I used for ranking is On Target prediction, which is the percentage of days with prediction error between -1 and 1. Every single park has better than 50% On Target performance (yay!), but Animal Kingdom is the clear winner at 66.6%. You might feel like these results are surprising given how much time we just spent talking about where the calendars were struggling with accuracy, but remember that there were quite a few months when the calendars performed well — it’s just that we zipped past them quickly in the analysis.
Wrapping Up
I joked about beating up on Disney last week in the resort-wide calendar contest, but this week it really feels a bit like Disney was beating up on us. Of course, in reality Disney was just responding to changes in the pandemic and in some cases — like with plummeting attendance in August and September — they had as little control over external forces as we did over their operational changes.
You might wonder why we didn’t simply adjust our forecasts based on what we were seeing with capacity limitations. That is a terrific question and we would have loved to be able to do that. The problem is that the park crowd levels are built starting from the attractions and working up. To fix the mismatches we saw between our crowd levels and the park capacity, we would need to build new models and rescale crowd level distributions for each attraction in the affected parks. Both of these processes need a pretty large sample of days to work with, more than we could reasonably expect to collect before capacity changed again.
Our very first crowd calendar update in 2021 was titled “Post COVID-19 Crowd Calendar Update“, and discussed our prediction that as vaccinations rolled out Disney would begin to undo COVID-related capacity and operational changes and be mostly back to normal by summer. Obviously it did not work out that way, and we definitely hope for less of a rollercoaster ride in 2022. Our calendars performed pretty well this year despite the challenges, and here are our suggestions to help you get the best experience with them.
- Check crowd-level predictions shortly before your trip, since we make updates on a regular basis. Subscribers can use the crowd tracker and get notified automatically when we make updates to days they’re following.
- Take the time to look at the predicted attraction wait times for the park you plan to visit. Sometimes we get complaints from people who are in the parks on a level 3 day and are surprised by a 40-minute line; they don’t realize that what they’re seeing might be par for the course at level 3. Having realistic expectations can be the key to a great day.
- If you use a touring plan, reoptimize it every now and then during the day. Once the park opens our prediction is frozen in history, but we update our day-of wait time estimates frequently based on what we see in the parks. Even if our predicted crowd level turns out to have been way off, reoptimizing will help you to have an optimal day.
- Be careful with the Epcot crowd level. We don’t expect to continue seeing the underprediction issues with Epcot that we saw in the spring this year, but our calendars are based on wait times and Epcot has a lot of Festivals that can fill the World Showcase with people who are not riding any rides. If there’s a Festival going on then the difference between our prediction and what the crowd “feels like” will be most noticeable on weekends and in the late afternoons and evenings.
Are you planning a visit to Walt Disney World this year? What do you think the crowds will be like? Will all the parks return to 100% capacity soon? Let us know in the comments!

You May Also Like...
-

Wait times at Universal Orlando Resort are up, especially at the Universal Studios Florida park. We have seen crowd levels at…
-
This Crowd Calendar update just affects November and December 2021. The prior predictions were based on data prior to 2019. We expect…
-
Crowds have mostly been low so far for 2021. We expect the week of President's Day and Mardi Gras will be…
-
Happy Thanksgiving Everyone! Well, almost. We are anxiously waiting to see how many people head to Disneyland Resort for the holiday.…
Great article! Love the stats.
When looking at errors, if there is a bound to the measurement (1-10), you’ll get different types of curves. I would guess overall crowd predictions for 2021 were much lower than 2019. The lower the prediction, the less you’ll underpredict: if you predict a 1, you cannot underpredict, only over predict.
As you mention to another commenter, 2019 was very weird too! The EEMH made for very low crowds, and GE minus Rise didn’t bring crowds as Disney expected. Also, Dorian(?) knocked out crowds Labor Day weekend.
2018 was interesting too! At the beginning of the year, crowds & wait times were much higher than expected. It had Len speculating that capacity was being reduced. I think the flu that year impacted staffing. A virus impacting staffing!
As someone who visited WDW twice in October, the impact of Delta on the state cannot be overstated. We limited a lot in August & September after really enjoying a quiet, hopeful June.
Really appreciate this retrospective. This was definitely a unique year. Is there any way we can get a similar article for DLR? Would be very helpful in knowing how much to rely on it for future trips.
Thanks!
Hi Tiffany, we should have the DLR review within the next couple of weeks, and UOR shortly after that. I’d be cautious about assuming too much based on DLR results from this year though. Arguably it was an even odder year at DLR than it was at WDW, since the resort didn’t even reopen until the end of April.
Great article. Love the data as always.
In terms of the overall bell curves, was this year a rough one with COVID? Or did it overall end up being about par for the course? (Meaning, how often do curve-balls come up in more normal years, like 2018 or 2019.) I’ve been assuming it was a rough year, but I don’t technically know.
I get that in terms of modeling and making the predictions accurate, over and under prediction are both bad. But as a user, I care much more about underprediction than over prediction. So honestly I’m happier with the shape of these curves than a perfect bell curve. Both have impacts, but the impacts of overprediction are much less bad.
If you overpredict, maybe I get out of bed 10 mins earlier for rope drop than I needed to. Or maybe I pay for Genie+ for Epcot when I didn’t need to. Or maybe I pay for an ILL pass. I mean, that sucks. But I might also find myself with a longer afternoon nap break, and a more pleasant day.
But waaaayyy worse is my entire touring plan falls apart because the lines are much longer than expected. Suddenly I’m skipping attractions, or having to do a more rope-drop days. So I’d rather see the red than the purple.
Also, by my count there were 67 days in the year that were purple in at least one park. That’s approx. 18%. Or in other words, there are 18% of days where I would have been disappointed, IF I visited exactly the wrong park or parks.
As a whole, I count 98 purple days out of 1460 park days. That’s just 7%. So if I picked a park randomly, I had a 7% chance of being disappointed. That sounds even better*.
In such a complex year, I honestly think that’s very impressive.
(*Though I do realize that I don’t pick parks randomly. Overprediction can lead to those parks being picked. So I suppose the 7% is a little misleading in the positive direction.)
*Underprediction sorry, not overprediction
I guess the biggest problem from a PR perspective for Touring Plans is that the issues are often clustered together. So a major systematic error can really mess up a whole vacation plan. But still, you can only do what you can do.
Okay, I’ll stop commenting now lol.
@TwoBits – yes, exactly.
Hey DL, lots of comments/questions, I’ll do my best. 🙂 (But seriously, I’m always happy when people read all the way to the end of a monster article like this).
I only went back to 2018 to look at the curves, but the answer is mixed. Definitely in both years the distributions had a more central tendency without the skew to the right that we saw this year. 2018 was a great year with every park except AK over 60% in On Targets (AK was 55%). 2019 was nowhere near as pretty, but … there was a curveball. Without really digging in the way that I did in this article, (read: I could be totally wrong about this) remember that 2019 was the year Galaxy’s Edge opened, and in two separate bursts to boot, and there were 3 hour EMH for a couple of months!. Lots of people strategically maneuvering around early, late, postpone, visit now, etc., and new attractions in a park always take a while to stabilize from a CC perspective. In 2019 HS had a measly 48% On Target (but more overpredictions than under), but the rest were all between 55% and 60%. We’ll never know, but I think that if 2020 had been a normal year we would have seen a return to something more like the accuracy of 2018 as we got better at predicting the “new, with Galaxy’s Edge” normal.
Re: overpredictions vs. underpredictions – sounds to me like you’re saying you’d prefer to have rain in the forecast and carry an umbrella that you don’t need than get wet after seeing that the report promised only sunny skies. From a “if you have to pick one” perspective we totally agree, not least because we want our users to have a great experience (and because nobody complains to us about it when we overpredict).
Re the clusters: yassss! It is not that we don’t notice these things happening, it’s that it’s so hard to tell when it’s right to pull the trigger and when something will settle on its own. People! Always acting like they have free will or something! More seriously, I think it’s not so much that the issues are _always_ clustered together, as that when they are they can (as you note) affect someone for their entire vacation. Someone zips down for a 4-day weekend in December and the weather is *outrageously* beautiful that particular weekend? They can get whammied by a 2-level underprection on every single day if their park picks are unlucky, and this kind of thing isn’t even a systemic error.
Thanks for reading!
Thanks so much for the detailed response 🙂 Very helpful. No further comments :p
In those situations, really no reason to change the crowd levels as it would not help your customer base of type-A planners who had their vacation dates and reservations planned months in advance. You would just need to smile and apologize and reemphasis to use a touring plan and reoptimize in the Lines app often.
Very interesting article! I can’t imagine how hard it has been to predict crowds in the current environment. With everything going on right now are there going to be any forthcoming crowd calendar updates for February and beyond?
Hi Craig, it’s definitely true that unless you have a crystal ball, predicting the future works better when it looks something like the past. 😉 But we’re always up for the challenge – yes, there definitely will be updates coming this year. The next one will probably come out in February, but it might be a bit later depending on what we’re seeing, especially given that Omicron is really shaking things up right now.